197
Application of Color Segmentation
To Help Partial Color Blind People
Mhd.Afan Sakinah
[1], Lifwarda
[2], Ratna Dewi
[3]Teknik Elektro, Politeknik Negeri Padang, Kampus Limau Manis, Padang, 25163, Indonesia E-mail: [email protected],
Abstract—Partial blindness is a condition where one can’t see some colors because the color blind can not distinguish some light
waves. To know the color blindness of a person is usually used tests using Ishihara image, which consists of a mixture of random colors that contain patterns of numbers or images that will confuse the color blind.
In this study, applying image processing to help color blind people see the pattern of numbers in the image Ishihara. If people with color blindness cannot read numbers correctly then color segmentation is necessary. To process the image of Ishihara in order to be seen by the colorblind sufferer used the method of color segmentation to separate the pattern of numbers in the image Ishihara with other color background. By making the image that has been in the segmentation into a color reference then the color blind will be tested again using the image Ishihara before segmentation process.
Test data to color blind people. Before to the color segmentation, there was a lot of error reading by the color blind patient, the percentage of true numbers was only 17.898%, after the segmentation process there was an increase in the ability to read the pattern of figures contained in the image Ishihara 38.63%, so the total of the percentage of readable numbers true to 56.354% .
.
Keyword: color blindness, color segmentation, enhancement ability to read.
I.INTRODUCTION
Partial color blindness is a condition where someone can not distinguish certain wavelengths of light. This is caused by changes inthe sensitivity of the conic cell photoreceptors in the retina of the eye. The blindness of generally caused by parent genes and a small part caused by consuming excessive chemicals. The data show that there are 8% of male color blind people and only 0.4% of the female with color blindness [1].
The Ishihara test is the most widely used method of color blindness [1]. The Ishihara test was developed by Dr.Shinobu Ishihara. This test was first published in 1971 in Japan [2].
In this study using digital image processing program to help color blind people to recognize the existing colors in theimage Ishihara using color segmentation method that is able to separate the colors contained in the image Ishihara and display it separately, so that the color blind can compare the color that has been separated with the one on ishihara image. The purpose of this research is to help the colorblind sufferers increase the percentage of numerical pattern reading in ishihara image.
II.BASICTHEORYANDALGORITHM
A. Anatomy of the Eye
Visual perception is strongly influenced by the anatomic structure of the eye. Like a camera lens to focus the image so it can be captured by the retina. It is this structure that affects the perception of color [3].
A shadow to the eye will be projected on the retina. This section consists of photoreceptors that will convert the incoming shadows into nerve impulses that are forwarded to
the brain. This is where the visual process takes place [3].
198 Visible light can be seen by the eye because the wavelength is acceptable to the photoreceptor of the eye. The wavelengths present in the eye range from 0.2 μm to 0.5μm which has a frequency of 6x10¹⁵ to 20 × 1015 [1].
Fig. 2. Spectrum Range Waves. [4]
In the spectrum of electromagnetic waves only a small portion can be seen by the human eye that is visible light [1].
B. Color Blindness
Color blindness is a hereditary disease that is expressed in men, not in women. Women only as carrier genes. The term color blind does not mean that the colorblind cannot see the overall color. But there are symptoms of power deficit see a particular color only.
Inborn color blindness is distinguished over total color blindness and
partial color blindness. Colorblind is commonly suffered by men while women are recessive genes, research stated that one in 12 men suffer from color blindness, while women are only 1 in 200 people [5].
Visual perception is strongly influenced by the anatomic structure of the eye. Like a camera lens to focus the shadow so it can be captured by the retina. This structure has an effect on the perception of color.
Shadows coming into the eye will be projected on the retina. This section consists of photoreceptors that will convert the incoming shadows into nerve impulses that are forwarded to the brain. This is where the visual process takes place.
The fovea part consists of a conical cell but resembles a stem. An important difference between a stem and a cone is its function. The function of a stem cell is to look in a less light condition while the cone cell is tasked for vision with sufficient light [3].
Fig. 3. cross-section of the retina.
Fig. 4. Representative representation of the distribution of S, M, L cone cells in the retina
Based on its responsiveness, the conical cells are divided into 3 sorts, S cone, M cone, L cone, while the stem cells consist of only one cell type. This naming is based on the sensitivity of the cell to the wavelength, short wavelength, middle wavelength, and long wavelength.
There is also a name this wavelength as RGB (red, green, and blue) however, the naming of SML is more appropriate. In conical cells, there are 3 types that display the color, while the stem cell is only one type, indicating that the stem cell is not able to identify the color. The S cell is spread evenly over the entire retina, but not in the center of the fovea. The ratio of L: M: S is 12: 6: 1 [3].
Fig. 5. Normal eye vision and eye blindness.
C. Color Blindness Level 1. monochromacy
monochromacy is a condition where is someone has only a pigment cell cones or all cell cones does not work.. Monorhromacy there are 2 types:
a. rod monochomacy (typical) is a type of color blindness caused the inability to distinguish colors as a result of the non-functioning of all retinas so that the patient can not distinguish the colors so that it looks just black, white, and gray [5]. b. Cone monochromacy (atypical) is a rare type where
the patient still can see a certain color [5]. 2. dichromacy
199 a. protanopia is a dichomacy that causes the sufferer
can not see the red color [5].
Fig. 6. Transformation in red wavelength sensitivity [5].
a. Deutanopia is a disease of color blindness that causes people can not see the color green (red-green hue discrimination) this caused they are difficult to distinguish the color red and green. [5]
Fig. 7. Transformation in wavelength sensitivity of green [5].
a. Trinatopia is a disease of color blindness that causes the patient can not distinguish between blue and yellow. [5]
3. anomalous trichomacy
Anomalous trichromacy is a type of color blindness that causes damage to the vision system in one of the colors.
a. protanomaly is a disease of color blindness that
causes low eye sensitivity againt the red color vision.[5]
Fig. 8. Red wavelength shift [5] b. deuteranomaly is a disease of color blindness
that causes low eye sensitivity to green. [5]
Fig. 9 Shift wavelength green color
c. tritanomaly is a disease of color blindness that causes the sufferer to lose sensitivity to the blue color. [5]
D. Image
The image is the result of a two-dimensional analogue image that changes into a continuous two-dimensional discrete image. The image consists of a matrix that has row and column elements called pixels. [6]
Digital imagery has an important role as a form of visual information, digital images are arrays that contain real values that are represented by a certain particular bit [7].
Literally the image is an image in the field of two dimensions that are reviewed mathematically, the image is a kuntiniu function of the intensity of light in the field of two-dimensional. This happens when the light source illuminates the object and reflacted back. This light reflection is captured by optical devices [8].
F. Image processing
Image processing is a process for manipulating images with the help of a computer. Image processing aims to [9]:
1. Improve the quality of a picture.
2. Processing information contained in an image.
Image processing is a signal processing that has an image input, the output can be an image or can be a set of characteristics or parameters associated with the image [10].
G. Image segmentation
Image segmentation is one part of image processing. The purpose of image segmentation is to take information from the image. The approach can be the intensity approach, the color approach, the shape approach [11].
Image segmentation can also be interpreted as an image processing process that aims to separate objects from the background to be easily analyzed and recognized [12].
Image segmentation is the process of breaking an image into non-colliding parts. The result of segmentation is a corresponding pixel group [13].
H. Color space HSV.
HSV is a color space that represents the color seen by the human eye. Hsv has 3 Components including Hue, Saturation and Value [1].
200 There are 3 equations to convert RGB image to HSV.
The HSV color space is a nonlinear transformation of the RGB scope [14].
I. Ishihara Test
The ishihara test is a test developed by Dr. Shinobu Ishihara. This test was first introduced in 1971 in Japan [2].
Citra Ishihara consists of 24 plates where each has a different object, the object color (object color), and background color (background color). That form the pattern of numbers and images. The image of Ishihara commonly used is more dominant using red and green, so it can only be used to know the partial color blindness to the red-green color. As for the partial color blindness to the blue-yellow color will be difficult to know from this test because the image of Ishihara very little use of blue and yellow. That is why it’s needed the manipulation of 24 plates of Ishihara's red-green image becomes 48 plates with the addition of 24 plates of blue-yellow image.
Fig. 11. Ishihara images.
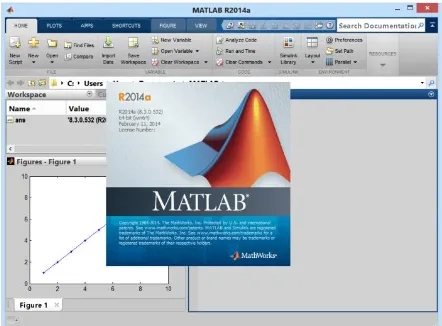
J. Matlab R2014a
Matlab is a high performance language for computing engineering problems. Matlab integrates computing, visualization, and programming in a very easy to use model where the problems and solutions are expressed in familiar mathematical notation. the use of matlab covers the field of mathematics and computing. Formation of data acquisition algorithm modeling, simulation, and prototype making, data analysis, exploration and visualization, scientific graph and engineering field is an interactive system that has data elements in an aray so that we no longer mess around with dimension problems. This allows us to solve technical problems related to computation, especially related to matrix and vector formulation, which is a specter if we have to solve low-level languages like pascal, C and basic.
Fig. 12. Tampilan awal Matlab R2014a.
The name Matlab stands for matrix laboratory. Matlab was originally written for easy access to the matrix software that has been created by LINPACK and EISPACK. Currently Matlab devices have merged with LAPACK and BLASlibrary. which is a unity of a separate art in software for matrix computing. In a technical college environment, matlab is a standard tool for introducing and developing mathematical, engineering and scientific presentation of mathematics. In industry, Matlab is the tool of choice for research with high productivity, development, analysis and matlab features have been developed, and more familiar with the toolbox name. It is very important for a matlab user, which toolbox supports to learn and apply the technology being studied. These toolboxes are a collection of matlab functions that have been developed into a working matlab environment to solve problems in a practicular classroom. Areas that can be solved with the current toolbox include signal processing, control systems, neural networks, fuzzy logic, wavelets, and others.
Block diagrams used for data retrieval are as follows:
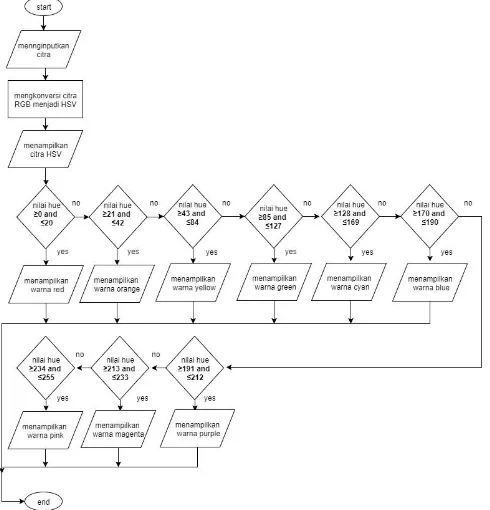
201 To realize the application of this color segmentation into the program required a flowchart-like algorithm as in fig.13.
Fig.14. flowchart application color segmentation.
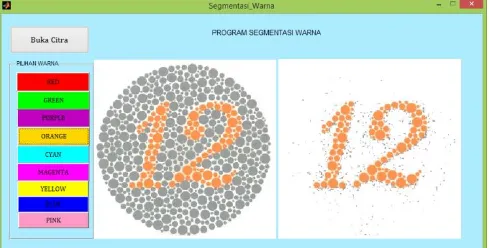
After making the application using matlab R2014a. Generated app display as below:
Fig. 15. Initial view of the application.
The data collected by 6 respondents using 13 ishihara image that has been prepared.
Fig. 15. Input image.
The first step of data retrieval is the colorblind sufferer is asked to read the pattern of figures that exist on the prepared
ishihara image.
Fig. 16. Preliminary image before segmentation.
The second step of data retrieval is done by asking colorblind people to choose the color choices they want to see while discovering what colors they can not see correctly.
202 The process of segmentation occurs in this process the previously random colored ishihara image will be separated one by one from another color. After that the color blind patient will be asked to re-read the pattern of numbers in the image ishihara at the beginning.
Fig. 18. Image of result after segmentation.
III.RESULT AND DISCUSSION
From the test results in color blind patients obtained test results as follows:
Graph. 1 before segmentation data
Graph. 2 after segmentation data
can be seen on the graph .1 seen some percentage of numbers that can be seen correctly by colorblind sufferers such as for image ishihara 1, 2, 3, 4, 5, 6, 7, 8, 9, 10, 11, 12, 13, 100%, 33.3%, 33.3%, 0%, 16.52%, 16.2%, 16.52%, 16.2%, 0%, 0%, 0%, 0%, 0% . here it is seen that the sufferers of color blindness difficulty in recognizing the color pattern that is in the image ishihara.
After the process of segmentation color can be seen in the graph. 2 percentage change of number which can be seen by
colorblind patient that is ishihara image 1, 2, 3, 4, 5, 6, 7, 8, 9, 10, 11, 12, 13 Are 100%, 100%, 83.3%, 83.3%, 66.6%, 83.3%, 100%, 16.5%, 16.5%, 49.95%, 66.6% , 16.52%, 33.3%. It can be concluded that there is a significant increase occurs after the color blind sufferers do color segmentation.
IV. CONCLUSION
Image processing program using color segmentation method is very helpful partial color blind people to see the numbers in the image ishihara. There is an increase in the ability to see the color ranges from 38.63%, which was originally only Before the color segmentation, the percentage of the correct figure seen by the colorblind is 17.898%, after the color segmentation process, the percentage of the correct number becomes 56.354%.
V. ACKNOWLEDGMENT
We would like to express our gratitude to Padang State Polytechnic that has given the opportunity to do this research, especially to the Department of Electrical Engineering Prodi D4 Telecommunication Engineering which has directed to do this research well.
VI. REFERENCE
1. Hamid Nur, Kusworo Adi, Penentuan Tingkat Buta Warna Dengan Metode Segmentasi Ruang Warna Fuzzy dan Rule-Based Forward Chaining Pada Citra Ishihara, Youngster Physics Journal, 2015, Vol 4, No 2.
2. Jumarlis Mila, Perancangan Sistem Aplikasi Uji Buta Warna Online,Jurnal IT STMIK HANDAYANI, Vol 15, 2014.
3. Kartika, keishatyanarsha Kuntjoro, Yenni, Yohanie Halim,
Patofisiologi Dan Diagnosis Buta Warna, CDK-215, Vol 41, No 4, 2014
4. Dewi Lovy Amirla, Agus Purwanto, Heru Kuswanto, Pergeseran Spektrum Pada Filamen Lampu Wolfram Spectra Displacement of Wolfram Lamp, Jurusan Fisika, FMIPA, UNY, Seminar Nasional MIPA: Yoogyakarta, 2006
5. Kurnia Rahmadi, Penentuan Tingkat Buta Warna Berbasis HIS Pada Citra Ishihara. Jurusan Elektro Fakultas Teknik Universitas Andalas, Padang, Seminar Nasional Aplikasi Teknologi Informasi; Yogyakarta, 2009
6. Sianturi Charles Jhony Mantho, Analisis segmentasi Citra USG Hati Menggunakan Metode Fuzzy C-Mean. Jurusan Teknik Informatika, Universitas Potensi Utama, Citec Jurnal, Vol. 2. No. 3, 2015. 7. Robbani Ihwanudin Hasan, Enny Trisnawati, Rakhmadina Noviyanti,
Afrizal Rivadi, Fadhila Puji Cahyani, Fitri Utaminingrum. Aplikasi Mobile Scotect: Aplikasi Deteksi Warna Tanah Dengan Teknologi Citra Digital Pada Android. Program Studi Informatika, Universitas Brawijaya. Jurnal Teknologi Informasi dan Ilmu Komputer, Vol. 3, No. 1, 2016.
8. Permadi Yuda, Murinto. Aplikasi Pengolahan Citra Untuk Identifikasi Kematangan Mentimun Berdasarkan Tekstur Kulit Buah Menggunakan Metode Ekstraksi Ciri Statistik. Program Studi Teknik Informatika, Universitas Ahmad Dahlan. Jurnal Informatika. Vol. 9. No. 1, 2015.
9. Kamal Mazid, Ruri Suko Basuki, Segmentasi Citra Daun Tembakau Berbasis Deteksi Tepi Menggunakan Algoritma Canny. Teknik Informatika , Universitas Dian Nuswantoro, Semarang.2016. 10. Ellanda Aulya, Suci Aulia, Yuli Sun Hariyani. PerancanganAplikasi
Pembaca Warna Untuk Penderita Buta Warna Berbasis Android.
Prodi d3 Teknik Telekomunikasi, Fakultas Ilmu Terapan, Universitas Telkom. Jurnal Elektro Telekomunikasi Terapan. 2014.
203 Rectangle. Jurusan Teknik Informatika, Fakultas Teknologi Industri, Institut Teknologi Nasional Bandung. 2015.
12. Kumaseh Max R., Luther Latumakulita, Nelson Nainggolan,
Segmentasi Citra Digital Ikan Menggunakan Metode Thresholding.
Program Studi Matematika FMIPA Universitas Sam Ratulangi, Manado, 2015.
13. Putranto Benedictus Yoga Budi, Widi Hipsari, Kanton Wijaja,
Segmentasi Warna Citra Dengan Deteksi W arna HSV Untuk Mendeteksi Objek, Fakultas Teknik Program Studi Teknik Informatika,UKDW, Yogyakarta. Jurnal Informatika, Vol.6, No.2, 2010.
![Fig. 1. Anatomy of the Eyeball. [3]](https://thumb-ap.123doks.com/thumbv2/123dok/4056158.1999578/1.595.362.496.573.698/fig-anatomy-of-the-eyeball.webp)
![Fig. 2. Spectrum Range Waves. [4]](https://thumb-ap.123doks.com/thumbv2/123dok/4056158.1999578/2.595.362.523.85.225/fig-spectrum-range-waves.webp)
![Fig. 10. Elements of HSV. [5]](https://thumb-ap.123doks.com/thumbv2/123dok/4056158.1999578/3.595.320.499.565.717/fig-elements-of-hsv.webp)