Emir. J. Food Agric ● Vol 28 ● Issue 9 ● 2016
Morphological variability of Indonesian rice germplasm
and the associated SNP markers
Puji Lestari*, Dwinita Wikan Utami, Ida Rosdianti, Muhamad Sabran
Indonesian Center for Agricultural Biotechnology and Genetic Resources Research and Development-IAARD, Jl. Tentara Pelajar, No.3A Bogor 16111, Indonesia
INTRODUCTION
Rice (Oryza sativa L.) is widely grown in the world to diet billions people living in the subtropics and tropics. The crop will continue to remain a main source of daily food by growing population in many regions (Sasaki, 2002) and contributes toward food security not only in the world but also in Indonesia. In Indonesia, even
though national rice production increases significantly
in comparison with that of one decade ago (Tobias et al., 2012), consumption of rice has continued to rise per annum. The high demand of rice leads to put higher efforts since this crop has high nutritional value, providing 20% of calories, 15% of proteins, minerals
and fibers, and a part as animal feed. To increase rice
production in Indonesia by the use of a wide range of technologies, an optimal utilize of rice germplasm collection should be addressed to support breeding program.
Rice germplasm in Indonesia including improved varieties (such as upland, lowland and swamp cultivation), hybrid, local accessions, and other breeding status is an important source of useful genes and can be used for crossing parents for desired traits (Zeng et al., 2003). The germplasm is a national asset that needs to be preserved for breeding materials. Development of rice varieties with important traits such as productivity, resistance/tolerance to abiotic and biotic stresses needs broad genetic diversity. Consequently, successful breeding program should consider genetic diversity of rice to improve variety with desired traits of economic importance. High yielding rice varieties along with other superior traits such as resistance to pest and disease, early maturity, grain quality and tolerance to drought, salinity and lodging have been infused for surviving in harsh environments in Indonesia (Silitonga, 2010). A well characterized germplasm with genetic different could be useful for their effective utilization. Genetic doi: 10.9755/ejfa.2016-03-319
http://www.ejfa.me/
R E G U L A R A R T I C L E
Morphological and molecular characterization of rice genotypes with varied genetic background is highly considerable to be carried out to their utilization and to genetic variability incorporation into rice breeding program. In this study, the diversity within 60 rice genotypes from different subspecies of indica, japonica and tropical japonica was analyzed for 19 morphological traits and 384-plex SNPs with GoldenGate assay. Principal component analysis (PCA) clustered the germplasm into three main groups (indica, indica/tropical japonica/ japonica and indica/tropical japonica). PCA axes 1 and 2 and morphological traits with eigenvalue at arbitrary above 0.2, explained 24.60% of total variation in the rice germplasm. Seven traits (leaf color, leaf sheats color, ligule color, diameter of basal internode, culm color, ligule length, and flag leaf angle) could be the potential traits as descriptors for further characterization and conservation studies in Indonesian rice germplasm. Based on total morphological traits and 384 SNPs, two major clades were generated and differentiated most genotypes into subspecies/cultivar group according to their individual genetic background. Of total 154 SNPs associated with 15 morphological traits, approximately 48 SNPs were highly significant associated with quantitative and quantitative traits. The associated SNPs which were located inside or very near to genes of interest/QTLs would be potential as genetic markers. These alleles could provide breeders to effectively identify, track and incorporate regions of chromosomes governing the desired morphological traits to improve rice varieties in Indonesia.
Keywords: Indonesian rice; Morphological trait; Principal component analysis; SNP
A B S T R A C T
*Corresponding author:
Puji Lestari, Indonesian Center for Agricultural Biotechnology and Genetic Resources Research and Development-IAARD, Jl. Tentara Pelajar, No. 3A Bogor 16111, Indonesia. E-mail: [email protected]
characterization at morphological and molecular level will enable rice breeders to exploit genotypic diversity for conservation and further crop improvement (Thomson et al., 2007; Juansa et al., 2012; Rabara et al., 2015).
Morphological variations are attributable to classify rice that contains two major subspecies, japonica and indica. The typical grains and environment between the two are distinctive. The other subspecies is broad-grained and rives under tropical conditions and possesses specific morphology, called as tropical japonica. Based on the morphology and molecular analyses, scientists also try to sort rice into different number of cultivar groups namely temperate japonica, aromatic, aus etc. (Garris et al., 2004; Glaszmann, 2004). Morphologically, rice differs in growth stages in respect to vegetative characters, leaf, culm, panicle, and seed properties which are important for guiding selection process in breeding.
In addition to phenotypic characters, molecular
characterization proves rapid scientific advances and
have introduced new techniques for the conservation and protection as well as their broad applications. Potential molecular markers as marker-assisted selection (MAS) gain prominent in rice breeding and offer new opportunities that increase the efficiency of food production (Franco and Hidalgo, 2003). Markers are also currently widely used to provide information of genetic relatedness and linkage/association with important traits and other function. Modern breeding programs will require high-throughput genotyping that can handle large numbers of samples at a low cost (Thomson, 2014).
A new generation of markers based on single nucleotide polymorphisms (SNPs) is now rapidly overtaking previous markers. SNPs are potential to greatly increase the speed and reduce the cost of molecular marker genotyping with high throughput in order to make it feasible to ‘mainstream’ MAS into conventional breeding program (Thomson et al., 2010). A number of custom SNP sets from low to high density have been developed using different platforms with automated genotyping (Thomson et al., 2010; Utami et al., 2013; Chen et al., 2011; Singh et al., 2015). These efforts will allow more efficient strategies in genotyping for use in a wide range of genetics and breeding applications. Therefore, this study was carried out to assess the morphological diversity of rice genotypes in Indonesia according to rice descriptor from Bioversity International (2007) and to
identify SNP markers significantly associated with the
morphological traits using GoldenGate 384-plex SNP genotyping assay.
MATERIALS AND METHODS
Plant materials
Sixty rice genotypes belonged to the gene bank collection of Indonesian Center for Agricultural Biotechnology and Genetic Resources Research and Development (ICABIOGRAD) under the Indonesian Agency for Agricultural Research and Development (IAARD) were selected for genotyping of custom 384 SNP chip in this study. The genotypes were chosen based on their diverse genetic background depending on subspcies. Based on the botanical features, the 60 genotypes comprised of 46 indica, 5 japonica, and 9 tropical japonica. The indica group included improved varieties, upland, lowland, hybrid, and IR group developed by International Rice Research Institute (IRRI). The list of total rice genotypes used in this study is presented in Table 1.
Morphological characterization
All genotypes were grown in green house and two individuals of each genotype were planted in pot in three replications. Rice cultivation was managed according to the standard recommendation of rice practices. Nineteen quantitative and qualitative morphological traits were observed from vegetative to generative growth stages to the descriptors for rice (Bioversity International, IRRI and Warda, 2007) and the data were recorded. The following quantitative traits were observed such as leaf length (LLNG), leaf width (LWDT), diameter of basal internode (DBITR),
panicle length (PLNG), leaf angle (LAGL), flag leaf angle
(FLAGL), secondary branching of panicle (SBP), culm angle (CAGL), and ligule length (LGLNG). While the remaining 10 qualitative traits included leaf blade pubescence (LBPBS), collar color (CCLR), auricle color (ACLR), leaf blade color (LBCLR), leaf sheath color (LSCLR), ligule shape (LSHP), ligule color (LGCLR), culm color (CUCLR), attitude of panicle branch (APB), and panicle axis (PAXS).
384-plex SNP genotyping with GoldenGate assay DNA Isolation
The healthy leaves of three week-old rice seedling germinated from a single plant of each genotype was harvested, collected and stored in -80°C until use for DNA isolation. Genomic
DNA was isolated using the Thermo Scientific King Fisher
Plant DNA kits (Qiagen, 2011). The DNA was eluted with 100 µl of TE buffer. The concentration and quality of DNA
were measured with NanoDrop1000 (Thermo Scientific Co.)
on wavelength of 260/280 and 230/280 (Sambrook and Russel, 2001). Each DNA was concentrated with Speedvac
and adjusted to final concentration of 50 ng/µl to meet the
required recommendation for GoldenGate assay using iScan array (Illumina, San Diego, CA).
GoldenGate assay for 384 SNP chip using iScan array
Emir. J. Food Agric ● Vol 28 ● Issue 9 ● 2016
was design in the previous study (Utami et al., 2013). The genotyping was conducted in accordance to the manufacture protocol for plant genome as described by Illumina’s BeadArray technology-based GoldenGate (GG) assay (Fan et al., 2003) at the facility of Indonesian Center for Agricultural Biotechnology and Genetic Resources Research and Development (ICABIOGRAD) under the IAARD. This assay was done on a high-resolution confocal scanner (iScan, Illumina) which was able to read the arrays and generated intensity data. Allele calling was performed automatically using Genome Studio v. 2011.1 (Illumina, San Diego, CA). The SNP genotyping scores (Call rates, GeneTrain and GenCall) were exported using GenomeStudio internal tool for subsequent analysis. Genotypes with a GenCall score below 0.25 were assigned as missing.
Data analysis
Numerical values for all morphological traits were subjected to analysis using XLSTAT program, particularly statistical summary and correlation matrix (Pearson estimate). Principal component analysis (PCA) was generated on ranged data with linear reduction. The PCA was used
to view the traits with significant variation in the rice
germplasm. Visualizing of PCA cluster was generated
using XLSTAT. To fit the PCA cluster visualization, rice
genotypes were named following the default instruction in the program instead of the real name of each rice variety/ accession. Consequently, both the rice varieties name and the corresponding new label depicted in the PCA cluster were described (Table 1). Flapjack also facilitated to generate a phylogenetic tree based on genotypic data of 384 SNPs and the 19 morphological traits in total genotypes (Milne et al., 2010) on the basis of similarity matrices. Flapjack program allowed to analyzing both genotypic data containing allele per marker for each genotype and phenotypic information of either numerical or categorical. Association between SNPs and morphological traits were tested with linear mixed model (SAS, 2002).
RESULTS
Morphological diversity of rice germplasm
Morphological assessment displayed by 60 rice genotypes in this study revealed variations on qualitative and quantitative characters. An example of morphological characters used
Tabel 1: List of 60 rice genotypes used in this study
Sample Accession/variety Subspecies Sample Accession/variety Subspecies
Obs 1 Silugonggo Indica Obs 31 Inpago 4 Indica
Obs 2 Dodokan Indica Obs 32 Inpago 5 Indica
Obs 3 BMIP 22 Japonica Obs 33 Inpago 8 Indica
Obs 4 IRBLSH-s Japonica Obs 34 FIR32-1-1 Indica
Obs 5 BMIP 40 Japonica Obs 35 S4616-PN-7-5 Indica
Obs 6 Bio 110 Indica Obs 36 Lestari Tropical japonica
Obs 7 IR64 Indica Obs 37 Jangkok Tropical japonica
Obs 8 IR54 Indica Obs 38 Ketan Bubarak Tropical japonica
Obs 9 IR30 Indica Obs 39 Klengkap Tropical japonica
Obs 10 IR65 Indica Obs 40 Nona Bokra Indica
Obs 11 IR42 Indica Obs 41 Madha Kedhi Indica
Obs 12 IR74 Indica Obs 42 Repong Tropical japonica
Obs 13 Inpari 1 Indica Obs 43 Bintang Tropical japonica
Obs 14 Ciherang Indica Obs 44 Beras Merah D3 Indica
Obs 15 Fatmawati Indica Obs 45 Ins14-82 Indica
Obs 16 Adan Kelabit Tropical japonica Obs 46 Ins22-124 Indica
Obs 17 Banun Tropical japonica Obs 47 Ins24-136 Indica
Obs 18 Pandan Wangi Tropical japonica Obs 48 Bio158-mamol-Dro Indica
Obs 19 Kinamaze Japonica Obs 49 Bio5-AC-Blas/BLB03=Inpari BLB Indica
Obs 20 Nipponbare Japonica Obs 50 Bio113-BC-BlasP Indica
Obs 21 Inpari 2 Indica Obs 51 Bio128-BC-WBC Indica
Obs 22 Inpari 6 Indica Obs 52 Inpari 30 Indica
Obs 23 Inpari 12 Indica Obs 53 D1 Beras Merah Indica
Obs 24 Inpari 16 Pasundan Indica Obs 54 Code Indica
Obs 25 Inpari 17 Indica Obs 55 BMIP19(IPBM-32-1-3-3) Indica
Obs 26 Inpari 18 Indica Obs 56 IR84047-24-3-3-3 Indica
Obs 27 Inpari 28 Kerinci Indica Obs 57 IR82571-581-1-2-3 Indica
Obs 28 Inpari 30 Indica Obs 58 IRBB7 Indica
Obs 29 Hipa 5 Ceva Indica Obs 59 IR82571-602-3-2-2 Indica
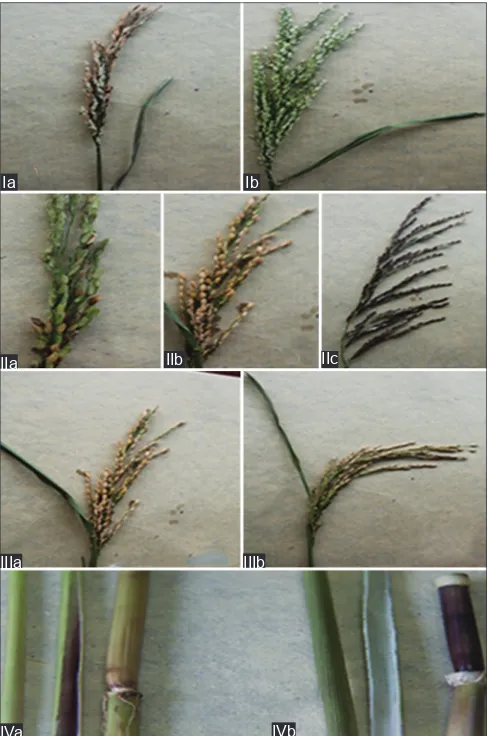
as descriptors which were observed in total rice genotypes in this study is depicted in Fig. 1. Collar color, ligule shape, and panicle angle were uniform in total genotypes, showing green, 2 cleft and >90°, respectively. More than 80% of the genotypes had intermediate of leaf blade pubescence, <45°of flag leaf angle, white of auricle, purple lines of leaf sheath color, <30° of culm angle, heavy of secondary branching of panicle, and green color of culm. However,
a greater variety of this germplasm was identified on leaf
angle, leaf blade color, ligule color, and attitude of panicle branch. The mean, maximum and minimum values of
five quantitative traits among this germplasm also varied.
The mean values of leaf length, leaf width, and panicle length were 40.15, 0.66 and 24.18 cm, respectively. These genotypes possessed wide ranges of basal internode and ligule length, from 0.50 to 0.80 cm and 1.25-2.60 cm,
respectively. The mean and range values of selected five
quantitative morphological traits are shown in Table 2.
Pair wise correlations among traits revealed that only few
morphological traits had either significant positive or
negative correlations. Based on the correlation category
from Dancey and Reidy (2004), correlation coefficient
of Pearson (Pearson’s r) explained weak to moderate (0.3<r<0.7). Culm angle with leaf blade color (r= -0.31), and leaf width with diameter of basal internode had moderate and weak negative correlations (r= -0.28), respectively. Between leaf sheath pubescence and panicle length (r= 0.38), leaf sheath color and culm color (r= 0.38),
and flag leaf angle and with leaf angle (r= 0.41) were moderate positive correlation.
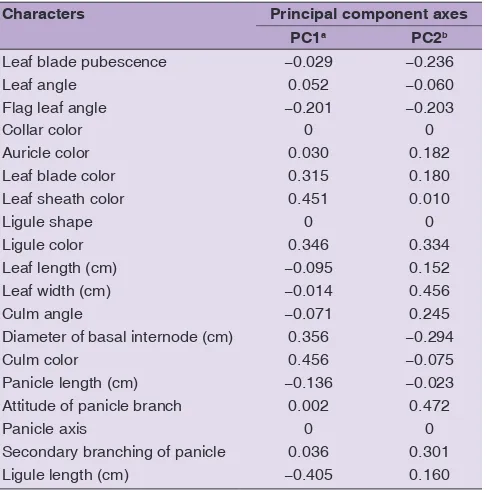
Based on the first 2 principal components (PCs) with
eigenvalues greater than 2 and 1.9, principal component analysis (PCA) for the 19 morphological traits explained 24.60% of total phenotypic variation in the collection.
The result from PCA analysis with the first two PCs
estimates for the 19 morphological traits to classify the 60 rice genotypes is presented in Table 3. Particularly, PC1 with eigenvalue greater than 2.0 contributed the most of variation on seven traits in the germplasm. The seven traits comprised four qualitative traits (leaf blade color, leaf sheath color, ligule color, and collar color) and
three quantitative traits (flag leaf angle, ligule length and
diameter of basal internode). Of these characters, negative
characters were from flag leaf angle and ligule length. There
was a contrast between the diameter of basal internode with a positive loaded value in PC1 but a negative loaded value in PC2. Thus, morphological traits related to leaf could be major descriptor contributing in differentiation of rice germplasm collection (Toshinori, 1991; Shikari et al., 2009).
Relationship between 60 accessions/varieties of rice revealed by cluster analysis is presented in Fig. 2. The
total genotypes occurred in three main clusters (G1, G2, and G3), in particular, three indica (Isn23-136, Hipa13 and Inpari12) were to be separately from other groups. While the G1 grouped varieties/accessions belonging to indica/ japonica/tropical japonica which accommodated overlap characters. The G2 seemed to be distinct group containing indica varieties/accessions (Inpari 30, BMIP19/IPBM-32-1-3-3 and IR84047-24-BMIP19/IPBM-32-1-3-3-3) and japonica reference cultivar, Nipponbare. These varieties in this group were characterized
Table 2: Mean and range values of selected five quantitative
morphological traits observed in 60 rice genotypes in this study
Traits Mean±SD (cm) Minimum (cm) Maximum (cm)
Leaf length 40.15±12.0 22.30 70.30
Leaf width 0.66±0.32 0.10 1.70
Diameter of basal internode
0.61±0.09 0.50 0.80
Panicle length 24.18±2.89 16.55 35.00
Ligule length 1.80±0.34 1.25 2.60
Fig 1.Examples of morphological characters of rice germplasm used
as descriptors in this study. I. Flag leaf angle (a. <45°, b. 45-90°); II. Attitude of panicle branch (a. Erect, b. Semi-compact, c. Spreading/
open panicle); III. Panicle axis (a. Semi upright, b. Slightly dropping);
IV. Culm color (a. Green, b. Purple).
IIc Ib
IIb
IIIb Ia
IIa
IIIa
Emir. J. Food Agric ● Vol 28 ● Issue 9 ● 2016
by intermediate of leaf blade pubescence, semi compact of panicle branch attitude, <30° of flag leaf angle and heavy of secondary of branching panicle. The G3 group was predominated by indica varieties (Bio5-AC-Blas/BLB03 = Inpari BLB, D1 red rice, and Code) that showed similar diameter of basal internode within the group.
Genetic relatedness among rice genotypes based on morphological and molecular characters
Both morphological and molecular data demonstrated the diversity of rice genotypes. Morphological similarities within this rice germplasm in our study indicated genetic relatedness generally supported by SNP variation. An example of SNP pattern surveyed in 60 rice genotypes based on 384 SNPs generated by GenomStudio is shown in Fig. 3. In this cluster pattern, an SNP locus of id6015421 in chromosome 6 with base substitution of A/G revealed homozygote of AA and BB in 43 and 15 varieties/ accessions, respectively, and AB heterozygote was in the remaining varieties observed. This demonstrated that Nipponbare as japonica cultivar reference possessed A allele and IR64 being as indica had its alternate allele in the id6015421 locus (Fig. 3).
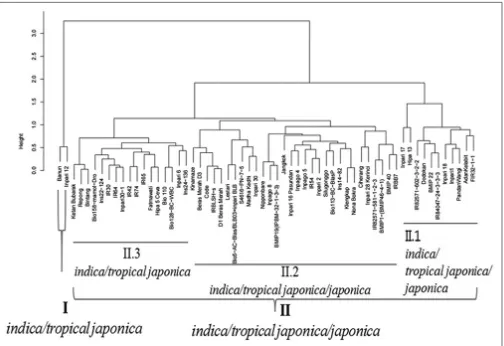
The relationships among 60 rice genotypes based on the combined 19 morphological traits and 384 SNPs can be seen in the dendrogram (Fig. 4). The analysis performed two main distinctive clades with a cut off of 2.5. Clade I only contained two varieties, one indica (Inpari 12) and one tropical japonica (Banun). Banun, a tropical japonica variety,
showed different characters on panicle, culm and leaf from indica type. For example, Banun showed greater on leaf length and width, diameter of basal internode, panicle length and ligule length than Inpari12. Qualitative traits like
attitude of panicle branch, ligule color, leaf angle and flag
leaf angle also differed between the two; however other characters were similar. Their close genetic relationship was supported by the high proportion of same alleles observed on 384 SNP bead array. The clade II grouped most genotypes (58) with different subspecies and genetic
background influenced by the pedigree. Three sub-clades
were built in the clade II and demonstrated closer relation of each variety/accessions characterized as indica, japonica and tropical japonica in the same sub-clade of II. 1 and II. 2. For example, a japonica variety, BMIP22 was closer to other indica in sub-clade II.1 than the other four japonica varieties (IRBLSH, Kanamaze, Nipponbare and BMIP40) which belonged to the sub-clade II. 2. Interestingly, the sub-clade II. 3 only grouped indica and tropical japonica varieties. Indica Table 3: Eigenvalues of the first two principal component
axes (PC) for the 19 morphological traits used to classify the rice germplasm
Characters Principal component axes PC1a PC2b
Leaf blade pubescence −0.029 −0.236
Leaf angle 0.052 −0.060
Flag leaf angle −0.201 −0.203
Collar color 0 0
Auricle color 0.030 0.182
Leaf blade color 0.315 0.180
Leaf sheath color 0.451 0.010
Ligule shape 0 0
Ligule color 0.346 0.334
Leaf length (cm) −0.095 0.152
Leaf width (cm) −0.014 0.456
Culm angle −0.071 0.245
Diameter of basal internode (cm) 0.356 −0.294
Culm color 0.456 −0.075
Panicle length (cm) −0.136 −0.023
Attitude of panicle branch 0.002 0.472
Panicle axis 0 0
Secondary branching of panicle 0.036 0.301
Ligule length (cm) −0.405 0.160
a,b: Eigenvalues of PC1 and PC2 are 2.0 and 1.9, respectively
Fig 2. Principal component analysis (PCA) clustering based on morphological similarity of 60 rice accessions.
Fig 3.Example of cluster patternof SNP (id6015421)observed in total
60 rice genotypes based on 384-plex SNP using the GenomeStudio
software. Homozygote alleles: AA in red and BB in blue color);
varieties developed by IRRI tended to be grouped in the same clade (such as IR30, 64, 42, 65 and 74), similarly to upland rice (Inpago 4, 5 and 8), and two red rice accessions (“beras merah D1” and “beras merah D3”). Tropical japonica genotypes also preferentially grouped in the same sub-clade, such as Ketan bubarak, Repong and Bintang, meanwhile Pandanwangi dan Adan Kelabit were on other sub-clade. While, Inpari varieties seemed to be grouped in different sub-clades according to its individual genetic without considering the lowland varieties type.
Association between SNP markers and morphological characters
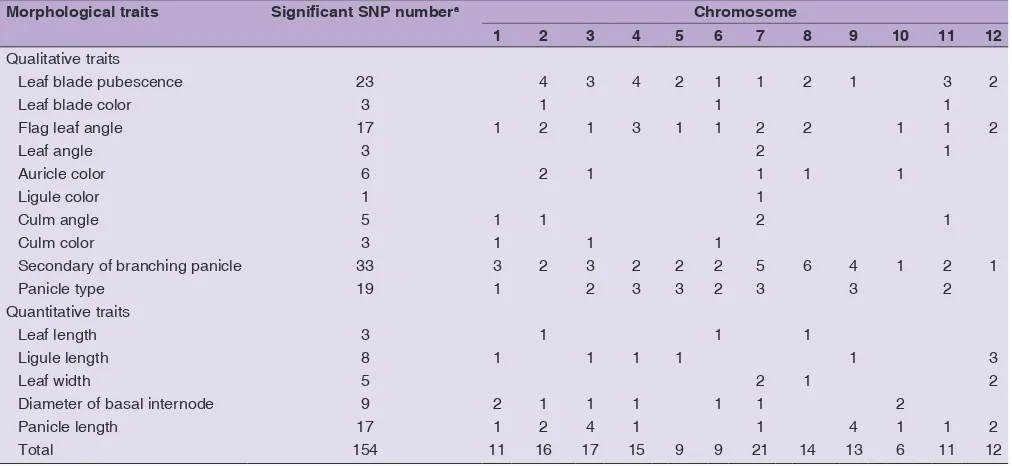
The 384 SNP panel desained across 12 chromosomes of rice (Zhao et al., 2010; Utami et al., 2013) was used for association analysis with morphological traits. Total 154
SNPs with diverse base substitutions were significantly
associated with 15 morphological traits at P-value threshold of 0.01. Chromosome 7 contributed greatly with the highest SNP number (21 SNPs) associated with morphological traits and those in chromosome 2 (16 SNPs) and 3 (17 SNPs) were comparable. 48 out of total 154 SNPs
were identified to be highly significant associated with
10 morphological traits including leaf blade pubescence,
flag leaf angle, leaf length, auricle color, culm angle,
culm color, diameter of basal internode, secondary of branching panicle, panicle length and attitude of panicle
branch. The number of SNPs significantly associated with
morphological characters of rice germplasm is presented in Table 4.
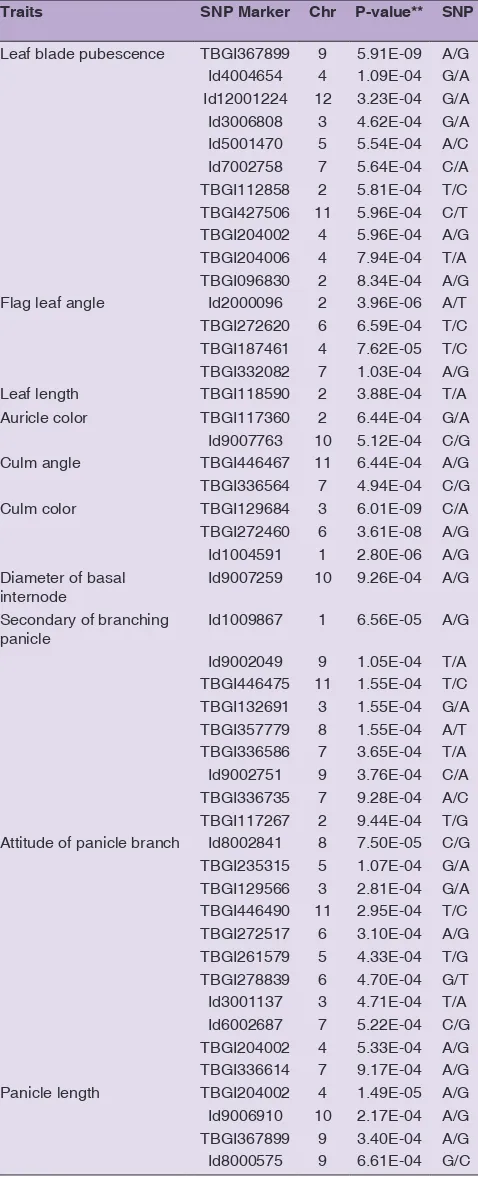
Some SNP markers were found to have common association for several traits. TBGI367899 had associations with leaf blade pubescence, leaf angle and panicle length, and TBGI112858 was highly associated with leaf blade pubescence, auricle color and panicle length. In contrast,
specific SNPs were only associated with one morphological
Emir. J. Food Agric ● Vol 28 ● Issue 9 ● 2016
and TBGI272460 were strongly associated with culm color and explained high phenotypic variation with the same r2 (0.49). Nine of total 33 significant SNP markers were strongly associated with secondary of branching panicle, and SNP id1009867 located in chromosome 1 had the strongest association (P-value=6.56E-05, r2=0.29). In addition, a number of markers associated
with morphological traits were detected to be specific
to a variety/accession in respect to leaf, culm of panicle, indicating that there are morphological characters of rice plants supported by molecular characterization that could
be used as genetic differentiator. The list of significant SNP
markers with their detailed information is shown in Table 5.
DISCUSSION
Diverse rice germplasm needs a rational use with better knowledge of its characteristic. The presented morphological characters of rice genotypes in Indonesia in our study demonstrated diversity within and among rice sub-species and their genetic relatedness. Similar certain morphology was found among genotypes in the same group such as IR-group, glutinous rice (called as “Ketan”), red rice, and improved varieties etc. Genotypes chosen from different subspecies, ecological area (lowland and upland), glutinous rice and rice were more inherently diverse than they were from a similar environment (Thomson et al., 2009). Quantitative morphological of total 60 genotypes proved their diversity even they possessed similar qualitative characters (Table 2). This rice germplasm which encompassed a wide range of genetic background and ecologically distinct regions probably contained greater
genetic diversity as a result of divergent selection pressure. The fact of some improved varieties from indica with given name such as Inpago, Inpari and IR-groups derived from selection by human via breeding or adaptability evaluation represented more genetically identical than subspecies of japonica and tropical japonica. Thus, this study demonstrated the common and specific morphological differences observed among rice collection which is in good agreement with previous study based on morphological traits of wild rice species (Suhartini, 2010), local accessions and improved varieties (Saadah et al., 2013).
Correlation matrix performed among morphological characters could easily assume the relationship between characters. In our study, the most prominent correlations
were found on flag leaf angle with leaf angle, leaf sheat
pubescence with panicle length, and leaf sheat color with culm color. Such correlation between traits allows for simultaneous selection and utilization of related traits interchangeably in rice. Morphological characterization could be highly considered in routine rice germplasm management for breeding purpose.
PCA is able to measure the importance and contribution
of each trait to total variance. In our study, the first
2 component in PCA with eigenvalues of arbitrary set above 0.2 explained the most variations including leaf characters in this rice germplasm. This morphological traits related to leaf could be major descriptor contributing in differentiation of rice germplasm collection (Toshinori, 1991; Shikari et al., 2009). In addition, the contrast between the characters with a positive loaded value in PC1 but a negative loaded value in PC2 suggest that Table 4: Number of SNP markers significantly associated with morphological traits observed in 60 Indonesian rice genotypes
Morphological traits Significant SNP numbera Chromosome
1 2 3 4 5 6 7 8 9 10 11 12
Qualitative traits
Leaf blade pubescence 23 4 3 4 2 1 1 2 1 3 2
Leaf blade color 3 1 1 1
Flag leaf angle 17 1 2 1 3 1 1 2 2 1 1 2
Leaf angle 3 2 1
Auricle color 6 2 1 1 1 1
Ligule color 1 1
Culm angle 5 1 1 2 1
Culm color 3 1 1 1
Secondary of branching panicle 33 3 2 3 2 2 2 5 6 4 1 2 1
Panicle type 19 1 2 3 3 2 3 3 2
Quantitative traits
Leaf length 3 1 1 1
Ligule length 8 1 1 1 1 1 3
Leaf width 5 2 1 2
Diameter of basal internode 9 2 1 1 1 1 1 2
Panicle length 17 1 2 4 1 1 4 1 1 2
Total 154 11 16 17 15 9 9 21 14 13 6 11 12
These predominant traits observed in our study like leaf, panicle and culm characters were also found to be important in other Asian countries (Shikari et al., 2009; Sinha and Mishra, 2013; Wijayawardhana et al., 2015).
Based on PCA clustering pattern, the diverse indica varieties revealed distribution of them across clusters and grouped preferentially according to its genetic (Fig. 2). Moreover, group or sub-gene pool within indica rice in tropical and temperate regions were still overlap, indicating seed exchange has been existed for many varieties/
accessions, in which diversified rice types were used for
various agronomic and cultural practices. Importantly, the morphological changes probably were achieved by the successive rice improvement program (Wijayawardhana et al., 2015). Similar morphological characteristics that are expressed phenotypically could show dissimilarity among accessions in their genomes (Cole-Rodgers et al., 1997). Consequently, genotypes with genetic nearness may be different in the phenotypic characters; therefore genome-wide genotyping with custom SNPs was applied to support morphological characterization in our study.
Assorted rice performance in Indonesia has been progressively studied based on phenotypic and molecular characterization, but limited for the use of advantage of SNP markers. Our results were complementary previous reports on desired morpho-agronomical traits in Indonesian rice breeding (Setyawati, 2003; Suhartini, 2010; Rohaeni and Hastini, 2015) that was supported with molecular markers approaches (Thomson et al., 2007; 2009; Utami et al., 2011). 384-plex SNP used in our study has been designed based on previous version of 1536 SNP chip which enabled to identify genetic relationship of 284 accessions into japonica/ tropical japonica and dominated indica group (Utami et al., 2013). The 384 SNPs variation along with morphological
data confirmed a clear separation of rice collection into
two main groups (Fig. 4), indica/tropical japonica (clade I) and indica/japonica/tropical japonica (clade II). Genome-wide diversity, decay of linkage disequilibrium and traits of interest possibly affect the genetic relatedness among varieties within and between subspecies (Thomson et al., 2009). Most of indica varieties were distributed into all
major clades and sub-clade, reflecting their similar genetic
tendency. These morphological and molecular characters observed in these 60 Indonesian rice genotypes could be relevant to previous reports (Rakshit et al., 2007; McNally et al., 2009; Gustavo and Martinez, 2014).
The presence of tropical japonica accessions closer to indica or japonica groups, suggesting their behavior at molecular
level which could be explained by genetic flow in a
zone transition between japonica and indica. These rice subspecies seemed to share alleles on the domestication Table 5: List of selected 48 SNPs highly significant
associated with morphological traits observed in rice germplasm in this study
Traits SNP Marker Chr P‑value** SNP
Leaf blade pubescence TBGI367899 9 5.91E-09 A/G
Id4004654 4 1.09E-04 G/A
Flag leaf angle Id2000096 2 3.96E-06 A/T
TBGI272620 6 6.59E-04 T/C
TBGI187461 4 7.62E-05 T/C
TBGI332082 7 1.03E-04 A/G
Leaf length TBGI118590 2 3.88E-04 T/A
Auricle color TBGI117360 2 6.44E-04 G/A
Id9007763 10 5.12E-04 C/G
Culm angle TBGI446467 11 6.44E-04 A/G
TBGI336564 7 4.94E-04 C/G
Culm color TBGI129684 3 6.01E-09 C/A
TBGI272460 6 3.61E-08 A/G
Attitude of panicle branch Id8002841 8 7.50E-05 C/G
TBGI235315 5 1.07E-04 G/A
Panicle length TBGI204002 4 1.49E-05 A/G
Id9006910 10 2.17E-04 A/G
TBGI367899 9 3.40E-04 A/G
Id8000575 9 6.61E-04 G/C
**Significant level at P<0.01, Chr: Chromosome, SNP: Single nucleotide polymorphism
Emir. J. Food Agric ● Vol 28 ● Issue 9 ● 2016
process. Japonica and tropical japonica are considered as outcomes of selection for adaptation to different ecology and climate (Garris et al., 2004). Furthermore, genetic make-up and environment could affect the morphology of rice plant (McCouch et al., 1998; Rajapakse et al., 2000). This clustering based on combined morphology and 384 SNPs is relatively comparable with previous studies using 1536 SNPs (Zhao et al., 2010; Utami et al., 2013) and the other 384 SNPs designed somewhere else observed in rice (Tung et al., 2010; Chen et al., 2011; Parida et al., 2012). Overall, the diversity of total rice genotypes used was adequate to provide a valuable resource for association analysis.
The high degree of association between the 154 SNPs with 15 morphological traits demonstrated a high power of these SNPs (Table 5). Particularly, this study highly focused on the vegetative characters of the rice plant, can be used effectively in order to capture a considerable morphological variability associated with Indonesian rice germplasm. The typical morphological characters on leaf, stem and panicle appeared in a certain accessions/varieties,
reflecting the existence of its genetic control. This typical
morphology along with molecular character could serve as differentiator of rice variety, leading to guide rice breeders that can effectively select morphologically more distinct individuals.
The high significant SNP markers were detected, such
as TBGI367899 locus in chromosome 9 associated with
leaf blade pubescence, id2000096 with flag leaf angle,
TBGI118590 with leaf length, and both TBGI272460 and id1004591 with auricle color etc. Importantly, TBGI204002 (chromosome 4) highly associated with panicle length was located in the region of QTL for panicle length (qPL4), similarly to id1009867 that was in the regions of QTL for culm thickness (AQAW036). Moreover, id1004591 was identified to be near with POLD3-putative DNA polymerase delta complex and a QTL was related to culm thickness (AQDZ006) (Ratho et al., 1991; gramene.org). The SNPs located near or within genes/QTLs of interest need further validation for their useful application. Notably, this high throughput genotyping using 384 SNPs in our study proved their powerful and robustness to scan the genome
of Indonesian rice germplasm and finally we were able to
obtain potential SNP markers for desired traits. Therefore,
the identification of morphological characters which are
important to change the rice crop architecture has a greater implication. Since the power association analysis is dependent on both the density of SNPs and the quality of phenotypic data available for analysis (Tung et al., 2010), this result would give a clue of our germplasm panel for genome-wide studies to explore the molecular level of diverse morphological traits in rice (Yang et al., 2015) in Indonesia.
CONCLUSIONS
Morphological accompanied with high throughput SNP genotyping is more reliable in the evaluation of rice germplasm. The morphology of these rice germplasm could be a performance basis for selection of potential genotypes for further use in rice breeding in Indonesia. 48
SNPs highly significant associated with selected quantitative
and qualitative morphological characters are valuable and need a validation. Potential SNP markers in the regions of genes/QTLs of interest namely id1004591, id1009867, TBGI204002 were able to be detected. The implications of these results in our study for rice improvement are based on taking advantage of the genetic variability that exists in the Indonesian rice germplasms.
ACKNOWLEDGEMENTS
The authors are grateful to the rice genome research team at Indonesian Center for Agricultural Biotechnology and Genetic Resources Research and Development under the Indonesian Agency for Agricultural Research and Development, Indonesia (ICABIOGRAD-IAARD). The authors also give thanks to Nurul Hidayatun for the photo courtesy of rice morphological characters. This research work was supported by the National Indonesian Budget
on fiscal year 2014, ICABIOGRAD-IAARD.
Author’s contributions
Lestari P. and Utami D.N. contributed equally to design and conduct the experiment, and analyzed the results. Rosdianti I. was involved to prepare materials, conduct experiment and collect data. Sabran M. assisted in data analysis and edited the manuscript. Lestari P. wrote the manuscript and commented by all authors.
REFERENCES
Bioversity International, IRRI, WARDA. 2007. Descriptor for Wild and Cultivated Rice, (Oryza spp.), Bioversity International,
International Rice Research Institute, WARDA, Africa Rice Center, Rome, Italy, Los Banos, Philippines, , Cotonou, Benin. Chen, H., H. He, Y. Zou, W. Chen, R. Yu, X. Liu, Y. Yang, Y. M. Gao,
J. L. Xu, L. M. Fan, Y. Li, Z. K. Li and X. W. Deng. 2011. Development and application of a set of breeder-friendly SNP markers for genetic analyses and molecular breeding of rice (Oryza sativa L.). Theor. Appl. Genet. 123: 869-879.
Cole-Rodgers, P., D. W. Smith and P. W. Bosland. 1997. A novel statistical approach to analyze genetic resource evaluations using Capsicum as an example. Crop Sci. 37: 1000-1002.
Dancey, C. and J. Reidy. 2004. Statistics Without Maths for Psychology: Using SPSS for Windows. Prentice Hall, London. Fan, J. B., A. Oliphant, R. Shen, B. G. Kermani, F. Garcia,
D. Campbell, B. Zhang, S. Kruglyak, D. Bentley, J. Haas, P. Rigault, L. Zhou, J. Stuelpnagel and M. S. Chee. 2003. Highly parallel SNP genotyping.Cold spring harb. Symp. Quant. Biol. 68: 69-78.
Franco, T. L. and R. Hidalgo. 2003. Analisis estadistico de datos de caracterizacion morfologica de recursos fitogeneticos. Technical Bulletin No. 8. Instituto Internacional de Recursos Fitogeneticos (IPGRI), Cali, Colombia.
Garris, T., T. H. Coburn, J. Kresovichn and S. McCouch. 2004. Genetic structure and diversity in Oryza sativa L. Genetics.
169: 1631-1638.
Glaszmann, J. C. 2004. Isozymes and classification of Asian rice varieties. Theor. Appl. Genet. 74: 21-30.
Gustavo, A. L. M. and W. O. Martinez. 2014. Identification of the variatbility of a common bean collection through morphological, physiological, biochemical, and molecular relationships. Agronom. Colombiana. 32: 159-169.
Juansa, A., A. Purwantoro and P. Basunana. 2012. Diversity of rice based on botany-morphology characters and RAPD markers. Vegetalika. 1: 1-11. Padhukasahasram, C. D. Bustamante, D. Weigel, D. J. Mackill, R. M. Bruskiewich, G. Rätsch, C. R. Buell, H. Leung and J. E. Leach. 2009. Genome-wide SNP variation reveals relationship among landraces and modern varieties of rice. Proc. Natl. Acad. Sci. USA. 106: 12273-12278.
Milne, I., P. Shaw, G. Stephen, M. Bayer, L. Cardle, W. T. B. Thomas, A. J. Flavel and D. Marshall. 2010. Flapjack-graphical genotype visualization. Bioinformatics. 26(24): 3133-3134.
Parida, S. K., M. Mukerji, A. K. Singh, N. K. Singh and P. Mohapatra. 2012. SNPs in stress-responsive rice genes: validation, genotyping, functional relevance and population structure. BMC Genomics. 13: 426.
Qiagen. 2011. Tissue Lyser Handbook for High-Throughput Disruption of Biological Samples: Purification of DNA From Plant Tissues (Mini Protocols), 2nd ed. 15. Qiagen, Germany, p. 3.
Rabara, R. C., M. C. Ferrer, M. I. C. Calayugan, M. D. Duldulao and J. Jara-Rabara. 2015. Conservation of rice genetic resources for food security. Adv. Food Technol. Nutr. Sci. Open J. SE(1): S51-S56.
Rajapakse, R. M. T., C. A. Sandanayake and B. D. Pathinayake. 2000. Foot prints in rice variety improvement and its impact on rice production in Sri Lanka. Vol. 2. Annual Symposium of the Department of Agriculture, Sri Lanka. Pp. 423-433.
Rakshit, S., A. Rakshit, H. Matsumura, Y. Takahashi, Y. Hasegawa, A. Ito, T. Ishii, N. T. Miyashita and R. Terauchi. 2007. Large scale DNA polymorphism study of Oryza sativa and O. rufipogon
reveals the origin and divergence of Asian rice. Theor. Appl. Genet. 114: 731-743.
Ratho, S. N. and S. B. Pradhan. 1991. Cytoplasmically controlled cold tolerance in a cytoplasmic - genetic male sterile line of rice. Euphytica. 58: 241-244.
Rohaeni, W. R. and T. Hastini. 2015. Inventory of local varieties of rice in Ciater, Subang district, West Java. Pros. Sem. Nas. Masy. Biodiv. Indon. 1: 189-193.
Saadah, I. R. and S. Subejo. 2013. Diversity of grain color and rice color of local variety of black rice (Oryza sativa L.) that
cultivated by farmer in Sleman, Bantul and Magelang regencies. Vegetalika. 2: 13-20.
Sambrook, J. and D. W. Russel. 2001. Molecular Cloning: A Laboartory Manual, 3rd ed. Cold Spring Harbor Laboratory
Press, Cold Spring Harbor, NY.
Sasaki, T. 2002. Rice genomics to understand rice plant as an assembly of genetic codes. Curr. Sci. 83: 834-839.
Setyawati, I. 2003. Biodiversity and traditional knowledge: Rice varieties among the Leppo Ké of Apau Ping. In: Eghenter, C., B. Sellato and G. S. Devung, editors. Social Science Research and Conservation Management in the Interior of Borneo. CIFOR Center for International Forestry Research, Bogor, Indonesia, Pp. 35-48. Shikari, A. B., G. A. Parray, A. G. Rather and F. A. Sheikh. 2009.
Principal component analysis for evaluation of rice (Oryza sativa L.) germplasm. J. Rice Res. 2(1): 16-22.
Singh, N., P. L. Jayaswal, K. Panda, P. Mandal, V. Kumar, B. Singh, S. Mishra, Y. Singh, R. Singh, V. Rai, A. Gupta, T. R. Sharma and N. K. Singh. 2015. Single-copy gene based 50K SNP chip for genetic studies and molecular breeding in rice. Scientific Reports. No. 11600.
Sinha, A. K. and P. K. Mishra. 2013. Morphology based multivariate analysis of phenotypic diversity of landraces of rice (Oryza sativa
L.) of Bankura district of West Bengal. J. Crop Weed. 9: 115-121. Silitonga, T.S. 2010. The use of biotechnology in the characterization,
evaluation and utilization in Indonesian rice germplasm. J. Agrobiogen. 6(1): 49-56.
Statistical Analysis System. 2002. SAS. User’s Guide. SAS Institute, Cary, p. 525.
Suhartini, T. 2010. Karagaman karakter morfologi plasma nutfah spesies padi liar (Oryza spp.). Bull. Plasma Nutfah. 16: 17-28.
(in Indonesian language).
Thomson, M. J., E. Septiningsih, F. Suwardjo, T. Santoso, T. Silitonga and S. McCouch. 2007. Genetic diversity analysis of traditional and improved Indonesian rice (Oryza sativa L.) germplasm
using microsatellite markers. Theor. Appl. Genet. 114: 559-568. Thomson, M. J., N. R. Polato, J. Prasetiyono, K. R. Trijatmiko,
T. S. Silitonga and S. R. McCouch. 2009. Genetic diversity of isolated population of Indonesian landraces of rice (Oryza sativa
L.) collected in East Kalimantan on the island of Borneo. Rice. 2: 80-92.
Thomson, M. J., K. Zhao, M. Wright, K. L. McNally, H. Leung and S. McCouch. 2010. Development and application of 96-and 384-plex single nucleotide polymorphism (SNP) marker sets for diversity analysis, mapping and marker-assisted selection in rice. In: Innovation and Partnership to Realize Africa’s Rice Potential. Second Africa Rice Congress, Barnako, Mali. Thomson, M. J. 2014. High-throughput SNP genotyping to accelerate
crop improvement. Plant Breed. Biotechnol. 2: 195-212. Tobias, A., I. Molina, H. G. Valera, K. A. Mottaleb and S. Mohanty.
2012. Handbook on Rice Policy in Asia, International Rice Development of a research platform for dissecting phenotype-genotype association in rice (Oryza spp.) Rice. 3: 205-217.
Emir. J. Food Agric ● Vol 28 ● Issue 9 ● 2016 30 marka SSR terpaut gen pengatur waktu pembungaan (HD
genes). J. Agro Biogen. 7: 76-84.
Utami, D. W., I. Rosdianti, P. Lestari, D. Satraywan, H. Rijzaani and I. M. Tasma. 2013. Development and application of 1536-plex single nucleotide polymorphism marker chip for genome wide scanning of Indoensian rice germplasm. Indones. J. Agric. Sci. 14(2): 71-78. Wijayawardhana, H. C. D., H. M. V. Herath, P. A. Weerasinghe and
H. M. D. Herath. 2015. Morphological variation in selected Sri Lankan rice (Oryza sativa L.) accessions in relation to the
vegetative parameters. Trop. Agric. Res. 26: 380-389.
Yang, W., Z. Guo, C. Huang, K. Wang, N. Jiang, H. Feng, G. Chen, Q. Liu and L. Xiong. 2015. Genome-wide association study of rice
(Oryza sativa L.) leaf traits with a high-throughput leaf scorer. J.
Exp. Bot. DOI: 10.1093/jxb/erv100.
Zeng, Y. W., S. Q. Shen, Z. C. Li, Z. Y. Yang, X. K. Wang, H. L. Zhang and G. S. Wen. 2003. Ecogeographic and Genetic diversity based on morphological character of indigenous rice (O. sativa
L.) in Yunnan, China. Resour. Crop Evol. 50: 566-577.
Zhao, K., M. Wright, J. Kimball, G. Eizenga, A. McClung, M. Kovach, W. Tyagi, M. L. Ali, C. W. Tung, A. Reynolds, C. D. Bustamante and S. R. McCouch. 2010. Genomic diversity and introgression in O. sativa reveal the impact of domestication and breeding