M ALAYSI AN STATI STI CS
ON M ED I C I NES
2 0 0 7
Edited by:
Faridah AMY, Sivasampu S, Lian LM, Hazimah H, Kok LC, Chinniah RJ
With contributions from
Lian LM, Tang RY, Hafizh AA, Hazimah H, Gan HH, Kok LC, Leow AY, Lim JY, Thoo S, Hoo LP, Faridah AMY, Lim TO, Sivasampu S, Nour Hanah O, Fatimah AR, Nadia Fareeda MG, Goh A, Rosaida MS, Menon J,Radzi H, Yung CL, Michelle Tan HP, Yip KF, Chinniah RJ, Khutrun Nada Z, Masni M, Sri Wahyu T,Jalaludin MY, Leow NCW, Norafidah I, G R Letchuman R, Fuziah MZ, Mastura I, Sukumar R, Yong SL, Lim YX, Yap PK, Lim YS, Sujatha S, Goh AS, Chang KM, Wong SP, Omar I, Alan Fong YY, David Quek KL, Feisul IM, Long MS, Christopher Ong WM, Ghazali Ahmad, Abdul Rashid Abdul Rahman, Hooi LS, Khoo EM, Sunita Bavanandan, Nur Salima Shamsudin, Puteri Juanita Zamri, Sim KH, Wan Azman WA, Abdul Kahar AG, Faridah Y, Sahimi M, Haarathi C, Nirmala J, Azura MA, Asmah J, Rohna R, Choon SE, Roshidah B, Hasnah Z, Wong CW, Noorsidah MY, Sim HY, J Ravindran, Nik Nasri, Ghazali I, Wan Abu Bakar, Tham SW, J Ravichandran, Zaridah S, W Zahanim WY, Intan SS, Tan AL, Malek R, Sothilingam S, Syarihan S, Foo LK, Low KS, Janet YH Hong, Tan ATB, Lim PC, Loh YF, Nor Azizah,Sim BLH, Mohd Daud CY, Sameerah SAR, Muhd Nazri, Cheng JT, Lai J, Rahela AK, Lim GCC, Azura D, Rosminah MD, Kamarun MK, Nor Saleha IT, Tajunisah ME, Wong HS, Rosnawati Yahya, Manjulaa DS, Norrehan Abdullah, H Hussein, H Hussain, Salbiah MS, Muhaini O, Low YL, Beh PK, Cardosa MS, Choy YC, Lim RBL, Lee AW, Choo YM, Sapiah S, Fatimah SA, Norsima NS, Jenny TCN, Hanip R, Siti Nor Aizah A, Azizul A, Mazni MJ, Umi Adzlin S, Vincent WCW, Noor Ratna N, Shamini R, Asriyati M, Razak AM, Pang YK, How SH, Roslina AM, Nurul AO, Sabrina MS, Jaya R, Thean CH, Aziah AM, Liam CK, Valuyeetham KA, Saraiza AB, Noraini S, Tengku Malini TMN, Lui WQ, Primuharsa Putra SHA, Tara G, Goh PP, Radzlian O, Shamala R, Choong CL, Tang SY, Saraswati KM
MALAYSIAN STATISTICS ON MEDICINES 2007
October 2010
© Ministry of Health Malaysia
Published jointly by:
THE NATIONAL MEDICINES USE SURVEY
Clinical Research Centre,
Ministry of Health Malaysia
3rd Floor, MMA House
124, Jalan Pahang
50286 Kuala Lumpur
Malaysia
Tel. : (603) 4043 9300
Fax : (603) 4043 9400
e-mail : [email protected]
Website : http://www.crc.gov.my
AND
THE NATIONAL MEDICINES USE SURVEY
Pharmaceutical Services Division,
Ministry of Health Malaysia
Lot 36, Jalan Universiti
46350 Petaling Jaya
Malaysia
Tel. : (603) 7841 3200
Fax : (603) 7968 2222
Website : http://www.pharmacy.gov.my
This report is copyrighted. Reproduction and dissemination of this report in part or in whole for research, educational or other non-commercial purposes are authorised without any prior written permission from the copyright holders provided the source is fully acknowledged. Suggested citation is: Pharmaceutical Services Division and Clinical Research Centre, Ministry of Health Malaysia. Malaysian Statistics on Medicine 2007. Kuala Lumpur 2010
This report is also published electronically on the website of the Clinical Research Centre at:http://www.crc.gov.my and the website of the Pharmaceutical Services Division at: http://www.pharmacy.gov.my
Funding:
The National Medicines Use Survey is funded by a grant from the Ministry of Health Malaysia (MRG Grant Number 00126) and Operational Budget from Pharmaceutical Services Division, Ministry of Health.
ISSN 1823-8300
Please note that there is potential for revision of the data in this report.
Please check the latest edition of Malaysian Statistics on Medicines report for any amendments at
MALAYSIAN STATISTICS ON MEDICINES 2007
PREFACE
Ensuring access to quality and affordable medicines is an important objective of Malaysia’s National Medicines Policy. The National Medicines Use
Survey (NMUS) was conducted with the intent to continuously and systematically collect data on medicines in the hope to further improve their use
as well as to provide a tool for better decision making in the allocation of healthcare resources for the Malaysian population.
The NMUS is into its fifth year and we are glad to announce the successful publication of its fourth report, the Malaysian Statistics on Medicines
(MSOM) 2007. The first MSOM 2004 report presented results largely from pilot surveys. In 2005, we scaled up the survey with larger sample
size and wider distribution and also refined data processing and statistical methods. For MSOM 2006, the data processing was further enhanced
to improve quality and the statistical methods reviewed to take into consideration, stratification of hospitals which gives more accurate estimates
as hospitals of different sizes may have different drug use profiles. We move a step forward for MSOM 2007, where the drug utilisation data is
tabulated in such a way as to allow comparison of utilisation between 2006 and 2007 as the data for both years were analysed using the same
statistical methods.
The comparison of two years data also allowed better detection of discrepancies in the data. As a result, some corrections have been made to the
2006 statistics. We are optimistic that as NMUS matures and the data processing methodology fine-tuned, future MSOM reports will continue to
produce accurate and reliable statistics on Malaysian medicines consumption at all times.
We hope that this MSOM 2007 report will be useful to relevant healthcare professionals, serving as a source of reference and baseline for
embarking in future research or clinical audits towards promoting rational prescribing and effective medicines use.
We would like to thank all staff who had worked very hard in ensuring the success of the NMUS, all agencies and institutions that had helped in
providing data, all expert panel members for their enthusiasm and contributions in completing the chapter reports and each and everyone who has
in one way or another contributed to the success of the NMUS and the publication of this report.
Pharmaceutical Services Division Clinical Research Centre
MALAYSIAN STATISTICS ON MEDICINES 2007
ACKNOWLEDGEMENTS
The National Medicines Use Survey would like to thank the following for their participation, assistance, support or contributions:
• Director General of Health, Malaysia
• Deputy Director General of Health (Research and Technical Support), Ministry of Health (MOH)
• Deputy Director General of Health (Medical Services), MOH
• Deputy Director General of Health (Public Health), MOH
• Senior Director of Pharmaceutical Services Division, MOH
• Senior Director of Oral Health Division, MOH
• Director, National Pharmaceutical Control Bureau, MOH
• Director, Clinical Research Centre, MOH
• Heads of Clinical Services, MOH
• Procurement and Privatisation Division, MOH
• All medical doctors, pharmacists and support personnel who participated in the NMUS surveys
• All participating public and private hospitals, clinics and other institutions which provided or allowed access to their medicines procurement data
• University Malaya Medical Centre, Hospital Universiti Kebangsaan Malaysia, Hospital Universiti Sains Malaysia, Lumut Armed Forces Hospital, Terendak Armed Forces Hospital
• Members of the NMUS Expert Panels who contributed to writing this report
• Association of Private Hospitals Malaysia, Malaysian Organisation of Pharmaceutical Industries (MOPI) and Pharmaceutical Association of Malaysia (PhAMA)
• Malaysian Medical Council, Malaysian Medical Association, Malaysian Pharmaceutical Society, The Academy of Family Physicians, Primary Care Doctors Association Malaysia, Malaysian Dental Association, Malaysian Private Dental Practitioners Association
• Pharmaniaga Logistics Sdn Bhd. and Forte Tech Solutions Sdn. Bhd.
• All who have in one way or another supported and/or contributed to the success of the NMUS and this report
Mdm. Hasnah binti Ismail Chairman
Dr. Lim Teck Onn Co-Chairman
MALAYSIAN STATISTICS ON MEDICINES 2007
ABOUT THE NATIONAL MEDICINES USE SURVEY
The National Medicines Use Survey (NMUS) is a project initiated and supported by the MOH to collect information on the supply, procurement,
prescription, dispensing and use of drugs in Malaysia. The NMUS is designed to support the implementation of our National Medicines Policy
(NMP). The objectives of NMP are to ensure only safe, efficacious and good quality medicines are available for use in Malaysia, as well as to
promote equitable access to, and rational and cost-effective use of these medicines, ultimately leading to improved health for all Malaysians. In
supporting this, the NMUS provides the functional capacity for the collection, analysis, reporting and dissemination of data on drug utilisation in
Malaysia.
The NMUS is jointly sponsored by:
• Pharmaceutical Services Division, Ministry of Health
• Clinical Research Centre, National Institutes of Health, Ministry of Health
Purpose of the NMUS
The availability of high quality, reliable and timely information on medicines use is crucial for any discussion on improving the use of medicines in Malaysia.
The objective of the NMUS is therefore to quantify the present state and time trends of medicines utilisation at various levels of our health care system, whether national, regional, local or institutional.
Routinely compiled statistics on medicines utilisation have many uses, such as:
1. Estimate the consumption of medicines and describe pattern of medicines use through assessing which alternative drugs are being used for
particular conditions and to what extent.
2. Estimate the number of medicine users overall, by age, sex and geography and over time.
3. Estimate on the basis of known disease epidemiology, to what extent medicines are under or over-used.
4. Relate the number of adverse drug reactions reported to our pharmacovigilance system to the number of people exposed to the drug in order
to assess the magnitude of the problem, or to estimate the degree of under-reporting of adverse events.
5. Provide a crude estimate of disease prevalence based on the medicines utilisation rate.
6. Estimate expenditure on pharmaceuticals, which constitutes a significant proportion of our healthcare expenditure.
7. Monitor and evaluate the effects of interventions to improve the use of medicines. These interventions may be educational effort, promotional
MALAYSIAN STATISTICS ON MEDICINES 2007
NMUS STEERING COMMITTEE
Chairman Mdm. Hasnah binti Ismail,
Director of Pharmacy Practice and Development Pharmaceutical Services Division,
Ministry of Health, Malaysia
Co- Chairman Dr. Lim Teck Onn Director
Clinical Research Centre, National Institutes of Health, Ministry of Health, Malaysia
Members Dr. Faridah Aryani binti Md. Yusof
Senior Principal Assistant Director Pharmaceutical Services Division, Ministry of Health, Malaysia
Dr. Sheamini Sivasampu Head
Healthcare Statistics Unit Clinical Research Centre, National Institutes of Health, Ministry of Health, Malaysia
Dr. Lian Lu Ming Pharmacist Grade U54 Clinical Research Centre, National Institutes of Health, Ministry of Health, Malaysia
Ms. Hazimah binti Hashim Senior Assistant Director
Pharmaceutical Services Division, Ministry of Health, Malaysia
Ms. Sarah a/p Nagalingam Senior Assistant Director
MALAYSIAN STATISTICS ON MEDICINES 2007
NMUS PROJECT TEAM
Chairman Mdm. Hasnah binti Ismail
Co-Chairman Dr. Lim Teck Onn
NMUS PROJECT STAFF
NMUS Project Coordinator Dr. Faridah Aryani binti Md. Yusof Ms. Sameerah binti Shaikh Abdul Rahman Dr. Sheamini Sivasampu
NMUS Project Manager Dr. Lian Lu Ming
Pharmacist Liaison Officer Ms. Hazimah binti Hashim
NMUS Pharmacist Ms. Gan Huey Hsin
Ms. Kok Li Ching
Mdm. Leow Ai-Yuin
TECHNICAL SUPPORT STAFF
Pharmaco-Epidemiologist Dr. Faridah Aryani binti Md. Yusof Dr. Nour Hanah binti Othman
NMUS Survey Coordinator Ms. Lee Kim Tin
Ms. Siti Mazmi Niza binti Ahmad Zawawi
Data Entry Personnel Ms. Robi binti Mohd. Radzi Ms. Nuraznida binti Aziz Ms. Fairuz Fadzilah binti Rahim
Statistician Dr. Hoo Ling Ping
Ms. Lena Yeap Lay Ling
IT Manager Ms. Celine Tsai Pao Chien
Database Developer/Administrator Ms. Tang Roh Yu
Mr. Ahmad Hafizh bin Ayob
Network Administrator Mr. Scott Huang Li Surin
MALAYSIAN STATISTICS ON MEDICINES 2007
MEMBERS OF NMUS EXPERT PANELS
1. Antihypertensives and Renal Therapeutics
MEMBERS INSTITUTION
Datuk Dr. Ghazali Ahmad Kutty (Chairperson) Kuala Lumpur Hospital
Prof. Dr. Abdul Rashid bin Abdul Rahman Cyberjaya University College of Medical Sciences
Dr. Hooi Lai Seong Sultanah Aminah Hospital, Johor Bahru
Prof. Dr. Khoo Ee Ming University of Malaya
Dr. Sunita a/p Bavanandan Kuala Lumpur Hospital
Ms. Nur Salima binti Shamsudin Selayang Hospital
Ms. Puteri Juanita binti Zamri Selayang Hospital
2. Steroids and Immunosuppressives
MEMBERS INSTITUTION
Dr. Wong Hin Seng (Chairperson) Selayang Hospital
Dr. Lim Teck Onn Clinical Research Centre, National Institutes of Health
Dr. Rosnawati binti Yahya Kuala Lumpur Hospital
Mdm. Norrehan binti Abdullah Klang District Health Office
Ms. Manjulaa Devi a/p Subramaniam Kuala Lumpur Hospital
3. Antidiabetics
MEMBERS INSTITUTION
Dr. G.R. Letchuman a/l Ramanathan (Chairperson) Taiping Hospital
Dr. Fuziah binti Md. Zain Putrajaya Hospital
Dr. Mastura binti Ismail Seremban 2 Health Clinic
Dr. Sukumar a/l Rajaretnam Tanglin Health Clinic, Kuala Lumpur
Dr. Yong Sy Liang Tengku Ampuan Rahimah Hospital, Klang
Dr. Piang Kian Yap Sime Darby Medical Centre
Ms. Kok Li Ching Clinical Research Centre, National Institutes of Health
Ms. Lim Yii Xian Kuala Langat District Health Office
4. Endocrine and Metabolic Therapeutics
MEMBERS INSTITUTION
Dr. Nor Azizah binti Aziz (Chairperson) Pulau Pinang Hospital
Dr. Janet Hong Yeow Hua Putrajaya Hospital
Dr. Alexander Tan Tong Boon University Malaya Medical Centre
Ms. Lim Phei Ching Pulau Pinang Hospital
Ms. Sharon Loh Yin Fei Pulau Pinang Hospital
5. Antiobesity
MEMBERS INSTITUTION
Dr. Masni binti Mohamad (Chairperson) Putrajaya Hospital
Dr. Muhammad Yazid bin Jalaludin University Malaya Medical Centre
Dr. Sri Wahyu binti Taher Bandar Sg. Petani Health Clinic
Mr. Nicholas Leow Chun Wei Sibu Hospital
Ms. Norafidah binti Idris Serdang Hospital
6. Antilipidaemia
MEMBERS INSTITUTION
Prof. Dr. Sim Kui Hian (Chairperson) Sarawak General Hospital
Prof. Dr. Wan Azman bin Wan Ahmad University Malaya Medical Centre
Dr. Abd. Kahar Ghapar Serdang Hospital
Mdm. Faridah binti Yusof Hospital Universiti Kebangsaan Malaysia
Mdm. Sahimi binti Mohamed Tengku Ampuan Afzan Hospital, Kuantan
Mdm. Haarathi Chandriah Medical Development Division, Ministry of Health
MALAYSIAN STATISTICS ON MEDICINES 2007
7. Cardiovascular Therapeutics
MEMBERS INSTITUTION
Dr. Alan Fong Yean Yip (Chairperson) Sarawak General Hospital
Dato’ Dr. Omar bin Ismail Pulau Pinang Hospital
Dr. David Quek Kwang Leng Dr. Quek Specialist Heart Clinic, Kuala Lumpur
Dr. Feisul Idzwan Mustapha Disease Control Division, Ministry of Health
Ms. Long Mei Sim Selayang Hospital
Mr. Christopher Ong Whai Mun Serdang Hospital
8. Antineoplastics, Oncology
MEMBERS INSTITUTION
Dr. Gerard Lim Chin Chye (Chairperson) Kuala Lumpur Hospital
Dr. Azura binti Deniel Kuala Lumpur Hospital
Dr. Nor Saleha binti Ibrahim Tamin Disease Control Division, Ministry of Health
Mdm. Lim Yeok Siew Ampang Hospital
Mdm. Rosminah binti Mohd. Din Kuala Lumpur Hospital
Ms. Kamarun Neasa Begam binti Mohd. Kassim Kuala Lumpur Hospital
Ms. Tajunisah binti Mohamed Eusoff Pulau Pinang Hospital
9. Haematology
MEMBERS INSTITUTION
Dato’ Dr. Chang Kian Meng (Chairperson) Ampang Hospital
Dr. Goh Ai Sim Pulau Pinang Hospital
Mdm. Lim Yeok Siew Ampang Hospital
Mdm. Sujatha a/p Suthandiram Ampang Hospital
Ms. Wong Shu Ping Ampang Hospital
10. Anti-infectives
MEMBERS INSTITUTION
Dr. Benedict Sim Lim Heng (Chairperson) Sg. Buloh Hospital
Dr. Mohd. Daud Che Yusoff Kuala Rompin Health Clinic
Ms. Sameerah binti Shaikh Abdul Rahman National Pharmaceutical Control Bureau
Dr. Muhammad Nazri bin Aziz Kuala Lumpur Hospital
Dr. Cheng Joo Thye Sg. Buloh Hospital
Mdm. Jacqueline Lai Mui Lan Tawau Hospital
Ms. Rahela binti Ambaras Khan Pharmaceutical Services Division, Ministry of Health
11. Musculoskeletal Therapeutics
MEMBERS INSTITUTION
Dr. Heselynn Hussein (Chairperson) Putrajaya Hospital
Dr. Muhaini binti Othman Serdang Hospital
Dr. Husni bin Hussain Putrajaya Health Clinic
Mdm. Salbiah binti Mohd. Salleh Pharmaceutical Services Division, Ministry of Health
Ms. Low Yen Lee Tengku Ampuan Rahimah Hospital, Klang
Ms. Beh Phaik Kee Taiping Hospital, Perak
12. Analgesics and Anaesthetics
MEMBERS INSTITUTION
Dr. Mary S. Cardosa (Chairperson) Selayang Hospital
Assoc. Prof. Dr. Choy Yin Choy Hospital Universiti Kebangsaan Malaysia
Dr. Richard Lim Boon Leong Selayang Hospital
Ms. Choo Yan Mei Tengku Ampuan Rahimah Hospital, Klang
Ms. Lee Ai Wei Selayang Hospital
MALAYSIAN STATISTICS ON MEDICINES 2007
13. Psychiatric Therapeutics
MEMBERS INSTITUTION
Dr. Siti Nor Aizah binti Ahmad (Chairperson) Kuala Lumpur Hospital
Dr. Azizul bin Awaluddin Putrajaya Hospital
Dr. Mazni binti Mat Junus Serdang Hospital
Dr. Umi Adzlin binti Silim Kajang Hospital
Dr. Vincent Wong Choong Wai Tengku Ampuan Rahimah Hospital, Klang
Ms. Noor Ratna binti Naharuddin Sultanah Aminah Hospital, Johor Bahru
Mdm. Shamini a/p Rama Bahagia Hospital, Ulu Kinta
Ms. Asriyati binti Misnan Permai Hospital, Johor Bahru
14. Respiratory Therapeutics
MEMBERS INSTITUTION
Datin Dr. Hjh. Aziah binti Ahmad Mahayiddin Institute of Respiratory Medicine, Ministry of Health Assoc. Prof. Dr. Pang Yong Kek (Chairperson) University Malaya Medical Centre
Prof. Dr. Liam Chong Kin University Malaya Medical Centre
Dato’ Dr. Hj. Abdul Razak bin Abdul Muttalif Pulau Pinang Hospital
Assoc. Prof. Dr. How Soon Hin International Islamic University Malaysia
Assoc. Prof. Dr. Roslina binti Abdul Manap Hospital Universiti Kebangsaan Malaysia Mdm. Nurul Adha binti Othman Pharmaceutical Services Division, Ministry of Health
Mdm. Leow Ai-Yuin Clinical Research Centre, National Institutes of Health
Mr. Jaya Muneswarao a/l Ramadoo@Devudu Kulim Hospital
Mdm. Sabrina binti Mohamad Salleh Kuala Lumpur Hospital
Mr. Thean Chow Hee Institute of Respiratory Medicine, Ministry of Health
15. Gastrointestinal Therapeutics
MEMBERS INSTITUTION
Datuk Dr. Jayaram Menon (Chairperson) Queen Elizabeth Hospital, Kota Kinabalu Dato’ Dr. Muhammad Radzi bin Abu Hassan Sultanah Bahiyah Hospital, Alor Setar
Dr. Hjh. Rosaida binti Mohd. Said Ampang Hospital
Mdm. Michelle Tan Hwee Pheng Hospital Universiti Kebangsaan Malaysia
Dr. Yung Chen Lin Clinical Research Centre, National Institutes of Health
Mr. Yip Kok Foo Penampang Health Clinic
Ms. Rainee Jay Chinniah Pharmaceutical Services Division, Ministry of Health
Mdm. Khutrun Nada binti Zulkifli Kuala Lumpur Hospital
16. Neurology
MEMBERS INSTITUTION
Dato’ Dr. Hj. Md. Hanip bin Rafia (Chairperson) Kuala Lumpur Hospital
Dr. Sapiah binti Sapuan Kuala Lumpur Hospital
Mdm. Siti Fatimah binti Ali Sultanah Nur Zahirah Hospital, Kuala Terengganu
Ms. Norsima Nazifah binti Sidek Sultanah Nur Zahirah Hospital, Kuala Terengganu
Ms. Jenny Thong Chen Ni Kuala Lumpur Hospital
17. Obstetrics and Gynaecology
MEMBERS INSTITUTION
Dato’ Dr. Ravindran Jegasothy (Chairperson) Kuala Lumpur Hospital Prof. Dato’ Dr. Nik Mohd Nasri bin Nik Ismail Universiti Sains Islam Malaysia
Dato’ Dr. Ghazali Ismail Sultan Ismail Hospital, Johor Bahru
Dr. Wan Abu Bakar bin Yusoff Sultanah Nur Zahirah Hospital, Kuala Terengganu
Dr. Ravichandran Jeganathan Sultanah Aminah Hospital, Johor Bahru
Dr. Tham Seng Woh Tuanku Ja’afar Hospital, Seremban
Dr. Zaridah binti Shaffie Tuanku Fauziah Hospital, Kangar
Dr. Wan Zahanim Wan Yusoff Kuala Krai Hospital
Mdm. Intan Shafina bt. Mamat@Shafie Kuala Lumpur Hospital
Ms. Tan Ai Leen Kuala Lumpur Hospital
MALAYSIAN STATISTICS ON MEDICINES 2007
18. Otorhinolaringology
MEMBERS INSTITUTION
Dr. Valuyeetham a/l Kamaru Ambu (Chairperson) Tuanku Ja’afar Hospital, Seremban
Dr. Saraiza binti Abu Bakar Serdang Hospital
Dr. Primuharsa Putra bin Sabir Husin Athar KPJ Seremban Specialist Hospital
Ms. Noraini binti Sa’ari Pharmaceutical Services Division, Ministry of Health
Mdm. Tengku Malini binti Tengku Mohmed Nor Izam Pharmaceutical Services Division, Ministry of Health
Ms. Lui Wei Qi Kuala Lumpur Hospital
19. Dermatology
MEMBERS INSTITUTION
Dr. Roshidah binti Baba (Chairperson) Kuala Lumpur Hospital
Datin Dr. Asmah binti Johar Kuala Lumpur Hospital
Dr. Choon Siew Eng Sultanah Aminah Hospital, Johor Bahru
Dr. Rohna binti Ridzwan Selayang Hospital
Dr. Azura binti Mohd Affandi Kuala Lumpur Hospital
Mdm. Hasnah binti Zakaria Bandar Kuantan Health Clinic
Ms. Wong Chee Wei Pulau Pinang Hospital
Ms. Noorsidah binti Md. Yusof Tengku Ampuan Afzan Hospital, Kuantan
Ms. Vivien Sim Hui Yen Tuanku Ja’afar Hospital, Seremban
20. Urology
MEMBERS INSTITUTION
Dato’ Dr. Rohan Malek Johan (Chairperson) Selayang Hospital Brig. Jen. Dato’ Dr. Selvalingam Sothilingam Kuala Lumpur Hospital
Ms. Katherine Foo Lim Kai Raja Permaisuri Bainun Hospital, Ipoh
Ms. Low Khin Siah Tengku Ampuan Rahimah Hospital, Klang
Ms. Siti Syarihan binti Abdullah Selayang Hospital
21. Ophthalmology
MEMBERS INSTITUTION
Dr. Tara Mary George (Chairperson) Selayang Hospital
Dr. Goh Pik Pin Clinical Research Centre, National Institutes of Health
Dr. Radzlian bin Othman Serdang Hospital
Dr. Shamala a/p Retnasabapathy Sg. Buloh Hospital
Ms. Choong Chiau Ling Selayang Hospital
Ms. Tang Sin Yu Pulau Pinang Hospital
Ms. Saraswati a/p K. Maheshvaran Raja Permaisuri Bainun Hospital, Ipoh
22. Pharmacoeconomics
MEMBERS INSTITUTION
Dr. Nour Hanah binti Othman (Chairperson) Pharmaceutical Services Division, Ministry of Health Dr. Faridah Aryani binti Md. Yusof Pharmaceutical Services Division, Ministry of Health Mdm. Fatimah binti Abdul Rahim Pharmaceutical Services Division, Ministry of Health Dr. Nadia Fareeda binti Muhammad Gowdh Clinical Research Centre, National Institutes of Health
Mr. Adrian Goh Azmi Burhani Consulting Sdn. Bhd.
MALAYSIAN STATISTICS ON MEDICINES 2007
CONTENTS
PREFACE iii
ACKNOWLEDGEMENTS iv
ABOUT THE NATIONAL MEDICINES USE SURVEY v
NMUS STEERING COMMITTEE vi
NMUS PROJECT TEAM vii
MEMBERS OF NMUS EXPERT PANELS viii
METHODS xv
ABBREVIATIONS xxiv
Chapter 1 : Use of Medicines in Malaysia 1
Chapter 2 : Expenditure on Medicines in Malaysia 9
Chapter 3 : Use of Drugs for Acid Related Disorders 15
Chapter 4 : Use of Antiobesity Drugs 19
Chapter 5 : Use of Antidiabetic Drugs 21
Chapter 6 : Use of Antianaemic Drugs 25
Chapter 7 : Use of Antihaemorrhagics 27
Chapter 8 : Use of Drugs for Cardiovascular Disorders 29
Chapter 9 : Use of Antihypertensives 41
Chapter 10 : Use of Lipid Modifying Drugs 49
Chapter 11 : Use of Dermatologicals 53
Chapter 12 : Use of Gynaecologicals, Sex Hormones and Hormonal Contraceptives 63
Chapter 13 : Use of Urologicals 71
Chapter 14 : Use of Drugs for Endocrine Disorders 75
Chapter 15 : Use of Anti-Infectives 79
Chapter 16 : Use of Antineoplastic Agents, Including Endocrine Therapy and Immunostimulants 97
Chapter 17 : Use of Systemic Corticosteroids and Immunosuppressive Agents 105
Chapter 18 : Use of Drugs for Rheumatological and Bone Disorders 109
Chapter 19 : Use of Opioid Analgesics 117
Chapter 20 : Use of Drugs for Neurological Disorders 119
Chapter 21 : Use of Drugs for Psychiatric Disorders 127
Chapter 22 : Use of Drugs for Obstructive Airway Diseases 139
Chapter 23 : Use of Antihistamines and Nasal Decongestants 143
Chapter 24 : Use of Ophthalmologicals 149
Chapter 25 : Use of Otologicals 160
MALAYSIAN STATISTICS ON MEDICINES 2007
METHODS
Lian L.M.1, Tang R.Y.2, Hafizh A.A.2, Hazimah H.1, Gan H.H.1, Kok L.C.1, Leow A.Y.1, Lim J.Y.2, Thoo S.2, Hoo L.P.3, Faridah A.M.Y.4, LimT.O.1
1. Clinical Research Centre, National Institutes of Health, MOH 2. Datamed Sdn. Bhd., 3. Stats Consult Sdn. Bhd., 4. Pharmaceutical Services Division, MOH
Introduction
The NMUS is designed, broadly speaking, to estimate the quantity and pattern of use of medicines in Malaysia, as well as to estimate our
expenditure on pharmaceuticals. This is an ambitious project which requires multiple surveys at the various levels of the medicines supply and
distribution chain in the country (Figure 1) in order to capture all the required data to meet its purpose. Due to limitations of manpower and
resources, this project must of necessity be undertaken in phases. We have realistically targeted data sources that are absolutely critical and
accessible, leaving the most inaccessible data sources for the future, hoping to build on the foundations laid by earlier surveys and capitalise on
their successes.
Hence, the statistics on medicines use and expenditure in this report are estimated from data from a limited number of surveys (which were
essential and critical) that could be successfully completed nation-wide. The scope was also deliberately limited to “Prescription- Only Medicines”
(obviously the pharmaceuticals of greatest interest) and excludes Over-the-Counter (OTC) medicines, traditional or herbal products and food
supplements. “Prescription-Only Medicines” include all drugs classified as “poisons” under the Poisons Act 1952 (revised 1989). 1
MALAYSIAN STATISTICS ON MEDICINES 2007
NMUS Surveys
The NMUS 2007 conducted several surveys in order to capture data at the various levels of the medicines supply and distribution system in the country. The sources of data, data collection surveys, data availability and comments on data inclusion in this report are summarised in the table below:
No. Data sources and Surveys Year data available Inclusion in present report
1. Medicines import or production data
1.1 Medicines import data from Royal Malaysian Custom Data not collected No
1.2 Local pharmaceutical manufacture Data not collected No
2. Domestic sales data
2.1 Domestic sales data from local pharmaceutical companies Data not collected No
3. Medicines procurement data
3.1 Public hospitals medicines procurement data from several sources:
a. MOH procurement through central tender (APPL) 2006, 2007 Yes
b. MOH individual hospital local purchase (NonAPPL) 2006, 2007 Yes
c. University and Armed Forces hospitals procurement 2006, 2007 Yes
3.2 Private hospitals procurement 2006, 2007 Yes
3.3 Private GPs procurement Data not collected No
3.4 Private specialist practice procurement Data not collected No
3.5 Private pharmacies procurement Data not collected No
4. Medicines prescription data
4.1 Public (MOH) primary care practice prescription Data not collected No
4.2 Private GP prescription 2006, 2007 Yes
4.3 Private specialist practice prescription of highly specialised medicines Data not collected No
4.4 Hospital practice prescription Data not collected No
5. Medicines dispensing data
5.1 Public hospital pharmacy dispensing Data not collected No
5.2 Private free-standing pharmacy dispensing 2006, 2007 Yes
6. Household medicines consumption data
6.1 Household survey on medicines consumption Data not collected No
In summary:
• Of the 6 theoretical data sources, NMUS primarily targeted data sources on public and private hospital medicines procurement and private practice prescription/dispensing. This adequately reflects the total utilisation of all medicines in the country.
• Collection of prescription data was limited to general clinic practices, while hospital prescription is assumed to be included in hospital procurement data.
• Similarly, hospital dispensing data are assumed to be included in hospital procurement data, except of course for private free-standing pharmacies. Dispensing survey is therefore limited to the latter only. Given that private medical practitioners in Malaysia retain dispensing rights, prescription is a far more important source of data than dispensing, unlike say in Australia.
• Many private medical specialists may self-procure and dispense, rather than use hospital pharmacy dispensing service. Thus, in so far that prescription of highly specialised medicines for a particular condition is concentrated in private ambulatory specialist practices (which are unlikely as most such drugs are probably prescribed in hospital setting), they will be under-estimated in this report. Separate procurement and prescription surveys on such highly specialised medicines (if any) are required.
• It is well known that consumers do access medicines through both formal as well as informal channels. Household surveys will be required to obtain information on such use of medicines in the community.
MALAYSIAN STATISTICS ON MEDICINES 2007
Survey population, sampling and response or coverage rate
The surveys conducted by NMUS 2007, the survey population and sampling unit, sample size and survey response or coverage rates are summarised in the table below:
No. Surveys Survey population and
sampling unit Sample size
2. Private hospitals pharmaceutical
procurement 142 Private hospitals 33 23.2 %
3. University and Armed Forces hospital pharmaceutical procurement
3 University hospitals 2 Armed Forces hospitals
3 University 2 Armed Forces hospitals
100% for University 100% for Armed Forces
4. Private GP prescription 6013 393 6.54%
5. Private pharmacy dispensing 1663 34 2.04%
Data collection
The surveys conducted by NMUS collected data either by
1. Download from existing databases
2. Primary data collection
These are described below:
No. Surveys Data download from existing databases
1. MOH pharmaceutical procurement Pharmaniaga pharmaceutical procurement databases, central database as well as individual hospitals’ local purchase databases
2. Private hospitals pharmaceutical procurement Individual hospitals’ pharmaceutical procurement databases
3. University and Armed Forces hospital pharmaceutical
procurement Individual hospitals’ pharmaceutical procurement databases
4. Private GP prescription A sample of GPs collected prescription data in a randomly selected week. The sample being distributed over 3 four-monthly cycle
5. Private Pharmacy dispensing
A sample of pharmacies with resident pharmacist collected dispensing data in a randomly selected week. The sample being distributed over 3 four-monthly cycle
Data management
The collected data, whether in databases or in paper or electronic data collection form, was compiled into a single database, appropriately processed and coded prior to statistical analysis.
The NMUS database was created in Ms SQL Server 2000. The application has 3 modules: Contact Management, Data Entry and Data Processing.
• Contact Management module was used to collect the establishments’ survey details, log and track all the correspondence documents with SDP, and forecast, plan and schedule the conduct of the survey.
• Data Entry module was used to collect the data submitted by the SDP in paper form. It has been designed to collect data from GP prescription survey and pharmacy dispensing survey using paper CRF or prescription booklets.
• Data Processing module was used to clean, manage and process the medicines data prior to statistical analysis. The automated data processing functionalities included ATC coding, DDD Assignment, Total Dosage Calculation and Unit Conversions.
The database server was running on Windows 2003 R2 server. The server environment was Intel processor 2.33 Mhz, with a total of 8GB RAM memory and 800GB hard disk drive.
MALAYSIAN STATISTICS ON MEDICINES 2007
The data processing steps were as follows:
No. Data processing for downloaded database
1. Data were downloaded from the existing database of the following data sources
• MOH APPL Procurement
• MOH Non-APPL Procurement
• Private Hospital Procurement
• University Procurement
• Armed Forces Procurement
• GP Prescription
• Private Pharmacy Dispensing
The data downloaded could be in flat file format, e.g. TXT/ XLS and etc, or database files such as Access/ Oracle/ SQL and etc.
2.
The structure of each of the downloaded database/ data file were studied and analysed to identify the required data fields/ variables. The required variables were registration number, drug description, packaging description, supplier name, value procured, quantity procured, year procured and etc.
3. Next, the required fields/ variables were extracted using SQL queries. The extracted data were then normalised by separating into multiple, related tables in a single compiled database.
4. Some of the data required aggregation, e.g. total a few transactions on the same drug into 1 record, to speed up subsequent query performance.
5. The data were then be linked to the respective SDP in the main contact table.
No. Data processing for primary survey data
1. Data entry
Data was entered into the Data Entry module of the database.
Prior to data entry, data entry personnel were briefed on how to use the application and enter the data. Necessary precautions were given verbally, for example, to check each clinic by office id and name, as they are clinics with many branches of the same name.
A demonstration was done on data entry during the briefing.
Personnel were supervised while doing the first few entries to make sure they know how to do it correctly.
A standard document on steps/ precautions for data entry was given to each personnel.
They were also given a softcopy of the list of pharmaceutical products (scheduled poison and non-scheduled poison) obtained from National Pharmaceuticals Control Bureau, to cross-check the spelling of drugs when the writing is less legible.
2. Edit checks
Survey forms were cross-checked against the database.
Selection of survey form was by data entry personnel, randomly by survey date. If number of drug entries for selected date was not sufficient, more survey dates were included.
Items checked:
a. Number of patients were same in survey form and database
b. Number of drug entry/ drug prescribed was same in survey form and database
c. Age, sex of patient was entered correctly d. Drug particulars were entered correctly
3. Calculations and Derived variables
• Dose per day was obtained by Dosage*frequency
• Dose per visit was obtained by Dosage*frequency* duration
4. Visual review and manual assessment of entries if there were misspellings.
MALAYSIAN STATISTICS ON MEDICINES 2007
No. Common data processing steps
1. BPFK Registered Product List
An estimated 7,028 ‘prescription’ products from 11,400 products registered with BPFK were coded to ATC INN (Level 5). The coded BPFK drugs list served as an internal drug dictionary for medicines data coding.
2. Data Parsing by programming
The variables ‘Drug Description’ and ‘Packaging Description’ in medicines (procurement/ prescription/ dispensing) data were parsed into smaller parts using a specially written computer program. Parsing facilitated the auto-coding process and dosage calculation later.
The variable ‘Drug Description’ was parsed into ‘Brand’, ‘INN’, ‘Dosage’, ‘Unit’ and ‘Route’
e.g. Zocor Tab 80 mg
Brand – Zocor Inn – none Dosage – 80 Unit – mg Route – Tab
The variable ‘Packaging Description’ was parsed into ‘Big Unit’, ‘Small Unit’ and ‘Factor’ e.g. Pack of 10 tabs
Big Unit – Pack Small Unit – tabs Factor – 10
3. ATC Coding
• The parsed ‘Brand’ was then linked to the coded BPFK drug list to obtain the ATC, INN and DDD. However, if a certain brand had more than 1 DDD, the administration route had to be considered when assigning the DDD.
• On the other hand, any parsed ‘INN’ was linked directly to the ATC Level 5 to obtain the standard INN and DDD. Similarly, if a certain INN had more than 1 DDD, the administration route had to be considered when assigning the DDD.
• Visual review and manual coding of residual medicines data to ATC was carried out for residual data which were not auto-processed due to incompleteness or inconsistencies.
4. Drug Description Dosage and Unit
The ‘Drug Description Dosage and Unit’ were parsed into ‘Dosage’ and ‘Unit’ unless more than 1 dosage exists, e.g. 2MG/ML 100ML. The latter type of data would require further processing.
The results of this step were ‘Total Drug Description Dosage’ and ‘Total Drug Description Unit’. Remaining residual were handled manually.
5. Packaging Description Dosage
The ‘Packaging Description’ was parsed ‘Pack Description’ and ‘Factor’ and the ‘Packaging Description Dosage’ calculated with reference to the ‘SKU’ or ‘UOM’.
The result of this step is the ‘Total Packaging Description Dosage’.
Remaining residual has been handled manually.
6. Total Dosage Calculation
Total Dosage = Total Drug Description Dosage * Total Packaging Description Dosage * Quantity procured
Total Dosage Unit = Total Drug Description Unit
MALAYSIAN STATISTICS ON MEDICINES 2007
Statistical report
This statistics on use of medicines in this report are presented using the Anatomical Therapeutic Chemical (ATC) classification system and the unit of measurement is expressed in defined daily dose (DDD).2 This system is recommended by the WHO to be used for drug utilisation research and for
purpose of comparisons of drug consumption statistics between countries, between regions or population groups within country and to evaluate trends in drug use over time.
Structure of the ATC Classification system
In this system, medicinesare divided into different groups according to the organ or system on which they act, and on their chemical, pharmacological and therapeutic properties.
Medicines are classified in groups at 5 different levels as follows:
Level Group and subgroups
1 Anatomical main group. There are 14 of these, eg. C cardiovascular, M musculo-skeletal, R respiratory, etc.
2 Therapeutic main group
3 Therapeutic subgroup
4 Chemical or Therapeutic subgroup
5 Drug chemical substance
For example, Simvastatin is coded C10AA01. The structure of its code is as follows:
Level Code Group and subgroups
1 C Cardiovascular system
2 C10 Serum lipid reducing agents
3 C10A Cholesterol or triglyceride reducers
4 C10AA HMG CoA reductase inhibitors
5 C10AA01 Simvastatin
Concept of the Defined Daily Dose (DDD)
The measurement unit for medicines use adopted in this report is the DDD.
The DDD is the assumed average maintenance dose per day for a drug used for its main indication in adults. The DDD is simply a technical
measure of drug utilisation; it does not necessarily agree with the recommended or prescribed daily dose. Doses for individual patients and patient
groups will often differ from the DDD. The DDD is often a compromise based on review of the available information about doses used in various
countries. The DDD may even be a dose rarely prescribed because it is an average of two or more commonly used doses.
Medicines use statistics in this report are presented for most drugs as numbers of DDDs per 1000 inhabitants per day. Some interpretative notes
are as follows:
• The DDDs/1000 inhabitants/day provides a rough estimate of the proportion of population treated daily with certain drugs. For example, the figure 10 DDDs/1000 inhabitants/day indicates that 1% (10/1000) of the population on average might get a certain drug or group of drugs
every day in the year.
• The DDDs/1000 inhabitants/day is most useful for drugs used in the treatment of chronic diseases and especially when there is a good agreement between the average prescribed daily dose and the DDD.
• For most drugs, the DDDs/1000 inhabitants/day is calculated for the total population including all age and sex groups. Where a drug use is limited to particular age or sex groups, then it will be more meaningful to express the figure for the relevant age-sex groups only. For example DDDs/1000 children age<12 /day, or DDDs/1000 women in reproductive age groups/day.
MALAYSIAN STATISTICS ON MEDICINES 2007
For anti-infectives (or other drugs normally used in short duration), the medicines use statistics are also presented as DDD per inhabitant per year. This gives an estimate of the number of days for which each inhabitant is, on average, treated annually. For example, 5 DDDs/inhabitant/year indicates that the utilisation is equivalent to the treatment of every inhabitant with a 5-days course in the year.
In interpreting drug utilisation statistics using DDDs as in this report; readers are cautioned to bear in mind the following limitations:
• A medicine may have several indications while the DDD is based on the main indication in adults.
• Medicines procured, prescribed or dispensed, as presented here, are assumed to be consumed (although it may not necessarily be so).
• DDDs may be difficult to assign or not assigned at all for certain medicines, for examples, medicines with multiple ingredients, topical products, anti-neoplastic drugs and anaesthetic agents.
• Medicines newly introduced into the market may yet have ATC and DDD assigned to them.
• The DDD assigned to a drug is primarily based on other countries’ experience and may not reflect the commonly prescribed adult dose in Malaysia.
For most parts of this report, only drugs with WHO-assigned DDDs are included in the utilisation statistics. However, a few groups of drugs which do
not have WHO-assigned DDDs, namely the Antineoplastics, Dermatologicals, Ophthalmologicals and Otologicals were given arbitrary DDDs (mainly
the most common unit of measure ie. g, mg or ml) to enable us to present their national utilisation and patterns of use, relative to drugs within the
respective groups only.
Statistical Methods
For this NMUS report, the quantity of use of a medicine is expressed, depending on the type of medicine, as the number of DDDs per 1000
inhabitants per day or DDDs per inhabitants per year. These statistics are calculated as follows:
DDDs/1000 inhabitants/day =
or
DDDs/1000 inhabitants/year =
where
Tˆ
is an estimate of the total quantity of the drug utilised in the year under consideration,DDD is the DDD assigned for the drug according to the ATC/DDD system,
P is the mid-year population of Malaysia (P2007= 27,173,600), 365 refers to the 365 days in a year
In either case, an estimate of the total quantity of the drug being utilised in the year is required, and this must be expressed in the same unit as the DDD assigned for the drug.
The statistical estimation of the totals varies depending on the survey method and the sampling design employed to collect the data, and if necessary with adjustment for incomplete data. These are described on the following page.
ˆ *1000
* *365
T
DDD P
ˆ *1000
*
T
MALAYSIAN STATISTICS ON MEDICINES 2007
No. Surveys Estimation procedure
1. MOH pharmaceutical procurement: APPL
No sampling was employed in the survey as there was full response. Therefore, the total is the sum of all the quantities of the drug procured in all procurement records in the year.
The total is
∑
T
is the value of the quantity of drug procured of the ith hospital in the year.2. i) MOH pharmaceutical procurement : Non APPL
ii) University and Armed Forces’ hospital
Data were available for only a sample of hospitals.
The total is estimated by
Tˆ
=∑∑
T
is the value of the quantity of drug procured of the ith hospital in the year,j = strata according to bed strength of the hospital,
j = 1: bed strength ≤ 20,
j = 2: 21 ≤ bed strength ≤ 50,
j = 3: 51 ≤ bed strength ≤ 100,
j = 4: bed strength ≥ 101.
The sampling weight of each strata,
j
3. i) Private GP prescription
ii) Private pharmacy dispensing
Data were collected only for a sample of GP or pharmacy and for each respondent, data collected only for a sample of days in a year (working days only).
The total is estimated by
∑∑
= =
where N is total number of GP or pharmacy in the population, n is number of responding GP or pharmacy (sample), D is the total number of working days in a year, and
d
i is the number of survey days of ithGP or pharmacy in a year.
Where there was sampling or where response rate of the survey was less than 100%, the procedures described above incorporated the sampling weight of the sampling unit in the estimation of total.
The sampling weight for each sampling unit or unit of analysis has the following components:
1. Probability of selection
The basic weight is obtained by multiplying the reciprocals of the probability of selection at each step of sampling design. Example, for GP prescription survey, this is GP practice and prescription day.
2. Adjustment for non-response
The response rate was less than 100% for some surveys; an adjustment to the sampling weight is required. The non-response adjustment weight is a ratio with the number of units in the population as the numerator and the number of responding sampling units as the denominator. The adjustment reduces the bias in an estimate to the extent that non-responding units have same characteristics as responding units. Where this is unlikely, some adjustments took into account differences in some relevant characteristics between responding and non-responding units that may influence drug utilisation, such as bed strength, staff strength, scope of services for hospitals etc.
To enable comparison between results for NMUS 2007 with those of NMUS 2006, the 2006 data were reviewed and total utilisation recalculated where necessary eg. where there was change in ATC code or ddd assigned by WHO, or standardisation of codes for drugs with multiple codes. There were also some corrections for 2006 data where discrepancies were detected when compared with 2007 statistics.
MALAYSIAN STATISTICS ON MEDICINES 2007
EXPENDITURE ESTIMATION METHODOLOGY
Study Population
The NMUS 2007 covered private & public healthcare providers in Malaysia comprising:
a. The public health sector which consists of hospitals and primary care clinics of the Ministry of Health, University Hospitals under the Ministry of Higher Education and Military Hospitals under the Ministry of Defence.
b. The private health sector consisting of private hospitals, general practitioners and private retail pharmacies in Malaysia
Methodology
The expenditure on a particular drug in a given year is the quantity of drug used in that year multiplied by the price of the drug, i.e. :
Total expenditure = Quantity of drug utilisation * Price of drug
The ‘quantity of drug utilisation’ is determined from the drug utilisation data presented elsewhere in this report.
‘Price of drug’ is the median price for each drug chemical substance (5th level ATC classification) denominated in Daily Defined Doses (DDD). The
median price is determined from the data collected in NMUS, taking into account price variations for dosage forms (route of administration), and differences between prices in public and private sectors. Thus there are two sets of median prices for each drug chemical substance i.e. public and private median prices.
Prices for the public sector were determined from procurement data of MOH, University and Armed Forces healthcare establishments whilst private sector prices were determined from procurement data of private hospitals. As GP prescriptions & retail pharmacy dispensing data obtained by NMUS did not contain any data usable for calculating prices, the prices estimated from private hospitals were applied to GP and Pharmacy data.
The expenditure for each procurement item is then calculated as Ei = p50i * DDDi where p50 is the median price, DDD is the quantity of utilisation and “i” refers to the drug chemical substance. The total expenditure on a drug chemical substance in a particular sector is the sum of all procurement, prescription and dispensing of the item in that sector. The total expenditure for the country is the sum of total expenditure in all the sectors.
For this report, a slightly different methodology from that of MSOM 2006 was used for computation and ranking of total expenditure:
• For MSOM 2006, price and total expenditure were calculated and ranked only for drugs which appeared in the top 150 utilisation ranking. For this report (MSOM 2007), prices and total expenditure were calculated for all drugs with price information available in NMUS data irrespective
of their utilisation ranking. The total expenditures were then ranked accordingly.
• In this report (MSOM 2007), weightage was given to bed strength stratification in adjusting quantity of drug utilisation by dosage form (administration route) whilst the overall drug utilisation quantity was used in MSOM 2006.
The total expenditures for 2006 were recalculated to enable comparison with those of 2007.
References:
1. Percetakan Nasional Malaysia Bhd. Poisons Act 1952 (revised 1989), Act 366 Laws of Malaysia. Kuala Lumpur 1989
2. WHO Collaborating Centre for Drug Statistics Methodology. Guidelines for ATC Classification and DDD Assignment 2009. Oslo December 2008.
MALAYSIAN STATISTICS ON MEDICINES 2007
ABBREVIATIONS
3rd GCS Third-Generation Cephalosporins
5HT1 Serotonin
ACEI Angiotensin Converting Enzyme Inhibitors
ACS Acute Coronary Syndrome
ACTH Adrenocorticotropic Hormone
AdmR Administration Route
ADT Androgen Deprivation Treatment
AED Antiepileptics
Anti-HIV Anti-Human Immunodeficiency Virus
ARB Angiotensin II Antagonists/ Angiotensin Receptor Blocker
ASR Age Standardised Incidence Rate
ATC Anatomical Therapeutic Chemical
BPFK Biro Pengawalan Farmaseutikal Kebangsaan
BPH Benign Prostatic Hyperplasia
BSA Body Surface Area
CCB Calcium Channel Blockers
CNI Calcineurin Inhibitor
CNS Central Nervous System
COMT Catechol-O-Methytransferase
COPD Chronic Obstructive Pulmonary Disease
COX-2 Cyclooxygenase-2
CPG Clinical Practice Guidelines
CTZ Chlorothiazide
DAs Dopamine Agonists
DCA Drug Control Authority
DDA Dangerous Drugs Act
DDD Defined Daily Dose
DMARD Disease-modifying Antirheumatic Drugs
EPS Extrapyramidal Syndrome
ESAC European Surveillance of Antimicrobial Consumption
ESBL Extended Spectrum Beta-lactamase
ESRD End-Stage Renal Disease
ESRF End-Stage Renal Failure
FEIBA Factor VIII Inhibitor Bypassing Activity
3rd GCS Third-generation Cephalosporins
GORD/GERD Gastro-Oesophageal Reflux Disease
GRACE Global Registry of Acute Coronary Events
MALAYSIAN STATISTICS ON MEDICINES 2007
HAART Highly Active Anti-Retroviral Therapy
HCTZ Hydrochlorothiazide
HIV Human Immunodeficiency Virus
HMG CoA 3-hydroxy-3-methylglutaryl Coenzyme A
IOP Intraocular Pressure
LABA Long-Acting Beta Agonists
LDL Low Density Lipoprotein
LHRH Luteinizing Hormone-Releasing Hormone
LUTS Lower Urinary Tract Symptoms
LV Left Ventricular
MG Myasthenia Gravis
MOH Ministry of Health
MRSA Methicillin-resistant Staphylococcus aureus
MSOM Malaysian Statistics on Medicines
MSSA Methicillin-sensitive Staphylococcus aureus
NEDL National Essential Drugs List
NHMS National Health and Morbidity Survey
NMP National Medicines Policy
NMUS National Medicines Use Survey
NSAIDs Non Steroidal Anti-Inflammatory Drugs
O&G Obstetrics and Gynaecology
OTC Over-the-Counter
PCOS Polycystic Ovarian Syndrome
PD Parkinson’s Disease
PDE5 Phosphodiesterase Type-5
PPI Proton Pump Inhibitors
rHuEPO Recombinant Human Erythropoietin
RRMS Remitting-Relapsing Multiple Sclerosis
RTI Respiratory Tract Infection
SABA Short-Acting Beta Agonists
SORMs/SERMs Selective Oestrogen Receptor Modulators
SSRIs Selective Serotonin Reuptake Inhibitors
STD Sexually Transmitted Diseases
TZD Thiazolidinediones
RTI Respiratory Tract Infection
UTI Urinary Tract Infection
WFH World Federation of Haemophilia
WHO World Health Organisation
MALAYSIAN STATISTICS ON MEDICINES 2007
CHAPTER 1
USE OF MEDICINES IN MALAYSIA
Lian L.M.1, Faridah A.M.Y.2, Hazimah H.1, Kok L.C.1, Sivasampu S.1
1. Clinical Research Centre, National Institutes of Health, 2. Pharmaceutical Services Division, MOH
In this chapter, we report an overview of the national estimates for the use of medicines in Malaysia for year 2007. The most commonly used medicines by therapeutic groups and by specific drugs are tabulated below. More detailed statistics and analysis of medicines utilised are given
in other chapters in this report.
As in previous years, the National Medicines Use Survey (NMUS) 2007 was limited to “prescription” medicines only; it excluded Over-the-Counter (OTC) medicines and Traditional Medicines. Also, utilisation data presented in this chapter included only drugs that have Defined Daily Doses
(DDDs) in the World Health Organisation (WHO) Anatomical Therapeutic Chemical (ATC) classification system,1 and the estimates are expressed as
number of DDDs per 1000 population per day. Hence the discussions in relation to ranking and comparison of usage in this chapter do not include drugs which do not have WHO assigned DDD and are not prescription medicines.
However, estimates for utilisation of some medicines which do not have WHO assigned DDDs are presented, in terms of weight of active ingredient/1000 population per day (Antineoplastic drugs) or weight or volume of drug preparations per 1000 population per day (Dermatologicals, Ophthalmologicals and Otologicals), in other chapters where the utilisation of these drugs within their respective groups are discussed.
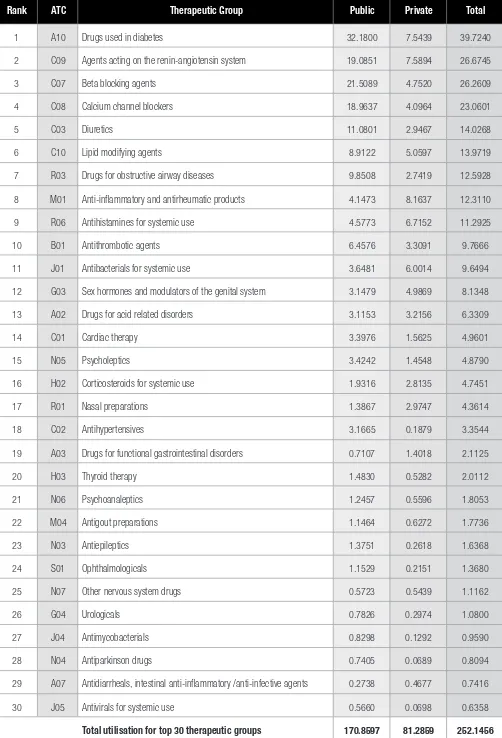
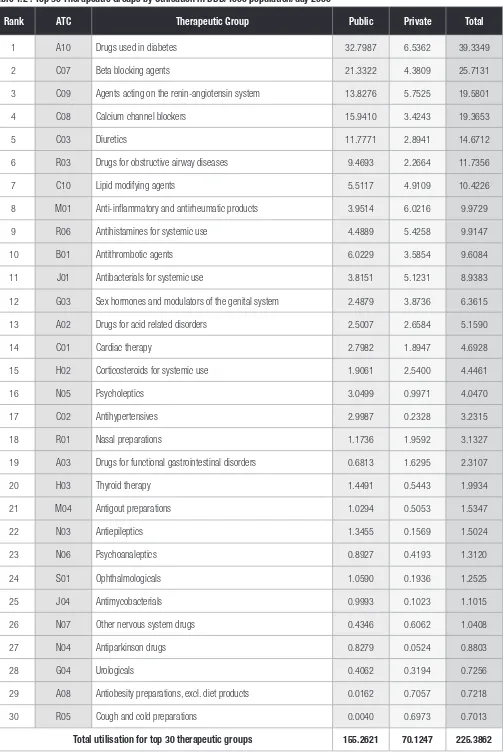
Among the therapeutic groups, drugs used in diabetes (ATC code A10) ranked highest in terms of utilisation in Malaysia for the year 2007 (Table 1.1) as was in 2006 (Table 1.2). An estimate of 3.97% of the Malaysian population was on drugs from this therapeutic group. This correlates well with the national diabetes prevalence of 4.0% in the general population reported in the Third National Health and Morbidity Survey 2006 (NHMS III).2
The therapeutic groups used for cardiovascular disorders, namely agents acting on the renin-angiotensin system (C09) consumed by 2.67% of the population, beta blocking agents (C07) consumed by 2.62% of the population, calcium channel blockers (C08) consumed by 2.31% of the population, diuretics (C03) consumed by 1.40% of the population and lipid-modifying agents (C10) consumed by 1.39% of the population, were
ranked 2nd, 3rd,4th, 5th and 6th respectively (Table 1.1).
Drugs for obstructive airway diseases constituted the next highest ranking group of drugs. However, there was not much difference in total utilisation between 2007 (12.59 DDD/1000 population/day) and 2006 (11.73 DDD/1000 population/day).
As far as individual drugs were concerned, ranks 1 to 11 by utilisation for 2007 went to drugs for diabetes and cardiovascular disorders (Table 1.3), again reflecting the pattern for prevalence of chronic diseases reported by NHMS III where hypertension, diabetes and heart diseases ranked 1st, 2nd and 4th among the topchronic illnesses. Overall, there was not much difference in ranking for the top 5 drugs by utilisation when compared
to 2006.
Metformin (consumed by 1.43% of the population), followed by glibenclamide (consumed by 1.28% of the population), were the top 2 antidiabetic drugs as well as the top 2 among all drugs utilised. Metformin was recommended as first-line therapy in the treatment of Type 2 diabetes mellitus
according to the Malaysian Clinical Practice Guidelines (CPG) at that time.3 This may reflect some improvement in terms of adherence to the
guidelines compared to 2006 where usage of glibenclamide superseded metformin.
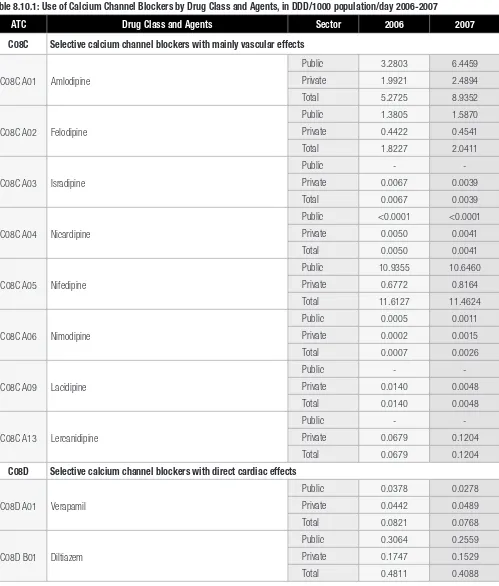
It is interesting to note that usage of amlodipine had gone up from rank 9th in 2006 to rank 6th in 2007, with almost 70% increase in utilisation.
Usage in the public sector in 2007 was double that of 2006. Perindopril had also climbed up the chart from being only at rank 11th in 2006 to
rank 7th in 2007, again with almost 70% increase in usage. The increase in utilisation of amlodipine and perindopril may possibly be attributed to
the findings of the Anglo Scandinavian Cardiovascular Outcome Trial (ASCOT), which was published in 2005.4 Also, generic versions of amlodipine
MALAYSIAN STATISTICS ON MEDICINES 2007
Asthma was the 3rd highest ranking chronic disease reported in NHMS III. It is therefore not surprising that inhaled salbutamol (R03A) occupied
12th position in the 2007 utilisation ranking for individual drugs, an improvement from its 13th position in 2006, with approximately 30% increase
in usage. Usage of budesonide, an inhalation steroid, however, dropped from rank 25th in 2006 (1.787 DDD/1000 population/day) to rank 38th
(1.1984 DDD/1000 population/day) in 2007. Although detail statistics in other parts of this report showed general decrease in use of
single-ingredient inhaled glucocorticoids, there was an overall increase in use of inhaled combination glucocorticoids with long-acting beta agonists.
It is also interesting to note the improvement in rankings of oral contraceptives. The combination levonorgestrel and oestrogen which ranked 31st
in 2006 moved up to 21st in 2007, whilst the desogestrel and oestrogen combination, a third generation oral contraceptive, emerged as a new
member in the top 40 drugs by utilisation list at rank 39th (2007), moving up from 49th in the previous year. In terms of utilisation, there were overall
increase of 1.12 DDD/1000 population/day and 0.28 DDD/1000 population/day, respectively, for the 2 combination oral contraceptives (equivalent
to an increase of 75% and 30%, respectively).
Comparing the Malaysian drug utilisation pattern with that of Australia5 and Norway6, whilst cardiovascular drugs dominated the top 10 drugs by
utilisation in all 3 countries, ranking for individual drugs for Malaysia differed somewhat from that of Australia and Norway as shown in Table 1.6.
The most significant differences are the presence of nervous system drugs in the top 10 drugs for Australia (sertraline (N06AB06) ranked 7th) and
Norway (zopiclone, (N05CF01) ranked 4th); both these drugs are not even in the top 40 drugs in Malaysian ranking. Metformin, the most highly
utilised drug in Malaysia did not feature among the top 10 drugs for both Australia and Norway although the consumptions were comparable -
14.28, 15.65, 11.98/1000 population/day, respectively, for Malaysia, Australia and Norway; in fact, neither did any of the other antidiabetic drugs
make it to the top 10 list for Australia and Norway. Diabetes prevalence in Australia was 3.6% (2005-2006)7 and Norway 4.7% (2007).8 Instead,
the lipid-modifying drugs, atorvastatin and simvastatin topped the Australian and Norwegian list, respectively.
The National Medicines Use Survey (NMUS), amongst other objectives, is designed to support the implementation of the National Medicines Policy
which promotes equitable access to essential medicines. Hence, it is pertinent to note that 10 out of the top 40 drugs used in 2007 are not in
the Malaysian National Essential Drugs List (NEDL) 2008.9 These included amlodipine, an antihypertensive drug (rank 6th), loratadine, a commonly
used non-sedative antihistamine (rank 24th), cetirizine (another antihistamine) which saw a 51% increase in usage and improved ranking from 32nd
(2006) to 25th (2007), and simvastatin (a lipid-modifying drug) which has been consistently in the top 40 drugs used (rank 17th in 2006 and 16th
in 2007). Based on the utilisation patterns established by NMUS, there is an apparent ‘mismatch’ between what is most used and what is listed
in the NEDL in some therapeutic areas. Whilst the NEDL serves only as a guide to drugs which should be available in the country, there is need to
regularly update the medicines selections to reflect new therapeutic options and changing therapeutic needs.
The NMUS showed that the drug utilisation patterns in Malaysia concurred with prevalence of chronic diseases reported in NHMS III. It also showed
that for both 2006 and 2007, the overall drug utilisation in the public sector was twice that of the private sector for the top 30 therapeutic groups.
Twenty of the thirty most utilised classes of drugs were for chronic diseases, and public sector utilisation exceeded that of private sector, indicating
an imbalance in burden borne in the management of these diseases. This also concurred with the NHMS III which found that government health
centres were the most frequently visited by respondents with chronic diseases followed by private clinics.
However, the pattern was reversed for drugs used for short term symptomatic relief such as antihistamines, anti-inflammatory and antirheumatic
drugs, nasal preparations, drugs for gastrointestinal disorders and corticosteroids, where private sector utilisation was higher. Interestingly, the
NHMS III found that among those who used ambulatory services for recent illnesses, 62.1% went to private clinics whilst 37.9% used government
clinics.10
In conclusion, the overall utilisation pattern of medicines in the country for 2006-2007 appeared to be in accordance with the general healthcare
needs.
MALAYSIAN STATISTICS ON MEDICINES 2007
Table 1.1 : Top 30 Therapeutic Groups by Utilisation in DDD/1000 population/day 2007
Rank ATC Therapeutic Group Public Private Total
1 A10 Drugs used in diabetes 32.1800 7.5439 39.7240
2 C09 Agents acting on the renin-angiotensin system 19.0851 7.5894 26.6745
3 C07 Beta blocking agents 21.5089 4.7520 26.2609
4 C08 Calcium channel blockers 18.9637 4.0964 23.0601
5 C03 Diuretics 11.0801 2.9467 14.0268
6 C10 Lipid modifying agents 8.9122 5.0597 13.9719
7 R03 Drugs for obstructive airway diseases 9.8508 2.7419 12.5928
8 M01 Anti-inflammatory and antirheumatic products 4.1473 8.1637 12.3110
9 R06 Antihistamines for systemic use 4.5773 6.7152 11.2925
10 B01 Antithrombotic agents 6.4576 3.3091 9.7666
11 J01 Antibacterials for systemic use 3.6481 6.0014 9.6494
12 G03 Sex hormones and modulators of the genital system 3.1479 4.9869 8.1348
13 A02 Drugs for acid related disorders 3.1153 3.2156 6.3309
14 C01 Cardiac therapy 3.3976 1.5625 4.9601
15 N05 Psycholeptics 3.4242 1.4548 4.8790
16 H02 Corticosteroids for systemic use 1.9316 2.8135 4.7451
17 R01 Nasal preparations 1.3867 2.9747 4.3614
18 C02 Antihypertensives 3.1665 0.1879 3.3544
19 A03 Drugs for functional gastrointestinal disorders 0.7107 1.4018 2.1125
20 H03 Thyroid therapy 1.4830 0.5282 2.0112
21 N06 Psychoanaleptics 1.2457 0.5596 1.8053
22 M04 Antigout preparations 1.1464 0.6272 1.7736
23 N03 Antiepileptics 1.3751 0.2618 1.6368
24 S01 Ophthalmologicals 1.1529 0.2151 1.3680
25 N07 Other nervous system drugs 0.5723 0.5439 1.1162
26 G04 Urologicals 0.7826 0.2974 1.0800
27 J04 Antimycobacterials 0.8298 0.1292 0.9590
28 N04 Antiparkinson drugs 0.7405 0.0689 0.8094
29 A07 Antidiarrheals, intestinal anti-inflammatory /anti-infective agents 0.2738 0.4677 0.7416
30 J05 Antivirals for systemic use 0.5660 0.0698 0.6358
MALAYSIAN STATISTICS ON MEDICINES 2007
Table 1.2 : Top 30 Therapeutic Groups by Utilisation in DDD/1000 population/day 2006
Rank ATC Therapeutic Group Public Private Total
1 A10 Drugs used in diabetes 32.7987 6.5362 39.3349
2 C07 Beta blocking agents 21.3322 4.3809 25.7131
3 C09 Agents acting on the renin-angiotensin system 13.8276 5.7525 19.5801
4 C08 Calcium channel blockers 15.9410 3.4243 19.3653
5 C03 Diuretics 11.7771 2.8941 14.6712
6 R03 Drugs for obstructive airway diseases 9.4693 2.2664 11.7356
7 C10 Lipid modifying agents 5.5117 4.9109 10.4226
8 M01 Anti-inflammatory and antirheumatic products 3.9514 6.0216 9.9729
9 R06 Antihistamines for systemic use 4.4889 5.4258 9.9147
10 B01 Antithrombotic agents 6.0229 3.5854 9.6084
11 J01 Antibacterials for systemic use 3.8151 5.1231 8.9383
12 G03 Sex hormones and modulators of the genital system 2.4879 3.8736 6.3615
13 A02 Drugs for acid related disorders 2.5007 2.6584 5.1590
14 C01 Cardiac therapy 2.7982 1.8947 4.6928
15 H02 Corticosteroids for systemic use 1.9061 2.5400 4.4461
16 N05 Psycholeptics 3.0499 0.9971 4.0470
17 C02 Antihypertensives 2.9987 0.2328 3.2315
18 R01 Nasal preparations 1.1736 1.9592 3.1327
19 A03 Drugs for functional gastrointestinal disorders 0.6813 1.6295 2.3107
20 H03 Thyroid therapy 1.4491 0.5443 1.9934
21 M04 Antigout preparations 1.0294 0.5053 1.5347
22 N03 Antiepileptics 1.3455 0.1569 1.5024
23 N06 Psychoanaleptics 0.8927 0.4193 1.3120
24 S01 Ophthalmologicals 1.0590 0.1936 1.2525
25 J04 Antimycobacterials 0.9993 0.1023 1.1015
26 N07 Other nervous system drugs 0.4346 0.6062 1.0408
27 N04 Antiparkinson drugs 0.8279 0.0524 0.8803
28 G04 Urologicals 0.4062 0.3194 0.7256
29 A08 Antiobesity preparations, excl. diet products 0.0162 0.7057 0.7218
30 R05 Cough and cold preparations 0.0040 0.6973 0.7013
MALAYSIAN STATISTICS ON MEDICINES 2007
Table 1.3 : Top 40 Drugs by Utilisation in DDD/1000 population/day 2007
Rank ATC Drug Public Private Total
1 A10B A02 Metformin 11.9242 2.3571 14.2813
2 A10B B01 Glibenclamide 11.0430 1.7243 12.7674
3 C07A B03 Atenolol 9.4592 3.2072 12.6665
4 C07A B02 Metoprolol 11.4304 0.6546 12.0850
5 C08C A05 Nifedipine 10.6460 0.8164 11.4624
6 C08C A01 Amlodipine 6.4459 2.4894 8.9352
7 C09A A04 Perindopril 6.9654 1.0012 7.9666
8 A10B B09 Gliclazide 5.6189 1.5451 7.1640
9 B01A C06 Acetylsalicylic acid 4.7791 2.1267 6.9059
10 C09A A02 Enalapril 4.7359 1.3831 6.1190
11 C03A A04 Chlorothiazide 5.7074 0.0463 5.7537
12 R03A C02 Salbutamol 4.9464 0.7211 5.6675
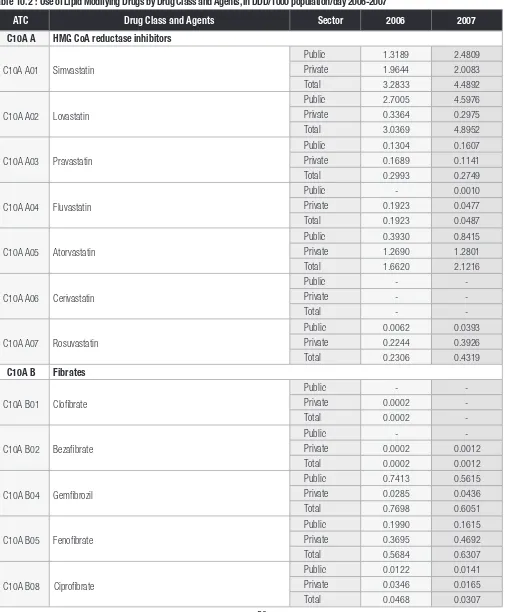
13 C10A A02 Lovastatin 4.5976 0.2975 4.8952
14 C03C A01 Furosemide 3.9743 0.7494 4.7237
15 C09A A01 Captopril 4.4033 0.1485 4.5518
16 C10A A01 Simvastatin 2.4809 2.0083 4.4892
17 R06A B04 Chlorphenamine 2.6324 1.4110 4.0434
18 M01A B05 Diclofenac 1.1058 2.9248 4.0306
19 M01A G01 Mefenamic acid 1.4147 2.0612 3.4759
20 H02A B06 Prednisolone 1.1353 2.2221 3.3575
21 G03A A07 Levonorgestrel and oestrogen 1.3678 1.2585 2.6263
22 J01C A04 Amoxicillin 0.7373 1.7944 2.5317
23 C02C A01 Prazosin 2.2924 0.0682 2.3606
24 R06A X13 Loratadine 0.8946 1.4514 2.3460
25 R06A E07 Cetirizine 0.3330 1.9108 2.2438
26 R01B A52 Pseudoephedrine, combinations 0.4270 1.8116 2.2387
27 C10A A05 Atorvastatin 0.8415 1.2801 2.1216
28 C08C A02 Felodipine 1.5870 0.4541 2.0411
29 C01E B15 Trimetazidine 1.1144 0.7084 1.8229
30 A02B A02 Ranitidine 1.1472 0.6463 1.7936
31 A02B C01 Omeprazole 0.8518 0.9395 1.7913
32 R03D A04 Theophylline 1.0632 0.4774 1.5407
33 M04A A01 Allopurinol 1.0825 0.4317 1.5142
34 A10A D01 Insulins and analogues, intermediate-acting combined with fast-acting (human) 1.2479 0.1608 1.4087
35 C01D A08 Isosorbide dinitrate 1.2206 0.0991 1.3197
36 C03E A01 Hydrochlorothiazide and potassium-sparing agents 0.8510 0.4501 1.3011
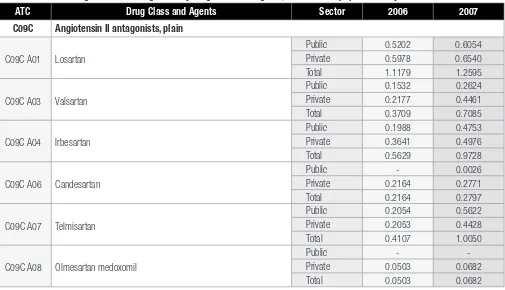
37 C09C A01 Losartan 0.6054 0.6540 1.2595
38 R03B A02 Budesonide 1.0263 0.1722 1.1984
39 G03A A09 Desogestrel and oestrogen 0.4085 0.7718 1.1802
40 R03C C02 Salbutamol 0.6723 0.5031 1.1754