Full Terms & Conditions of access and use can be found at
http://www.tandfonline.com/action/journalInformation?journalCode=cbie20
Download by: [Universitas Maritim Raja Ali Haji] Date: 18 January 2016, At: 19:40
Bulletin of Indonesian Economic Studies
ISSN: 0007-4918 (Print) 1472-7234 (Online) Journal homepage: http://www.tandfonline.com/loi/cbie20
Survey of recent developments
Budy P. Resosudarmo & Arief A. Yusuf
To cite this article: Budy P. Resosudarmo & Arief A. Yusuf (2009) Survey of recent developments, Bulletin of Indonesian Economic Studies, 45:3, 287-315, DOI: 10.1080/00074910903301639
To link to this article: http://dx.doi.org/10.1080/00074910903301639
Published online: 16 Nov 2009.
Submit your article to this journal
Article views: 181
View related articles
ISSN 0007-4918 print/ISSN 1472-7234 online/09/030287-29 © 2009 Indonesia Project ANU DOI: 10.1080/00074910903301639
SURVEY OF RECENT DEVELOPMENTS
Budy P. Resosudarmo* Arief A. Yusuf*
Australian National University Padjadjaran University, Bandung
SUMMARY
Indonesia has so far suffered a relatively mild impact from the global fi nancial
crisis. Its economy grew at 4% in the year to June 2009, displaying a more resilient response than some of its neighbours. Fiscal stimulus measures, deft monetary policy and cash transfers to the poor served to soften the impact of the crisis. Par-liamentary elections in April and presidential elections in July provided further economic stimulus. Election-related spending and the stimulus measures helped maintain formal sector employment levels and the proportion of casual employees in the workforce. Like the cash transfers, payments by parliamentary candidates to voters contributed to household incomes, particularly among the poor. This is refl ected in widespread declines in poverty observed in 2009. The crisis, the
stimu-lus package, the direct cash transfers and the election campaign spending com-bined to create a mechanism of income redistribution in favour of the poor.
On 20 October Susilo Bambang Yudhoyono and Boediono were inaugurated as president and vice president for 2009–14. They announced key economic targets for 2014, including 7% economic growth, 5–6% unemployment and an 8–10% poverty level. It is crucial that the two leaders tackle important reforms – even politically sensitive ones – that will remove obstacles to faster and more employment-friendly growth. However, the plan for their fi rst 100 days focuses on a series of small,
polit-ically non-sensitive reforms designed to demonstrate their commitment to, and create momentum for, wider reform. This strategy is unlikely to create an impres-sion that the government is serious about more substantial and essential reforms. Nor is it likely to generate the economic impact necessary to bring the economy closer to the government’s key economic targets.
The slow expansion of infrastructure since the 1997–98 crisis is a major obstacle to future high and sustained economic growth. Despite some signs of improvement in recent years, Indonesia’s rate of infrastructure investment remains far below pre-crisis levels. Tackling this problem should be a high priority for the government.
While pursuing ways to grow faster, Indonesia – one of the world’s largest CO2 emitters – needs to respond more vigorously to climate change. The leaders have pledged to place climate change mitigation high on their policy agenda. Yet little has been said about how, as one of the countries most vulnerable to climate change, Indonesia should support her people’s adaptation to its effects. The government needs to give high priority to adaptation and promote it at the international level.
* The authors thank Ditya A. Nurdianto and Abdurohman for their assistance with data collection.
THE ECONOMY AND THE MAJOR EVENTS OF 2009
Four major events captured the attention of the media during 2009: the global
fi nancial crisis (GFC), the legislative and presidential elections, the bombing of
two luxury hotels in Jakarta, and an earthquake in Padang. Each had the potential to affect the economy signifi cantly. As it turned out, the economy proved resilient
in the face of all of these events. The impact of the GFC began to be felt in Indo-nesia from mid-2008, and was still evident at the time of writing. However, the effects of the crisis on Indonesia have been relatively mild.
Election campaigning commenced in July 2008, and campaign activity
intensi-fi ed noticeably from the end of 2008. The legislative and presidential elections were
held on 9 April and 8 July, respectively, and both were largely free of signifi cant
dis-turbance. To the extent that they affected the economy, the impact was stimulatory, partly as a consequence of heavy spending by both the General Elections Commis-sion (Komisi Pemilihan Umum, KPU) and the political parties, and partly because of the calming impact of the re-election of a popular incumbent president.
The twin suicide bombings of the Marriott and Ritz–Carlton hotels in Jakarta occurred on 17 July, little more than a week after the presidential election. After several years with no major terrorist activity, the bombings shocked those who had come to believe that the authorities had dealt successfully with the terrorist threat. Nine people were killed and more than 50 injured in the blast (Tempointer-aktif, 18 July 2009). The police were able to identify a number of suspects rela-tively quickly, and to capture or kill several of them within the next few months. Although the bombings generated a great deal of media coverage in the following days, they had very little economic impact. The number of tourists entering the country in July and August 2009 was not noticeably affected, nor was the stock market. Nevertheless there is cause for concern that foreign investors might re-evaluate the risks involved in doing business in Indonesia, and perhaps decide to stay away for several more years.
On the evening of 30 September, an earthquake measuring 7.6 on the Richter scale devastated the city of Padang, the capital of West Sumatra province, and surrounding areas, causing widespread loss of life and property. By mid-October it was reported that the death toll had reached approximately 1,100 people, while around 3,000 others had been injured. At least 135,000 houses were heavily dam-aged, and a further 150,000 suffered medium or mild damage (Tempointeraktif, 14 October 2009). Various local organisations quickly came to Padang to provide support. When President Susilo Bambang Yudhoyono (SBY) gave the green light for foreign assistance the day after the earthquake, various international organi-sations rushed to the city to add to the relief effort. The cost of reconstructing Padang and smaller towns and villages nearby will be considerable, and there will be a signifi cant impact on the local economy. But as was the case with the Aceh
tsunami in 2004 and the Yogyakarta earthquake in 2006, the effects of Padang’s earthquake on the national economy will be slight.
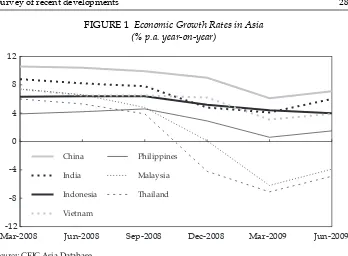
Previous surveys (Gunawan and Siregar 2009; Kuncoro, Widodo and McLeod 2009) have argued that the impact of the GFC on the national economy has been relatively modest. Figure 1 confi rms that the decline in Indonesia’s growth rate
was less severe than that of several other Asian economies. The GDP data for the second quarter (Q2) of 2009 reveal, however, that Indonesia’s growth continued to decelerate, albeit slightly, while every other economy shown in fi gure 1 managed
to reverse the decline in its growth rate. Indonesia’s growth nevertheless remained positive, and well above that of Thailand, Malaysia and the Philippines.
A number of explanations for the relatively mild impact of the GFC have been suggested.1 The fi rst draws attention to the structure of the Indonesian economy,
and the fact that it is less closely connected to the global economy than those of neighbouring countries, particularly Singapore. Only about 17% of Indonesian output is exported, so the downturn in the US and other major economies has not had a strong impact on Indonesia. In addition, approximately 30% of the labour force is found in the agricultural sector, which is less affected than other sectors by the business cycle.
A second explanation focuses on the favourable impact of government and central bank policy responses. Since October 2008 the government has introduced a number of regulations aimed at protecting the fi nancial system from a
poten-tial crisis, and monetary policies have been prudent. A fi scal stimulus package
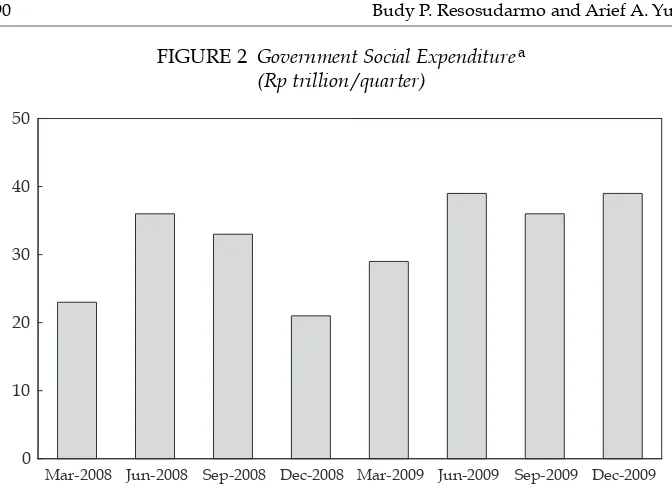
amounting to Rp 71.3 trillion was introduced early in 2009. Most of the stimulus was in the form of tax cuts and subsidies intended to increase spending by the private sector, complemented by an additional Rp 12.8 trillion (originally Rp 10.8 trillion) of government spending, mainly on infrastructure (Gunawan and Siregar 2009; Kuncoro, Widodo and McLeod 2009). The government also expanded its ‘social expenditures’ rapidly in the fi rst two quarters of 2009 (fi gure 2).2 Another
1 The discussion here is based on a presentation by Hal Hill on ‘Southeast Asia and the global fi nancial crisis’ at the Australian National University on 14 October 2009.
2 Social expenditure is described as ‘all spending on transfers, in cash or in kind, to mem-bers of the population in order to protect them from social risks’ (Government Regulation No. 21/2004). It consists of social compensation assistance, social assistance to educational and religious institutions, and other social expenditure.
FIGURE 1 Economic Growth Rates in Asia (% p.a. year-on-year)
Mar-2008 Jun-2008 Sep-2008 Dec-2008 Mar-2009 Jun-2009 -12
-8 -4 0 4 8 12
China
India
Indonesia
Vietnam
Philippines
Malaysia
Thailand
Source: CEIC Asia Database.
important policy was to provide to direct cash transfers (bantuan langsung tunai, BLT) to the poor in January and February 2009, amounting to Rp 3.8 trillion. On previous occasions these transfers were intended to compensate the poor for increases in prices following reductions in fuel subsidies, but this time they were used to soften the impact of the GFC on the poor (Kompas, 3 August 2009).
A third explanation for the resilience of the economy in the face of the GFC is the stimulatory impact of the elections. Election-related spending by the gov-ernment, as well as that by the political parties and the candidates themselves, seems likely to have boosted consumption expenditure. The total budget for the KPU was approximately Rp 47.9 trillion, of which about Rp 18.6 trillion was included in the 2008 budget and Rp 29.3 trillion in the 2009 budget. Informa-tion on the amounts actually spent was unavailable at the time of writing, but it seems likely that the bulk of this allocation would have been spent by the end of July 2009. In rough terms, it could be said that the government spent about Rp 50 trillion on the elections over a period of about one year; this may be compared with total government expenditure of the order of Rp 1,000 trillion in 2008. In other words, paying for the election would appear to have boosted government spending by about 5%, assuming other expenditure was not cut back to accommodate this.
The amount of campaign spending by individual candidates and political par-ties can only be very roughly estimated – much less its macroeconomic impact. Anecdotal evidence suggests that the level of spending in support of individual candidates for election to the national parliament was anywhere between a few million and 5 billion rupiah, and there were more than 11,000 candidates compet-ing for the 560 available seats (Kompas, 31 October 2008). If each candidate spent,
FIGURE 2 Government Social Expenditurea
(Rp trillion /quarter)
Mar-2008 Jun-2008 Sep-2008 Dec-2008 Mar-2009 Jun-2009 Sep-2009 Dec-2009
0 10 20 30 40 50
a Amounts for the September and December quarters in 2009 are projections.
Source: Agency for Fiscal Policy, Ministry of Finance.
say, Rp 500 million, then the total of such spending would have been about Rp 5.5 trillion. In addition, more than 110,000 candidates competed for approximately 1,200 seats at the provincial level and approximately 1.5 million candidates for about 15,700 seats at the district and municipality levels.3 Though they did not
spend as much on average as candidates at the national level, collectively the amount spent in these campaigns would have been enormous. It is diffi cult to
know the extent to which this would have been a net addition to private sector spending, however. On the one hand, individuals and fi rms may have sacrifi ced
other spending to contribute to election campaigns. On the other, they may have cut back their normal spending because of concerns about the GFC, in which case campaign spending would have tended to offset this.
We take the view that this election-related spending, particularly in Q1 2009, softened the impact of the GFC on households and, together with the stimulus package and direct cash transfers, even helped to raise the incomes of the poor. The latter benefi ted directly or indirectly from the provision of goods and
serv-ices for various election campaign activities, as well as from direct cash payments made to individuals who participated in campaign activities in the hope of secur-ing their votes.
Whatever the impact of the elections on macroeconomic performance in the fi rst
half of 2009, the debate more recently has been about whether the economy has been recovering from the impact of the GFC since mid-2009. Export performance and the resumption of foreign portfolio investment – plus the fact that other Asian economies are beginning to bounce back – have led many to argue that Indonesia has indeed been on the path of recovery (World Bank 2009a; Gunawan and Arman 2009). Others, including the present authors, take the more conservative position that, while the impact of the GFC on Indonesia seems to have peaked, consider-able uncertainty remains. Data for the fourth quarter will be needed to confi rm
whether the economy has been on the path of recovery in the second half.
Economic growth and the sectoral outlook
The rate of quarterly year-on-year GDP growth continued its moderate decline, to 4% in Q2 2009 (table 1a). The main expenditure category contributing to this out-come was government consumption, which recorded double-digit growth rates for the four quarters through Q2 2009. Private consumption was also important, growing at a reasonably healthy 4.8% in the year to Q2 2009, down from a peak of 6% in the fi rst quarter. This may be an indication that campaign spending for the
presidential election had a smaller impact on households than that for the legisla-tive election.
The most alarming sign is the decline in the growth of investment spending, which was only 2.7% in Q2 2009 compared with 12.0% a year earlier. Within this category, growth of construction spending remained healthy; but growth of investment in machinery and equipment turned strongly negative, and that in transport fell sharply from around 40% in the second half of 2008. This does not augur well for the future growth of various sectors, particularly manufac-turing. Two factors in particular probably played an important role in inhibiting
3 There were also about 1,000 candidates competing for 132 seats in the Regional Repre-sentative Council (Dewan Perwakilan Daerah, DPD) in Jakarta.
investment: the reduced availability of funding world-wide as a consequence of the GFC; and the adoption of a wait-and-see approach in relation to the elections (Bank Indonesia 2009).
Turning to GDP growth by sector, we see that non-tradables have continued to grow far more rapidly than tradables, but also that the growth rates of both have declined markedly from their levels in mid-2008. The manufacturing sec-tor continues to be of signifi cant concern, growing by only 1.8% in the year to
Q2 2009 (if petroleum and gas manufacturing are excluded). Most manufactur-ing sub-sectors contracted in the year to Q2 2009, except for food, beverages and tobacco (16.8%), paper and printing (3.9%) and fertilisers, chemicals and rubber (2.8%). Growth of the food, beverage and tobacco sub-sector has been high since Q4 2008, refl ecting the increase in household incomes caused by election
cam-paign spending. Camcam-paign activities also generated demand for products of the textiles, leather products and footwear sub-sector, but export demand fell at the same time. Since around 45% of the output of this sub-sector was exported before the GFC, its recent growth has been relatively low. The paper and printing sub-sector contracted in 2008 but then began to expand in Q1 2009 – probably because of increased use of its products for the election.
The mining sector grew somewhat more rapidly than in 2008, though much more slowly than the economy as a whole. Its expansion mainly refl ected increased
activity in Eastern Indonesia – not so much in coal production in Kalimantan, as many observers had expected, but more as a consequence of the recovery of Free-port’s operations in Papua from a low level in the previous year (Reuters, 21 July 2009).
All components of the non-tradables sector exhibited healthy growth in the year to Q2 2009, with the exception of trade, hotels and restaurants. The com-munications sector continued to grow at high double-digit rates, driven for sev-eral years by the increasing popularity of mobile phones. Utilities have also been growing rapidly, mainly because of the expansion of city gas supply networks as the government tries to encourage households to switch to this fuel.4 Whether this
rapid expansion can be sustained is open to doubt, however. It is not clear that the price paid by households is suffi cient to cover the full cost of supply,
suggest-ing that the gas company (Perusahaan Gas Negara, PGN) will continue to rely on subsidies, as is the case with the electricity supplier (Perusahaan Listrik Negara, PLN). Eventually the government is likely to become unwilling to fund increases in this subsidy, making continued expansion diffi cult.
Growth of the trade, hotels and restaurants sector has declined signifi cantly
over the last three quarters, becoming slightly negative in Q2 2009. This has largely been the result of negative growth in wholesale and retail trade. The hotels sub-sector expanded quite slowly in the year to Q2 2009 (2.8%), but restaurants output grew rapidly (by 9.9%), probably as a consequence of the elections. The transport sector rebounded strongly from negative growth in the latter half of 2008 to reach 6.4% in Q2 2009, owing mainly to a resurgence in air transport.
As argued in the previous survey, focusing on year-on-year growth rates at a time when both external and internal circumstances have the potential to cause
4 For example, the government allocated approximately Rp 100 billion to expansion of the gas distribution networks in Palembang and Surabaya (Kompas, 5 June 2009).
rapid deterioration in the economy runs the risk of failing to notice signifi cant
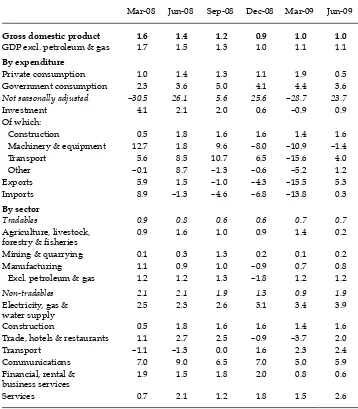
changes in performance. Table 1b therefore presents quarter-on-quarter growth rates, adjusted for seasonality. On this basis, we can see that private consump-tion surged in Q1 2009 but then fell back to a surprisingly low level in the sec-ond quarter. The reverse is true for government consumption (not seasonally adjusted), which has exhibited extraordinarily high volatility. As predicted by Kuncoro, Widodo and McLeod (2009: 159), the huge decline in the fi rst quarter
was followed by an increase almost as large in the second, providing a consider-able stimulus to the economy.
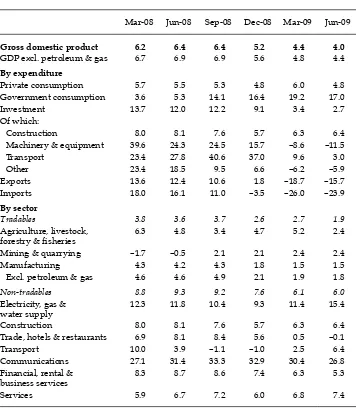
TABLE 1a Components of GDP Growth (2000 prices; % year on year)
Mar-08 Jun-08 Sep-08 Dec-08 Mar-09 Jun-09
Gross domestic product 6.2 6.4 6.4 5.2 4.4 4.0 GDP excl. petroleum & gas 6.7 6.9 6.9 5.6 4.8 4.4 By expenditure
Private consumption 5.7 5.5 5.3 4.8 6.0 4.8
Government consumption 3.6 5.3 14.1 16.4 19.2 17.0
Investment 13.7 12.0 12.2 9.1 3.4 2.7
Of which:
Construction 8.0 8.1 7.6 5.7 6.3 6.4
Machinery & equipment 39.6 24.3 24.5 15.7 –8.6 –11.5
Transport 23.4 27.8 40.6 37.0 9.6 3.0
Other 23.4 18.5 9.5 6.6 –6.2 –5.9
Exports 13.6 12.4 10.6 1.8 –18.7 –15.7
Imports 18.0 16.1 11.0 –3.5 –26.0 –23.9
By sector
Tradables 3.8 3.6 3.7 2.6 2.7 1.9
Agriculture, livestock, forestry & fi sheries
6.3 4.8 3.4 4.7 5.2 2.4
Mining & quarrying –1.7 –0.5 2.1 2.1 2.4 2.4
Manufacturing 4.3 4.2 4.3 1.8 1.5 1.5
Excl. petroleum & gas 4.6 4.6 4.9 2.1 1.9 1.8
Non-tradables 8.8 9.3 9.2 7.6 6.1 6.0
Electricity, gas & water supply
12.3 11.8 10.4 9.3 11.4 15.4
Construction 8.0 8.1 7.6 5.7 6.3 6.4
Trade, hotels & restaurants 6.9 8.1 8.4 5.6 0.5 –0.1
Transport 10.0 3.9 –1.1 –1.0 2.5 6.4
Communications 27.1 31.4 33.3 32.9 30.4 26.8
Financial, rental & business services
8.3 8.7 8.6 7.4 6.3 5.3
Services 5.9 6.7 7.2 6.0 6.8 7.4
Source: CEIC Asia Database.
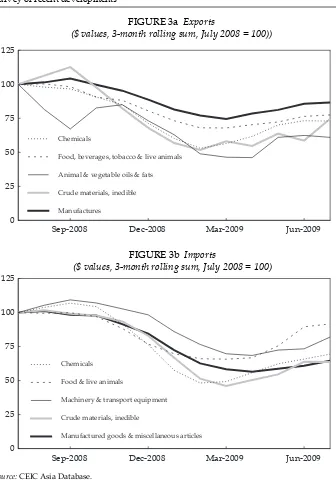
The quarterly fi gures show an improvement in all categories of investment
spending growth in the second quarter, providing some additional support to those who argue that the economy is already recovering from the impact of the GFC. Further evidence of this can be seen in the return to positive growth of both exports and imports in Q2 2009, and from inspection of the merchandise trade data. Figures 3a and 3b present monthly data for the major categories of exports and imports, converted to three-month rolling sums, and expressed in index form. There is a clear general pattern of decline starting from the fourth quarter of
TABLE 1b Components of GDP Growth (2000 prices; seasonally adjusted; % quarter on quarter)
Mar-08 Jun-08 Sep-08 Dec-08 Mar-09 Jun-09
Gross domestic product 1.6 1.4 1.2 0.9 1.0 1.0 GDP excl. petroleum & gas 1.7 1.5 1.3 1.0 1.1 1.1 By expenditure
Private consumption 1.0 1.4 1.3 1.1 1.9 0.5
Government consumption 2.3 3.6 5.0 4.1 4.4 3.6
Not seasonally adjusted –30.5 26.1 5.6 25.6 –28.7 23.7
Investment 4.1 2.1 2.0 0.6 –0.9 0.9
Of which:
Construction 0.5 1.8 1.6 1.6 1.4 1.6
Machinery & equipment 12.7 1.8 9.6 –8.0 –10.9 –1.4
Transport 5.6 8.5 10.7 6.5 –15.6 4.0
Other –0.1 8.7 –1.3 –0.6 –5.2 1.2
Exports 5.9 1.5 –1.0 –4.3 –15.5 5.3
Imports 8.9 –1.3 –4.6 –6.8 –13.8 0.3
By sector
Tradables 0.9 0.8 0.6 0.6 0.7 0.7
Agriculture, livestock, forestry & fi sheries
0.9 1.6 1.0 0.9 1.4 0.2
Mining & quarrying 0.1 0.3 1.3 0.2 0.1 0.2
Manufacturing 1.1 0.9 1.0 –0.9 0.7 0.8
Excl. petroleum & gas 1.2 1.2 1.3 –1.8 1.2 1.2
Non-tradables 2.1 2.1 1.9 1.3 0.9 1.9
Electricity, gas & water supply
2.5 2.3 2.6 3.1 3.4 3.9
Construction 0.5 1.8 1.6 1.6 1.4 1.6
Trade, hotels & restaurants 1.1 2.7 2.5 –0.9 –3.7 2.0
Transport –1.1 –1.3 0.0 1.6 2.3 2.4
Communications 7.0 9.0 6.5 7.0 5.0 5.9
Financial, rental & business services
1.9 1.5 1.8 2.0 0.8 0.6
Services 0.7 2.1 1.2 1.8 1.5 2.6
Source: CEIC Asia Database.
2008 and running through to about April 2009, with a signifi cant and widespread
recovery subsequently. Although absolute levels remain well below their previ-ous peaks, and continuation of the recent trend cannot be guaranteed, the outlook here provides some grounds for optimism.
Returning to the national income accounts data in table 1b, we also fi nd grounds
for optimism in the evidence that manufacturing (excluding petroleum and gas) grew more rapidly than the economy as a whole in the fi rst two quarters of 2009.
Likewise, the trade, hotels and restaurants sector bounced back in the second FIGURE 3a Exports
($ values, 3-month rolling sum, July 2008 = 100))
Sep-2008 Dec-2008 Mar-2009 Jun-2009 0
25 50 75 100 125
Manufactures
Crude materials, inedible Animal & vegetable oils & fats Food, beverages, tobacco & live animals Chemicals
FIGURE 3b Imports
($ values, 3-month rolling sum, July 2008 = 100)
Sep-2008 Dec-2008 Mar-2009 Jun-2009 0
25 50 75 100 125
Manufactured goods & miscellaneous articles Crude materials, inedible
Machinery & transport equipment Food & live animals
Chemicals
Source: CEIC Asia Database.
quarter from a signifi cant decline in the fi rst. In short, on the basis of the most
recent quarterly and monthly data, the near-term future of the economy seems promising. Nevertheless, we caution that it is too soon to be sure that these new trends can be sustained.
Regional growth
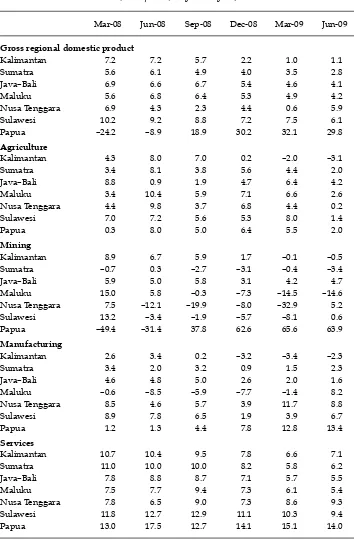
Since the sectoral composition of output differs widely across the regions of Indo-nesia, it is of interest to look at economic performance from a regional perspective. The impact of the GFC has been felt more strongly in Kalimantan and Sumatra than in other regions. To illustrate this, we focus on growth data for the three quarters to Q2 2009 in table 2. Of the seven regions shown, Papua has recorded extraordi-narily rapid growth, driven largely by an astonishing expansion of output from the dominant mining sector, but also by signifi cant growth of manufacturing and
services. For the small and less advanced Maluku and Nusa Tenggara regions, the impact of the GFC seems to have been relatively modest, with the former record-ing growth of 5.9% in the year to Q2 2009 and the latter 4.2%. Beyond these brief observations, the following discussion focuses primarily on the four remaining large regions: Kalimantan, Sumatra, Java–Bali and Sulawesi.
The poorest performing region most recently has been Kalimantan, whose gross regional domestic product (GRDP) growth rate fell to 1.1% in the year to June 2009, from 7.2% a year earlier. Sumatra too seems to have suffered signifi cantly, with
a decline to 2.8%, from 6.1% a year before. Sulawesi’s growth rate has declined, although from a high level in 2008. Refl ecting its dominance in the economy,
growth in Java–Bali has declined to roughly the rate for Indonesia as a whole. As was the case for non-tradables growth nationally, services growth in the regions has been much more rapid than growth of agriculture, mining and manufacturing: in all regions other than Papua, services continued to grow considerably faster than GRDP. The growth of agricultural output fell to quite low levels in Q2 2009, and became strongly negative in Kalimantan – mainly because of negative growth of the forestry sub-sector, which is facing a decline in forest stocks. In the case of Sumatra, both the food crop and forestry sub-sectors held back agriculture as a whole. The slow growth of food crop output was probably not due to the GFC, but simply refl ected unusually high output levels in the previous
year; that is, the slowdown in the last three quarters was merely a movement back toward the long-term average growth rate.
There are wide differences in the growth of mining across major regions. Mining output has been declining in Sumatra for some time, and even more rapidly in Sulawesi, although Q2 2009 saw a return to expansion in the latter. In Sumatra, the negative growth was attributable mainly to declining gas production in Aceh as the reserves there become depleted (World Bank 2009b: 1). In Kalimantan, the decline in growth over the last three quarters refl ected a fall in the performance
of the non-oil and gas mining sector, probably due to reduced demand for coal during the GFC.
Manufacturing has been declining signifi cantly in Kalimantan for the last three
quarters, refl ecting negative growth of the wood-based industries (excluding
pulp and paper) and of oil and gas refi ning. The wood-based industries have been
affected by the declining availability of good-quality wood from Kalimantan’s forests, while refi nery output has fallen in response to a slowing of domestic
TABLE 2 Regional Economic Growth (2000 prices, % year on year)
Mar-08 Jun-08 Sep-08 Dec-08 Mar-09 Jun-09
Gross regional domestic product
Kalimantan 7.2 7.2 5.7 2.2 1.0 1.1
Sumatra 5.6 6.1 4.9 4.0 3.5 2.8
Java–Bali 6.9 6.6 6.7 5.4 4.6 4.1
Maluku 5.6 6.8 6.4 5.3 4.9 4.2
Nusa Tenggara 6.9 4.3 2.3 4.4 0.6 5.9
Sulawesi 10.2 9.2 8.8 7.2 7.5 6.1
Papua –24.2 –8.9 18.9 30.2 32.1 29.8
Agriculture
Kalimantan 4.3 8.0 7.0 0.2 –2.0 –3.1
Sumatra 3.4 8.1 3.8 5.6 4.4 2.0
Java–Bali 8.8 0.9 1.9 4.7 6.4 4.2
Maluku 3.4 10.4 5.9 7.1 6.6 2.6
Nusa Tenggara 4.4 9.8 3.7 6.8 4.4 0.2
Sulawesi 7.0 7.2 5.6 5.3 8.0 1.4
Papua 0.3 8.0 5.0 6.4 5.5 2.0
Mining
Kalimantan 8.9 6.7 5.9 1.7 –0.1 –0.5
Sumatra –0.7 0.3 –2.7 –3.1 –0.4 –3.4
Java–Bali 5.9 5.0 5.8 3.1 4.2 4.7
Maluku 15.0 5.8 –0.3 –7.3 –14.5 –14.6
Nusa Tenggara 7.5 –12.1 –19.9 –8.0 –32.9 5.2
Sulawesi 13.2 –3.4 –1.9 –5.7 –8.1 0.6
Papua –49.4 –31.4 37.8 62.6 65.6 63.9
Manufacturing
Kalimantan 2.6 3.4 0.2 –3.2 –3.4 –2.3
Sumatra 3.4 2.0 3.2 0.9 1.5 2.3
Java–Bali 4.6 4.8 5.0 2.6 2.0 1.6
Maluku –0.6 –8.5 –5.9 –7.7 –1.4 8.2
Nusa Tenggara 8.5 4.6 5.7 3.9 11.7 8.8
Sulawesi 8.9 7.8 6.5 1.9 3.9 6.7
Papua 1.2 1.3 4.4 7.8 12.8 13.4
Services
Kalimantan 10.7 10.4 9.5 7.8 6.6 7.1
Sumatra 11.0 10.0 10.0 8.2 5.8 6.2
Java–Bali 7.8 8.8 8.7 7.1 5.7 5.5
Maluku 7.5 7.7 9.4 7.3 6.1 5.4
Nusa Tenggara 7.8 6.5 9.0 7.3 8.6 9.3
Sulawesi 11.8 12.7 12.9 11.1 10.3 9.4
Papua 13.0 17.5 12.7 14.1 15.1 14.0
Source: Data kindly supplied by the central statistics agency (Badan Pusat Statistik, BPS).
and international demand. The growth rate of manufacturing has also slowed in Java–Bali during the same period, and this has been a major contributor to its low growth overall. The disappointing performance of the manufacturing sector in Java and Sumatra was probably caused by a fall in export demand in response to the GFC. Increased domestic consumption during the election campaigns period was not suffi cient to offset the impact of the downturn in the global economy. On
the other hand, Sumatra’s manufacturing does not seem to have been signifi cantly
affected by the GFC, and the growth of manufacturing output has accelerated to quite a high level in Sulawesi.
Balance of payments, capital market and exchange rate
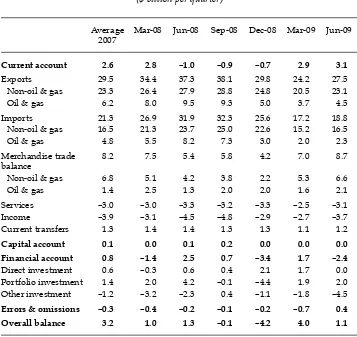
One cause for optimism that the economy is already on the path of recovery is the balance of payments (table 3). After three quarters of small defi cits, the current
account returned to a sizeable surplus in the fi rst two quarters of 2009. Although
exports remain well below their levels during most of 2008, the decline in average TABLE 3 Balance of Payments
($ billion per quarter)
Average 2007
Mar-08 Jun-08 Sep-08 Dec-08 Mar-09 Jun-09
Current account 2.6 2.8 –1.0 –0.9 –0.7 2.9 3.1
Exports 29.5 34.4 37.3 38.1 29.8 24.2 27.5
Non-oil & gas 23.3 26.4 27.9 28.8 24.8 20.5 23.1
Oil & gas 6.2 8.0 9.5 9.3 5.0 3.7 4.5
Imports 21.3 26.9 31.9 32.3 25.6 17.2 18.8
Non-oil & gas 16.5 21.3 23.7 25.0 22.6 15.2 16.5
Oil & gas 4.8 5.5 8.2 7.3 3.0 2.0 2.3
Merchandise trade balance
8.2 7.5 5.4 5.8 4.2 7.0 8.7
Non-oil & gas 6.8 5.1 4.2 3.8 2.2 5.3 6.6
Oil & gas 1.4 2.5 1.3 2.0 2.0 1.6 2.1
Services –3.0 –3.0 –3.3 –3.2 –3.3 –2.5 –3.1
Income –3.9 –3.1 –4.5 –4.8 –2.9 –2.7 –3.7
Current transfers 1.3 1.4 1.4 1.3 1.3 1.1 1.2
Capital account 0.1 0.0 0.1 0.2 0.0 0.0 0.0
Financial account 0.8 –1.4 2.5 0.7 –3.4 1.7 –2.4
Direct investment 0.6 –0.3 0.6 0.4 2.1 1.7 0.0
Portfolio investment 1.4 2.0 4.2 –0.1 –4.4 1.9 2.0
Other investment –1.2 –3.2 –2.3 0.4 –1.1 –1.8 –4.5
Errors & omissions –0.3 –0.4 –0.2 –0.1 –0.2 –0.7 0.4 Overall balance 3.2 1.0 1.3 –0.1 –4.2 4.0 1.1
Source: CEIC Asia Database.
imports in the fi rst half of 2009 has been even greater, such that the merchandise
trade balance has been restored to its 2007 average. The values of oil and gas exports and imports have fl uctuated quite considerably in line with big swings
in world prices, but they have tended to move in the same direction, so the dif-ference between them has been relatively stable. The recent strengthening of the merchandise trade balance is due mainly to the non-oil and gas component: this item was three times as large in Q2 2009 as in the last quarter of 2008. Consider-able volatility is evident in the fi nancial account, with no clear pattern emerging.
Portfolio investment, which turned negative in Q3 2008, and strongly so in the fourth quarter, bounced back in the fi rst half of 2009 to levels closer to those of
2007 and early 2008. Thus the large negative overall balance recorded in Q4 2008 was almost totally reversed in the next quarter.
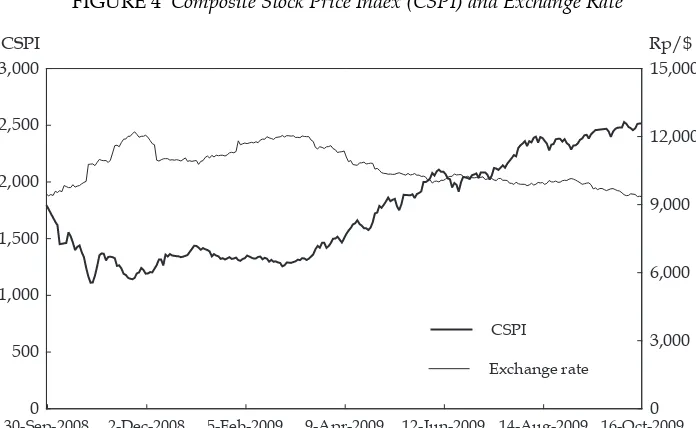
Share prices on the Indonesian Stock Exchange Index have continued the steady climb that began in March 2009 (though at a somewhat slower rate since August), refl ecting investor confi dence in the near-term economic outlook (fi gure 4). The
continuous strengthening of the rupiah during the same period also suggests that investors are willing to restore or increase their exposure to Indonesian assets. Overall, it would appear that the business community is reasonably satisfi ed with
the government’s handling of macroeconomic policy, and with the outcome of the elections. That said, Indonesia’s economic outlook for the near future still remains somewhat uncertain. Foreign direct investment in Q2 2009 was negligible, while other foreign investment became strongly negative. And although the balance of payments is strong, exports are still down somewhat on the levels recorded a year ago. Imports are even more depressed than before the onset of the GFC, although most major categories have been on an upward trend since early in 2009. At best, cautious optimism seems justifi ed.
FIGURE 4 Composite Stock Price Index (CSPI) and Exchange Rate
30-Sep-20080 2-Dec-2008 5-Feb-2009 9-Apr-2009 12-Jun-2009 14-Aug-2009 16-Oct-2009
500 1,000 1,500 2,000 2,500 3,000
0 3,000 6,000 9,000 12,000 15,000
CSPI
Exchange rate
CSPI Rp/$
Source: Indonesia Stock Exchange; Pacifi c Exchange Rate Service.
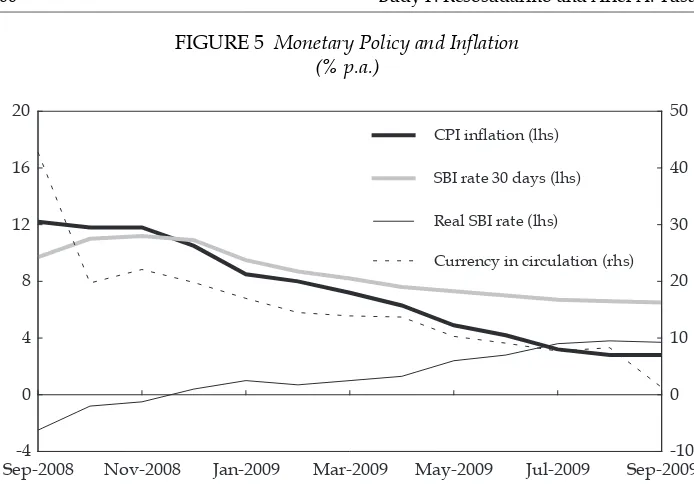
Infl ation
The rate of infl ation of consumer prices has fallen steadily over the last 12 months
from over 12% to below 3% (fi gure 5) for the fi rst time since 2000. Successive
inter-est rate adjustments by Bank Indonesia (BI) have succeeded in gently lowering the rate of growth of the money supply (represented by currency in circulation in fi gure 5), resulting in the expected parallel reduction in infl ation. Until very
recently, infl ation was falling more rapidly than the interest rate on 30-day BI
Certifi cates (SBIs), so the real SBI rate has been rising steadily, peaking at almost
4% p.a. Another consequence of this deft management of monetary policy is the already noted strengthening of the external value of the currency during the same period. Given the sensitivity of the public to rapidly rising prices, SBY would appear to owe a signifi cant debt of gratitude to the central bank for bringing infl
a-tion under control in the lead-up to the presidential eleca-tion.
The interesting question now is how BI will respond to its own success in bringing infl ation down to this low level. On such occasions in the past, it has
succumbed all too readily to the argument that, since infl ation is low, it can afford
to reduce interest rates signifi cantly. The predictable result has been that money
supply growth has accelerated, and the infl ation rate has broken away from its
target range. BI’s skill in managing monetary policy in the face of the threat posed by the GFC over the last year or so provides reason for optimism that this time it will manage its interest rate instrument so as to maintain money growth at about the 8% p.a. level achieved during the third quarter.5 If so, there should be no
diffi culty in holding infl ation below 5% as the incoming government settles in.
5 The sudden downturn in money growth in September 2009 does not represent a change in approach, but rather a spike in the money supply in September 2008.
FIGURE 5 Monetary Policy and Infl ation (% p.a.)
Sep-2008-4 Nov-2008 Jan-2009 Mar-2009 May-2009 Jul-2009 Sep-2009 0
4 8 12 16 20
-10 0 10 20 30 40 50
CPI inflation (lhs)
SBI rate 30 days (lhs)
Real SBI rate (lhs)
Currency in circulation (rhs)
Source: CEIC Asia Database.
Employment, household income and poverty
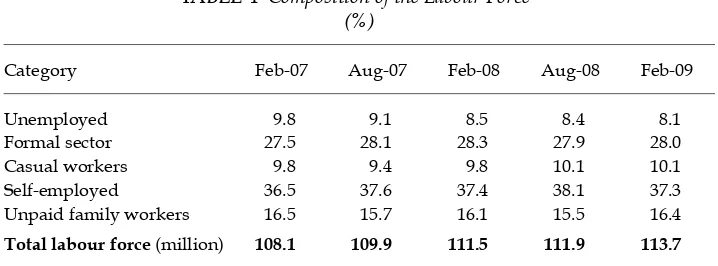
Despite the relatively modest impact of the GFC, economic growth has declined somewhat, while the labour force has continued to grow at about 2% p.a. This has given rise to concern about the impact of the economic slowdown on employment, household income and poverty. Table 4 shows that unemployment continued to decline between August 2008 and February 2009 – the period when the GFC was having its strongest impact on Indonesia – falling from 8.4% to 8.1%. The concern is that if the early signs of recovery turn out to have been misleading and growth begins to decelerate again, it is still possible that the GFC could cause a reversal of this downward trend in unemployment.
Among those working, the proportion employed in the formal sector has been relatively steady since August 2007. It is very surprising that in the six months to February 2009 when the economy – particularly the manufacturing sector – was slowing down, there was no reduction in the proportion of formal sector employees. A possible explanation is that fi rms were already responding to
various tax cuts and incentives in the government’s fi scal stimulus package, since
one eligibility requirement for some of those incentives was that the fi rm should
promote employment – that is, avoid laying off workers.
The proportion of casual workers was also steady in the year to February 2009. Employing casual workers gives employers relative fl exibility, as they can
respond to an economic downturn by offering them fewer working hours per week if necessary. It is possible also that the social infrastructure activities that are part of the stimulus package had begun to have an impact by February 2009 through the creation of casual employment opportunities, although the size of this part of the package was small (less than 1% of the total).
The proportion of self-employed workers fell slightly in the six months to February 2009, returning to its level a year earlier. There was a comparable increase in the proportion of unpaid family workers, which more than offset the small decline in unemployment noted above. This increase perhaps gives some cause for concern,
TABLE 4 Composition of the Labour Forcea
(%)
Category Feb-07 Aug-07 Feb-08 Aug-08 Feb-09
Unemployed 9.8 9.1 8.5 8.4 8.1
Formal sector 27.5 28.1 28.3 27.9 28.0
Casual workers 9.8 9.4 9.8 10.1 10.1
Self-employed 36.5 37.6 37.4 38.1 37.3
Unpaid family workers 16.5 15.7 16.1 15.5 16.4
Total labour force (million) 108.1 109.9 111.5 111.9 113.7
a The formal sector includes permanent, paid employees and their employers; casual workers are non-permanent employees; the self-employed are individuals working for themselves (with or with-out non-permanent employees and/or unpaid family workers); unpaid family workers are those working for a family business without formal pay.
Source: BPS, National Labour Force Survey (Sakernas), 2007, 2008 and 2009.
since becoming an unpaid worker in a family business might be little better than becoming unemployed. Average returns to individuals in family enterprises are likely to be depressed if more family members have to share the fi xed or declining
amount of work available. In turn, this could raise the level of poverty.
At the national level, in both rural and urban areas, real household incomes per capita were higher in March 2009 than a year earlier (table 5). At the regional level, however, this was not the case everywhere. Average incomes declined in urban areas in Nusa Tenggara, and in rural areas in Sulawesi, Maluku and Papua.
We estimated the relationship between the change in household income per capita between 2008 and 2009 and the income level in 2008 (both in 2008 prices), controlling for characteristics of household heads – gender, age and educational attainment – as well as for the size of the household and whether it was in a rural or an urban area. The estimated coeffi cients indicating the change in income
given the initial income are signifi cantly negative at both the national and
sub-national levels (table 5). Thus the lower the income in 2008, the larger the increase in income in the following year. This suggests that the level of poverty may have fallen even in regions where average household incomes declined.
The national poverty fi gure was lower in March 2009 than a year earlier
(table 6): the GFC therefore did not increase the percentage of people living below the poverty line set by the central statistics agency (Badan Pusat Statistik, BPS). At the sub-national level also, poverty fi gures for March 2009 were lower than those
for March 2008 in all regions except Papua, where an increase in poverty in rural areas more than offset a further decline in the already low level of urban poverty.
Based on the above observations of the dynamics of the labour market, household incomes and poverty, we propose the following interpretation. The
TABLE 5 Household Income per Capitaa
(Rp ‘000, 2008 prices)
Income per Capita Ratio of
Change in Income
to Initial Income
Urban Rural
Mar-08 Mar-09 Mar-08 Mar-09
Sumatra 557 558 356 357 –0.50***
Java–Bali 531 543 279 294 –0.46***
Nusa Tenggara 414 405 245 253 –0.36***
Kalimantan 643 697 365 376 –0.30***
Sulawesi 498 510 278 275 –0.41***
Maluku 564 591 321 313 –0.39***
Papua 703 707 327 315 –0.69***
Indonesia 538 550 302 311 –0.44***
a This table is built from the 2008 and 2009 Susenas panel data. Income is proxied by total monthly household expenditure per capita in 2008 prices. Estimation was by ordinary least squares regression. *** indicates that the coeffi cients are signifi cantly different from zero at the 99% confi dence level.
Source: BPS, National Socio-Economic Survey (Susenas), panel data for 2008 and 2009.
stimulus measures, particularly the tax cuts and social infrastructure projects, together with various kinds of spending related to the elections, helped to maintain employment levels in the formal sector and the share of casual employees in the workforce in the face of the GFC.6 In combination with the disbursement of direct
cash transfers to the poor in early 2009 and cash paid by parliamentary candidates to voters, particularly the poor, this led average household incomes to increase in most regions, and the increase was higher in most areas for poor people than for the population as a whole in the year to March 2009. This is consistent with the observation of widespread declines in poverty, except in rural Papua. On this interpretation, the GFC, the stimulus package, the direct cash transfers to the poor, and election campaign spending have combined to create a mechanism of income redistribution in favour of the poor, except in rural Papua.
SBY’S FIRST 100 DAYS
Following the announcement of their election victory, President SBY and his new vice president, Boediono, were quick to announce a set of socio-economic tar-gets to be achieved during SBY’s second term in offi ce (Yudhoyono and Boediono
2009). The quantitative targets for economic development and welfare improve-ment are as follows:
• the rate of economic growth should rise to approximately 7% annually by 2014 (the end of SBY’s second term);
• unemployment should fall to 5–6% by 2014;
• the proportion of people living in poverty should fall to 8–10% by 2014; and • the annual infl ation rate should be in the range 3–5% throughout.
6 This does not preclude the possibility that average working hours declined, particularly in the formal sector.
TABLE 6 Regional Poverty Levelsa
(%)
Rural Urban Total
2008 2009 2008 2009 2008 2009
Sumatra 16.0 15.0 13.6 12.2 15.1 13.9
Java–Bali 19.7 17.7 11.4 10.6 15.0 13.7
Nusa Tenggara 24.4 22.4 25.4 24.6 24.7 23.0
Kalimantan 10.7 9.1 6.8 5.1 9.1 7.5
Sulawesi 19.3 18.3 7.6 6.7 15.7 14.8
Maluku 27.2 25.9 8.7 7.5 22.1 20.9
Papua 45.4 46.3 6.7 5.9 36.6 37.1
Indonesia 18.9 17.4 11.7 10.7 15.4 14.1
a The poverty measure is as at March of each year.
Source: BPS (2009).
To achieve these targets, the president rightly emphasised the importance of implementing sound macroeconomic policies.
In addition, the leaders specifi ed a set of qualitative socio-economic objectives:
• to improve access to education so as to increase literacy and educational attain-ment more generally;
• to improve access to health care facilities so as to lower the rates of maternal and infant mortality and increase life expectancy;
• to establish better food and energy security;
• to maintain environmental quality in both urban and rural areas; • to develop better infrastructure; and
• to strengthen medium and small enterprises.
In thinking about the quantitative targets, it is worth recalling a similar set of targets set by SBY for his fi rst presidency (2004–09), none of which was achieved
(Kuncoro, Widodo and McLeod 2009). Economic growth rates approached but never reached the 7% target (averaging 5.7%), and the period has been categorised as one of ‘jobless growth’ (Manning and Roesad 2007), in which both the unemployment and poverty targets were missed.
To avoid similar disappointment in SBY’s second term, his government will need to give stronger emphasis to policies that enhance economic growth and, in particular, encourage ‘employment-friendly’ growth. Indonesia’s experience during the last fi ve years with economic growth, unemployment and poverty
is shown in fi gure 6. With population growth of about 1.3%, it can be seen that
unemployment declined when GDP growth exceeded 5.5%. Poverty then began to decline as growth accelerated to above 6% and unemployment fell further. On this basis, and given that GDP growth currently is only about 4%, we argue that reducing unemployment and poverty to levels of 5–6% and 8–10%, respectively, by 2014 will require the achievement of 7% or higher growth much earlier than 2014, and preferably by 2010. Alternatively, the government will need to make a greater effort to achieve growth of a kind that is more labour intensive.
In addition to setting out their overall goals for the next fi ve years, SBY and
Boediono have focused on a strategy for the fi rst 100 days of the new administration,
knowing from past experience that the media can be expected to devote a good deal of attention to evaluating the government’s performance during this early period. Accordingly, they put together a small team in August to provide basic economic policy guidance for both the fi rst 100 days and the next fi ve years. The
team collaborated with various government departments and with international donors in formulating its recommendations. Based on interviews with various individuals who have interacted with the economic team, we understand that the general strategy for the fi rst 100 days will be as follows.
The emphasis will be on quickly implementing several small reform projects that are not politically sensitive. The focus will be on ‘low-hanging fruit’, so as to ensure success and demonstrate to the general public and the rest of the world that the new government is serious about conducting reform. By generating these quick success stories, the government hopes to create a perception that it has the will and the capacity to tackle reform more generally. It believes that such perceptions matter: that the positive impact resulting from these small reform projects is likely to create a snowball effect, making it easier to implement much
larger and more sensitive reform projects subsequently. Besides undertaking some small reforms quickly, the team intends the government to initiate at least one large project within the fi rst 100 days, such that it is fully planned and its fi nancing secured during this time-frame. This is designed to demonstrate that
SBY and his new cabinet are well capable of implementing mega projects. One possibility under consideration is the construction of a trans-Java highway.
The initial reforms extend to the areas of geographical infrastructure, soft infrastructure and social infrastructure. The thinking behind them is that, while the normal level of global demand for goods and services may not recover for some time yet, production for the domestic market can be encouraged by allowing goods and services to move more cheaply and freely between various parts of the country. The benefi ts of this accelerated growth would then be expected to spread
widely throughout the country.
In the area of geographical infrastructure, the plan is to improve inter- and intra-island connections through better port services and other transport systems. This includes improving the quality of inter-island shipping, ports, roads and bridges. Improving soft infrastructure involves reforming regulations so as to reduce the bureaucratic obstacles to inter- and intra-island economic links. Examples include the reform of permit and licensing systems in the fi eld of transport, and the
resolution of private and public land tenure problems related to roads and other transport facilities. The improvement of social infrastructure focuses on enhancing the ability of the poor to engage in domestic market activities through schemes such as the National Program for Community Empowerment (Program Nasional Pemberdayaan Masyarakat, PNPM) and the Schools Operational Assistance (Bantuan Operasi Sekolah, BOS) scheme.
FIGURE 6 Annual GDP Growth, Unemployment and Poverty under the First SBY Administration
(%)
20040 2005 2006 2007 2008
5 10 15 20
0 2 4 6 8 10
Poverty (% of population) (lhs)
Unemployment (% of labour force) (lhs)
Annual growth (%) (rhs)
Source: CEIC Asia Database; BPS (2009).
In our view, this ‘fi rst 100 days’ strategy of committing to a few non-sensitive
reforms that face little opposition, while avoiding or delaying implementation of important reforms that face strong opposition from particular interest groups, is hardly likely to create a perception that the new government is serious about undertaking reform. Furthermore, this strategy risks failing to do what is necessary to achieve the targets of 7% growth, 5–6% unemployment and 8–10% poverty. For example, it has been argued that one of the key factors constraining both the growth of the manufacturing sector and the achievement of more employment-friendly growth is the current labour law. According to this argument, the law needs to be revised (Manning and Roesad 2007), but the fi rst
SBY administration backed away from this because of strong political opposition to such a move. Regardless of whether other, ‘easy’, reforms are implemented within the fi rst 100 days, this opposition will not disappear. Likewise, in the
mining sector, problems with land tenure and confl icts between the forestry and
mining ministries and between the state and local populations have delayed for many years the opening up of new mining projects that would benefi t not only
the fi rms in question but also the local government and people (Resosudarmo
et al. 2009). To deal with such reforms and problems, the government may need to overcome strong resistance from the bureaucracy, the business community and the general public. This will require much more than the implementation of a few ‘quick and easy’ reforms in other areas. What is called for within the
fi rst 100 days, therefore, is a clear commitment to undertake these important but
diffi cult reforms as quickly as possible.
The idea of initiating a mega construction project within the fi rst 100 days
gives cause for concern. The fi rst SBY administration found it extremely diffi cult
to obtain private sector fi nancing for large infrastructure projects, and there is
no obvious reason to believe that this problem can now be easily overcome. If it cannot, the government would need to rely on its budgetary resources or on additional borrowing.
Table 7 illustrates the diffi culty of funding a huge infrastructure project from the
budget. The level of subsidies is still very high (accounting for about 16% of total expenditure in 2008), and the experience of the fi rst SBY administration is that it is
extremely diffi cult politically to cut back these subsidies. In addition to this, about
11% of budget funding needs to be devoted to non-discretionary interest payments on the government’s accumulated borrowings, and the law requires it to allocate at least 20% of the budget to education.7 Against this background, it becomes clear
why the budgetary allocation for capital expenditure is only 9–10% of the total. It will not be possible to initiate a mega construction project in the fi rst 100 days
unless some way around this fi nancing constraint can be found.
A reminder of the diffi culty of getting things done quickly is provided in the
data for realisation of the 2009 budget through to July (table 7). In a year in which it was highly desirable to implement a quick fi scal stimulus, it is evident that
the bureaucracy again failed to overcome the obstacles to quick disbursement of funds in several important expenditure categories. By the end of July, 50–60% of planned spending for the year should have been achieved, but for capital expenditure the fi gure was less than 30%, for spending on goods and services a
7 The education expenditure is spread among several budget items.
little over 40%, and for several categories of transfers to the regions only 22–34%. It is well known that the obstacles to the smooth disbursement of government spending over the fi scal year are deeply entrenched. The implementation of some
easy reforms during the fi rst 100 days will not suffi ce to overcome them.
INFRASTRUCTURE DEVELOPMENT
The slow progress in infrastructure development since the 1997–98 fi nancial crisis is
both widely known and of concern to the SBY administration. In the years after the crisis, the government had limited capacity to fi nance infrastructure projects because
of the need to service the huge debt resulting from the bail-out of failed banks. This prevented it from responding adequately to this fundamental pre-requisite for sus-tained economic development (Kong and Ramayandi 2008). Since government has played the major role in infrastructure investment in the past,8 its failure to continue
doing so has put the maintenance of high economic growth at risk.
More recently, high world oil prices provided an opportunity to overcome this
fi scal constraint, but rather than remedying the lack of infrastructure spending
8 Government accounted for 60–70% of total infrastructure spending just before the 1997–98 fi nancial crisis (World Bank 2007).
TABLE 7 Budget Expenditure Plans and Realisation
2009 Budget 2010 Budget
Total 1,005.7 100.0 44.6 1,003.3 100.0
Central government expenditure
Salaries & honoraria 133.7 13.3 59.3 161.7 16.1
Capital expenditure 87.0 8.7 28.6 100.2 10.0
Goods & services 74.3 7.4 41.2 76.9 7.7
Domestic loan interest payments 70.9 7.0 57.0 77.4 7.7 Foreign loan interest payments 39.2 3.9 48.0 38.2 3.8
Fuel subsidy 54.3 5.4 20.1 59.0 5.9
Electricity subsidy 48.2 4.8 49.5 40.4 4.0
Other subsidies 57.5 5.7 23.0 45.0 4.5
Social assistance 77.8 7.7 36.7 69.1 6.9
Other 53.3 5.3 33.7 25.7 2.6
Transfers to regions
General allocation grant 186.4 18.5 66.7 195.8 19.5
Special allocation grant 24.8 2.5 34.1 20.6 2.1
Revenue sharing 74.1 7.4 30.1 76.6 7.6
Special autonomy grant 24.3 2.4 21.7 16.8 1.7
Source: Fiscal Policy Agency, Ministry of Finance.
the government chose to dissipate this windfall in increased domestic subsidies to fuel consumption. Meanwhile, it held a number of infrastructure summits, and launched an infrastructure reform package, the key feature of which was the encouragement of domestic and foreign private sector involvement in infrastructure development (Lindblad and Thee 2007).
Within the last year, the need for a fi scal stimulus to mitigate the effects of
the emerging global fi nancial crisis provided a new opportunity to accelerate
investment in infrastructure. The government announced a large fi scal stimulus
package in January 2009, which included additional infrastructure spending amounting to over Rp 10 trillion – later boosted to more than Rp 12 trillion (Kuncoro, Widodo and McLeod 2009: 159). While only 10% of the additional infrastructure budget was spent during the fi rst half of 2009 (World Bank 2009a),
it was expected that this spending would soon accelerate.
Although infrastructure investment by the private sector was relatively low after the previous crisis – even declining somewhat in 2005 – more recent data show some improvement. The total amount of private participation in Indonesian infrastructure projects recorded in the World Bank’s Private Participation in Infrastructure database increased sharply from just $1.3 billion in 2005 to over $5 billion in 2007 (fi gure 7).
There has also been a promising change in the composition of private sector participation. There was almost no private participation in transport infrastructure projects in the fi rst few years of this century. Private sector involvement in
infrastructure was dominated by the telecommunications industry. But in 2006 and 2007 both the transport and energy sectors also became targets for private investment. About $1 billion of private investment in transport was recorded in 2007, along with almost $500 million in energy projects.
FIGURE 7 Private Participation in Infrastructure Projects in Indonesiaa
($ million)
2000 2001 2002 2003 2004 2005 2006 2007 0
1,000 2,000 3,000 4,000 5,000 6,000
Telecommunications Energy
Transport
a Private participation in water and sewerage infrastructure has been negligibly small. These data have been omitted from the chart.
Source: World Bank, Private Participation in Infrastructure database.
Another encouraging development is the recent improvement in Indonesia’s ranking in the infrastructure index of the Global Competitiveness Report, published annually by the World Economic Forum (WEF).9 Although Indonesia’s rank is still
low, it has risen in the last three years, from 91st to 84th among the 133 countries
evaluated. The Forum also conducts an annual survey that asks respondents to identify the most problematic factors in doing business in the country in question. The proportion of respondents who viewed inadequacy of infrastructure as the biggest problem in Indonesia fell from 20.5% in 2007 to just 14.8% in 2009.
These encouraging developments must be seen in a longer-term perspective, however. Many observers have voiced concern about the low level of investment in infrastructure since the Asian fi nancial crisis. Before 1997–98, infrastructure
investment accounted for more than 5% of GDP, but it has fallen to only about 2% in recent years (Lindblad and Thee 2007). We can get some idea of the magnitude of the problem by focusing on road infrastructure over the last two decades (table 8).
Development of the road network during the decade before the 1990s crisis was substantial. Over the period 1987–98 the total road network grew by about 4.1% annually, and paved roads by an even more rapid 4.9%. Thus total road density – the length of roads per capita – grew by 2.6%, while the average quality of roads also improved. The high rate of economic growth during this period no doubt owes a great deal to the rapid development of road infrastructure.
After the 1997–98 fi nancial crisis, however, the growth of the road network
slowed so much that it failed to keep pace with population growth. The length of paved roads grew by just 0.4% annually from 1999 to 2006, and that of total roads by only 0.8%. As a result, Indonesia’s road density contracted by 0.5%. Just as the
9 In the Global Competitiveness Report, infrastructure quality is represented by an aggregat-ed index of the quality of road, rail, port and air transport infrastructure and of electricity supply, together with measures of airline passenger carrying capacity and the number of telephone lines (WEF 2009: 45).
TABLE 8 Length and Density of Roads Before and After the 1997–98 Crisisa
1987 1998 Average
Growth
1999 2006 Average
Growth
(km) (km) (% p.a.) (km) (km) (% p.a.)
Road length 227,344 355,363 4.1 355,951 377,111 0.8
Paved 99,467 168,072 4.9 203,374 208,732 0.4
Unpaved 127,877 187,291 3.5 152,577 168,379 1.4
Population 1.6 1.3
Road density 2.6 –0.5
Paved 3.3 –0.9
Unpaved 2.0 0.1
a The data after 1999 exclude East Timor.
Source: Calculated from BPS (2008) and World Bank, World Development IndicatorsOnline, available at <www.worldbank.org/data>.
expansion of the road network is likely to have contributed to high growth before the 1997–98 crisis, this contraction seems likely to have held back economic growth since then. The records also show that the length of paved roads actually declined during 2004–06, mainly as a consequence of poor maintenance (BPS 2008).
Serious deterioration in other indicators of infrastructure development relative to the pre-crisis period has also been evident. Annual growth in per capita electricity consumption between 1999 and 2006 (5.3%) was only half that for 1987–98 (10.8%). This is worrying, given that Indonesia’s electricity consumption in 2004 was only one-third of the Southeast Asian average (Moccero 2008: 13). Growth in the number of fi xed-line telephone subscribers per 100 people also
decelerated in the years following the crisis, from 16.4% annually in 1987–99 to 11.4% in 1999–2006.10
The stagnation of infrastructure development over an extended period casts doubt over the possibility of Indonesia achieving high and sustained economic growth in the future. It is unlikely that the government’s target rate of 7% annual growth by 2014 can be achieved unless there is a dramatic improvement in the level of investment in infrastructure. Although there have been some signs of improvement in recent years, there is still a long way to go before Indonesian infrastructure investment returns to pre-crisis levels.
CLIMATE CHANGE AND ITS CHALLENGES
Two years ago the signatories to the Kyoto Protocol gathered in Bali for the 2007 United Nations Climate Change Conference, where they launched negotiations for stronger action to reduce climate change. The conference culminated in the adoption of the Bali Road Map andthe Bali Action Plan, which chart the course for a new negotiating process to be fi nalised at the UN Framework Convention
on Climate Change conference in Copenhagen in December 2009. Thus Decem-ber 2009 marks an important moment in the history of climate policy, because it is hoped that the nations convening in Copenhagen will be able to agree upon a post-Kyoto global framework for tackling climate change.
In 2009 there have been new developments in many aspects of climate change thinking that have potentially important implications for the Indonesian economy. First, there is an increasing awareness that Indonesia has a bigger responsibility to the international community than was previously thought. Various reports have noted that Indonesia is one of the world’s largest contributors to carbon dioxide (CO2) emissions, if emissions from deforestation and forest degradation are included. Such emissions account for 55–85% of Indonesia’s total CO2 emissions. Although it is very diffi cult to estimate emissions from deforestation, forest
degradation and peat fi res with accuracy, most informed observers are convinced
that they are considerable. Taking into account the various uncertainties, the amount seems to be between 500 and 2,500 million tonnes (Mt) of CO2 per year – bringing Indonesia’s total emissions to between 900 and 2,900 MtCO2 per year, although this range is still subject to debate. By comparison, the estimates for the US and China are around 6,500 and 5,000 MtCO2 per year, respectively
10 On the other hand, this has been more than offset by the rapid increase in the number of mobile phone subscribers.
(Sari et al. 2007; IFCA 2008; Jotzo 2009). Although emissions from the energy sector are small relative to those from deforestation, future growth in annual emissions is likely to be driven mainly by increased demands on the energy sector as the economy grows, since emissions from deforestation and forest degradation are limited by the remaining forest area (Resosudarmo et al. 2008).
In terms of CO2 emissions per capita, Indonesia’s level is still low compared with that of many developed countries, except if the highest estimates of emissions from deforestation and forest degradation are accurate. According to the Climate Analysis Indicator Tool database, Indonesia ranked 18th in per capita
emissions in the early 2000s, provided that emissions from land-use and forestry are included.11 Nevertheless, international attention is focused on total emissions,
and Indonesia was ranked 4th in the world in the early 2000s on this measure. Even
when emissions from land-use change and forestry were excluded, it still ranked as high as 16th in the mid-2000s. Accordingly, there is pressure on Indonesia to
reduce emissions from deforestation and forest degradation in the short term, and to use cleaner sources of energy and improve energy effi ciency in the longer
term.
The government now purports to take climate change mitigation seriously. In this year’s G20 meeting in Pittsburgh, President Susilo Bambang Yudhoyono announced that Indonesia had decided on a national climate change action plan that ‘will reduce our emissions by 26 per cent by 2020 from BAU (Business As Usual)’, and that, with international support, Indonesia ‘could reduce emissions by as much as 41 per cent’ (Agence France-Presse, 29 September 2009). Much of the potential for reduction (more than 80%) relates to forestry, peat-land and agriculture,12 where Indonesia makes its greatest contribution to global
warming.13
A cut of 26% constitutes a far more ambitious target than other developing countries have contemplated. It is comparable with some of the most ambitious targets the rich nations are considering for themselves, and there is good reason to question whether this proposal has a strong foundation. First, there is still a great deal of uncertainty as to the actual amount of Indonesia’s emissions, especially from land-use change and forestry; second, the policies that would be needed to reduce deforestation and switch to cleaner sources of energy are likely to be highly complex; and third, the overall cost of doing so is very uncertain. It is important for Indonesia to consider carefully all these aspects of reducing its emissions before making such promises if they are to be taken seriously. Despite all these complexities, however, we commend the statement by President Yudhoyono, because it indicates that Indonesia cares about, and is willing to contribute to, resolving the important global issue of climate change mitigation.
Adaptation is another aspect of the response to climate change, alongside mitigation. The importance of climate change adaptation for Indonesia became
11 It ranked only 108th if these emissions are excluded.
12 ‘Cost curve fact sheet’, in Dewan Nasional Perubahan Iklim (National Council on Climate Change, DNPI) press release, 27 August 2009.
13 A 41% reduction would contribute 5% of the total global reduction needed to prevent global warming of more than 2°C, according to the United Nations Intergovernmental Panel on Climate Change (DNPI press release, 27 August 2009).