Full Terms & Conditions of access and use can be found at
http://www.tandfonline.com/action/journalInformation?journalCode=cbie20
Download by: [Universitas Maritim Raja Ali Haji] Date: 17 January 2016, At: 23:43
Bulletin of Indonesian Economic Studies
ISSN: 0007-4918 (Print) 1472-7234 (Online) Journal homepage: http://www.tandfonline.com/loi/cbie20
Do migrants get stuck in the informal sector?
Findings from a household survey in four
Indonesian cities
Chris Manning & Devanto S. Pratomo
To cite this article: Chris Manning & Devanto S. Pratomo (2013) Do migrants get stuck in the informal sector? Findings from a household survey in four Indonesian cities, Bulletin of Indonesian Economic Studies, 49:2, 167-192, DOI: 10.1080/00074918.2013.772940
To link to this article: http://dx.doi.org/10.1080/00074918.2013.772940
Published online: 26 Jul 2013.
Submit your article to this journal
Article views: 290
View related articles
ISSN 0007-4918 print/ISSN 1472-7234 online/13/020167-26 © 2013 Indonesia Project ANU http://dx.doi.org/10.1080/00074918.2013.772940
* The authors are grateful for the comments of three anonymous referees, and especially for those of Ross McLeod, the former editor of BIES, during a long editing process. The usual disclaimers apply.
DO MIGRANTS GET STUCK IN THE INFORMAL SECTOR?
FINDINGS FROM A HOUSEHOLD SURVEY IN FOUR
INDONESIAN CITIES
Chris Manning* Devanto S. Pratomo*
Australian National University Brawijaya University, Malang
This article compares labour-market outcomes for individuals in migrant and non-migrant households in Indonesia. It introduces two new work-status groups – small-business operators and formal-casual or contract employees – in an effort to
transcend the usual formal–informal distinction. We ind that long-term migrants
(LTMs) tend to gravitate to the small-business sector and to jobs with regular wag-es, whereas recent and very recent migrants are more likely to work in the informal
sector. Our indings on the labour-market outcomes of successive generations of
migrants are less conclusive. While a larger proportion of LTM children than that of their parents work in the formal sector, the children of migrant heads of households
are less likely than those of non-migrants to ind formal-sector jobs. We also ind that distortionary labour-market regulations appear to diminish the overall beneits
of migration.
Keywords: rural–urban migration, occupational mobility, formal–informal sector, employment, labour market
INTRODUCTION
The occupations and earnings of migrants compared with those of the resident population (non-migrants) are of major interest in discussions of social and eco-nomic mobility and inequality in developed and developing countries. Migrants worldwide are potentially at a disadvantage compared with non-migrants (Uni-versity of Sussex 2009; Clemens 2010): many who move do so because of the lack of opportunities in places of origin relative to destination areas, but many lack the experience and other human capital necessary to attain better jobs on arrival.
Movement from rural to urban areas is one of the potentially great avenues for socio-economic mobility in the early stages of development (Lewis 1954). In 2005, around 3 million Indonesians had moved in the previous ive years to towns and cities, mainly from rural areas. More than 18 million, or close to 15% of the total urban population, were born outside their present city of residence (Meng and Manning 2010: 11). Despite the magnitude of these movements, the labour-market experience of migrants compared with that of non-migrants in Indonesian cities is a neglected area of research.
Building on an earlier analysis of employment sectors1 and earnings among different cohorts of migrants and non-migrants (Alisjahbana and Manning 2010), this article focuses on differences in occupation and work status among different cohorts of migrants, and between migrants and non-migrants. It also examines changes in work status across generations – a topic that has not been examined in previous studies on Indonesia. The data are drawn from the Rural–Urban Migra-tion in China and Indonesia (RUMiCI) project, an annual panel survey of rural– urban migration in four cities in Indonesia and 19 in China during 2008–11.2
This article aims to provide a more meaningful analysis of work-status het-erogeneity in Indonesia than that presented to date. It seeks to go beyond the conventional deinitions of the formal and informal sectors by identifying two additional segments of the urban labour market (the small-business and formal-casual segments) that provide opportunities for migrants to improve their living standards.3 As research in China suggests, the segments of the urban economy where migrants congregate, and the extent to which they are able to move to new segments, inluence wage outcomes signiicantly (see Meng 1998; Zhao 1999). This article’s second contribution is its examination of intergenerational socio-economic mobility: it compares the earnings of migrants with those of their par-ents, and the earnings and occupations of the children of migrants with those of their parents.
The outline is as follows. The irst section discusses the literature on the socio-economic mobility of migrant populations, especially in the context of rural– urban migration in Indonesia. It also draws attention to some of the features of the Indonesian urban labour market that are likely to be important for migrant mobility. The second section briely describes the sample covered in the RUMiCI survey in Indonesia and the data set used for this study. It then examines work status and earnings among non-migrants and migrant groups, distinguished by the duration of their residence in the city. The third section turns to the question of socio-economic mobility, by comparing the occupations of household heads and their spouses with those of their parents and their children. The inal section discusses the indings and concludes.
MIGRATION, THE URBAN LABOUR MARKET AND THE INDONESIAN CONTEXT
Since the late 1960s, the shift of labour out of agriculture into other sectors has been a feature of the Indonesian labour market (Hugo 1978; Manning 1987). This shift is frequently associated with rural–urban migration – a shift to a more urbanised
1 In this article, and in this context, the terms ‘sector’, ‘segment’ and ‘work-status group’ are interchangeable.
2 The project, which began in 2008, adopted a similar survey methodology and approach in both Indonesia and China (Resosudarmo, Yamauchi and Effendi 2010). It was generous-ly supported by grants from the Australian Research Council and AusAID. The Indonesian team of researchers included Tadjuddin Nur Effendi, from Gadjah Mada University, and Tao (Sherry) Kong, Chris Manning and Budy P. Resosudarmo, from the ANU.
3 This approach follows that of Meng (2001), who distinguishes between regular-wage workers and contract or casual workers on construction sites in urban China.
economic environment, where economies of scale and scope offer a much greater range of job opportunities (World Bank 2009). Where such a shift occurs, one important question relates to how migrants fare relative to non-migrants in the urban labour market. We are especially interested in how the status of migrants changes over time, as they become more assimilated into the urban labour force (Lucas 1997).
International research suggests that both the segment of the labour market a migrant enters initially and their subsequent degree of occupational mobility play a major role in determining the earnings of migrants relative to non-migrants (Zhao 1999; Meng 2001) – we expect this also to be the case in Indonesia. The literature often identiies two broad patterns of entry. Initial entry into wage employment in the formal sector – especially in export-oriented, labour-intensive industries – has been common in East Asian countries since the 1980s. Wage employment, rather than informal-sector work, has been the main target for many rural–urban migrants in rapidly growing countries oriented towards exporting manufactured goods. In contrast, migrants in many less rapidly growing economies tend to start out in the informal rather than in the formal sector, as Hart (1973) observed in Africa.4 This is particularly true if several conditions hold: a highly elastic supply of labour at going wage rates in the agricultural sector; a low and slow-growing rate of formal-sector employment; and formal-sector wages above market-clear-ing levels (Mazumdar 1994). Under such conditions, migrants typically crowd into low-wage, informal-sector jobs in trades and services in towns and cities, as was the case in the early stages of growth in Indonesia under Soeharto and per-haps also after the Asian inancial crisis (AFC) of 1997–98.
Further, it is a mistake to assume that migrants are occupationally immobile, even within the informal sector, or that they remain in the same low-wage jobs that they irst take up in the cities (Katz and Stark 1986). As migrants accumulate skills and experience, opportunities arise for them to move into higher-income jobs. The extent to which migrants avail themselves of these opportunities is therefore important.5
The literature on occupational mobility suggests that migrants do not always view the informal sector as a stepping stone to the formal sector, as some of the early models of rural–urban migration assumed. These models were irst devel -oped to explain rural–urban migration and occupational mobility in cities with a small formal sector (where wages were often regulated) and a large informal sector. The latter provided low-wage and unskilled work, conducted mostly by itinerant rural–urban migrants.6 But as countries such as Indonesia have become more developed, the concept of the informal sector has become ambiguous; the sector has diversiied, now comprising thriving small businesses, modern service
4 Hart (1973) is credited with irst using the term ‘informal sector’, in relation to the pat -tern of urban expansion in Accra, Ghana, in the 1950s and 1960s.
5 Steele (1980) found that occupational stability was more common than occupational
mo-bility among lifetime migrants, relecting relative economic stagnation in Indonesia in the irst decades after independence.
6 Most notably, these included extensions of the Harris–Todaro model of rural–urban mi-gration. See Mazumdar (1994) and Lall, Selod and Shalizi (2006) for critiques of some of the assumptions of the early models of rural–urban migration.
activities engaging self-employed workers, and family enterprises. Informal jobs have proliferated – particularly where the economy is growing rapidly – gener-ating self-employment opportunities for entrepreneurially inclined individuals. These informal jobs coexist with low-productivity jobs that are a refuge for sur-plus labour, such as unskilled street vendors.
Such diversity and dynamism tend to produce complex patterns of labour mobility, both within urban labour markets and related to rural–urban migra-tion. In his work on the transition between the informal and formal sectors in Mexico, Maloney (1998) identiies several distinct yet overlapping segments of the informal sector (including self-employed workers, informal salaried workers and contract workers) based on differences in earnings.7 Labour tends to low in and out of the informal sector, making for a greater churning of labour markets than many had imagined, as has been identiied in Latin America (IADB 2004). In China, which has been transformed by manufacturing for export, migrants tend to move irst from informal wage work in rural areas to the urban formal sector (Meng 2001). Later, however, they may move from the formal sector to become self-employed in the informal sector.
The Indonesian context
Three sets of developments in the Indonesian labour market inform this article’s approach. First, our analysis draws on the redeinition of work-status catego -ries in the National Labour Force Survey (Sakernas) of 2001, which allows us to
7 The segments are distinctive, not only because of differences in earnings but also because
of patterns of labour mobility; all have well-deined relationships with the formal sector.
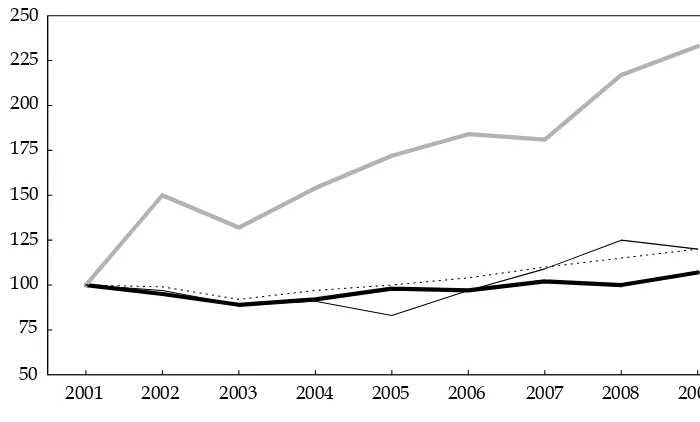
FIGURE 1 Index of Employment outside Agriculture by Work-Status Group, 2001–09 (2001 = 100)
Source: National Labour Force Survey (Sakernas), various years.
differentiate between casual or contract wage workers and regular employees, and between employed and self-employed workers. Bearing in mind that migrant workers are likely to be unevenly distributed across these categories, employment trends among these workers are of some interest. Figure 1 shows that the growth of casual employment was faster than that of regular and informal employment. In part, these developments can be interpreted as a consequence of slow growth in private-sector investment and output, especially in manufacturing. They present a marked contrast with the trends of the pre-AFC period, when all wage employ-ment expanded rapidly, and are consistent with the distortionary effect of large increases in minimum wages and severance payment requirements that several authors had predicted in the early years of the post-AFC period (Manning 2008).8
Second, we recognise important changes in the quality of labour supply. The expansion of schooling in Indonesia’s rural areas since the AFC, for example, has changed the labour-market strategies of potential rural–urban migrants. Overall
growth
in labour supply and the low of labour to the cities may have slowed in the early part of this century (Meng and Manning 2010), but the supply of more-educated manpower has continued to increase in rural areas.9 It is not surprising, then, that recent migrants to cities in Indonesia are likely to have had better access to formal-sector jobs than did their less educated predecessors a decade or more before.
Third, this article recognises sharp changes in economic circumstances over the past two decades, in particular, which have affected the integration of migrants into urban economies. We can distinguish three distinct periods of labour-market dynamics: (1) prior to the AFC; (2) during the AFC and the immediate recovery; and (3) after the immediate post-AFC recovery period. These correspond broadly to the categories of long-term, recent and very recent migrants identiied in our analysis.
The irst period, prior to the AFC of 1998, saw high levels of rural–urban migra -tion in Indonesia, owing to rapid economic growth, widespread rural poverty and expanding urban demand for labour. New jobs were created in the cities in both the formal and the informal sector, absorbing many rural–urban migrants. The urban formal sector’s share of total employment almost doubled from its level in 1980 driven by new wage-earning opportunities in export-oriented indus-tries (Manning 1998).10
8 Note that these employment categories, as identiied in Sakernas, do not it precisely
with those from the RUMiCI data set analysed below. In particular, there is no way of
breaking down informal and self-employed activities by labour-force size or irm size in the Sakernas data, since there is no information on the characteristics of irms where indi -viduals work.
9 The share of the labour force with senior-high schooling or above in rural areas rose from 5% in 1987 to 11% in 1997 and then to 16% – or slightly more than 10 million people – in 2008 (data based on the August round of Sakernas in these years).
10 Earlier studies of migration in Indonesia had noted that migrants were most likely to enter the informal sector – except for the period between the late 1980s and the AFC, when export-oriented manufacturing played a dominant role in creating jobs. See Hugo (2000) for a discussion of the early literature on migration.
In the second period, 1998–2002 (the AFC and its immediate aftermath), eco-nomic growth was slow and unstable, and total employment growth shrank to half of its pre-AFC level. The urban share of total employment continued to grow, however, bolstered by growth in the informal sector. During the third period, 2002–09 (the post-AFC recovery), informal-sector employment grew quite strongly, and faster than formal-sector employment in urban areas, despite improved economic growth (perhaps partly as a consequence of greater regula-tion of the formal-sector labour market).
We expect these developments in the urban labour market to be closely related
to
the intensity and duration of rural–urban migration lows in Indonesia, as they have been in other countries. Periods of distinct economic growth offer a rich lab-oratory to study rural–urban interactions; the RUMiCI survey in Indonesia grants us this opportunity. We turn now to describe the main features of this survey, its sample characteristics and other methodological issues, before reporting on the results of our quantitative analysis.
THE RUMiCI SURVEY: FEATURES, SAMPLE CHARACTERISTICS AND METHODOLOGY
Here we briely describe the RUMiCI household survey and deine its key vari -ables, having drawn the sample from the four cities covered in the 2009 RUMiCI survey: Tangerang, in Banten, near Jakarta; Medan, in Sumatra; Samarinda, in Kalimantan; and Makassar, in South Sulawesi. We selected these four cities based on the absolute number of migrants in each and on the desire to capture regional diversity. Thus we chose the four largest recent migrant destination cities in the four main geographic regions of Indonesia (Sumatra, Java–Bali, Kalimantan and Eastern Indonesia; see Resosudarmo et al. 2010).11 The representativeness of the sample (2,500 households) is improved by the inclusion of the ‘younger cities’ of Tangerang and Samarinda, together with the ‘older cities’ of Medan and Makas-sar (Kong and Effendi 2011).
In the 2009 RUMiCI survey, household heads, their spouses, and children aged 17 and over were asked detailed questions on employment and earnings. In addi-tion, household heads were asked about the work status of their children living elsewhere and about the main economic activities undertaken by their and their own spouses’ fathers (whether living or deceased). Responses to these questions underpin the analysis undertaken in this study.
To be deined as a rural–urban migrant, a household head must have lived for at least ive continuous years in a rural area before turning 12. Note that our deini -tion of a rural–urban migrant is slightly different from that of several other studies of the RUMiCI data set for Indonesia. We deine migrants by the migration status
11 Our selection was based on the distribution of recent rural–urban migrants in cities in Indonesia, as found by the 2005 Susenas. Tangerang, on the outskirts of Jakarta, was cho-sen as part of the Greater Jakarta region, where by far the largest number of rural–urban migrants is concentrated. Batam, in the Riau islands, also has one of the largest populations of rural–urban migrants in Indonesia. It was not selected for this study, mainly because of
cost considerations and the expected dificulties in undertaking a household survey in this
region (where survey costs were reported to be much greater than in the other locations).
of the household head, on the assumption that this status affects the behaviour of the head’s spouse and children.12 A migrant head’s spouse born in the selected city and a child born to a migrant head living in the city are therefore considered to be migrants. Non-migrants (NMs) do not meet these criteria. Building on the analysis in Alisjahbana and Manning (2010), based on the 2008 RUMiCI survey, this article analyses data from the 2009 survey. It takes account of those migrants who moved during and after the AFC, as well as those who moved to cities later in the 2000s (after economic growth rates began to increase).
This article categorises employed migrants as follows: long-term migrants (LTMs), or those who moved to their current place of residence before 1998 (before the AFC); recent migrants (RMs), or those who moved to their current place of res-idence during 1998–2002 (the period of recovery after the crisis); and very recent migrants (VRMs), or those who moved to their current place of residence during 2003–09 (after the AFC recovery period).
LTM and NM household heads and their spouses share many similar socio-demographic patterns, whereas VRM and RM household heads differ in several important ways from the other two groups. LTM and NM households are typi-cally headed by middle-aged (with mean ages of 44 and 42, respectively), married males. In contrast, around two-thirds of VRM household heads, and nearly half of RM household heads, are under 30 years of age; two-thirds are male; and a large proportion are single. LTMs and NMs work mainly in trades and services, as do VRMs and RMs; but a larger proportion (around one quarter) of LTMs and NMs are white-collar workers, compared with 10%–15% of VRMs and RMs.
Compared with LTMs and NMs, fewer VRMs and RMs work as profession-als, an even smaller proportion are private-sector employees (especially among RMs), and a larger proportion are unskilled. If we compare the number of years of schooling, however, VRM and RM household heads and their spouses are closer to their LTM and NM peers: in all groups, the mean number of years of schooling are 11–12 among males and 9 among females (12 years is equivalent to a com-pleted high-school education).
MIGRATION, WORK STATUS AND EARNINGS OF HOUSEHOLD HEADS
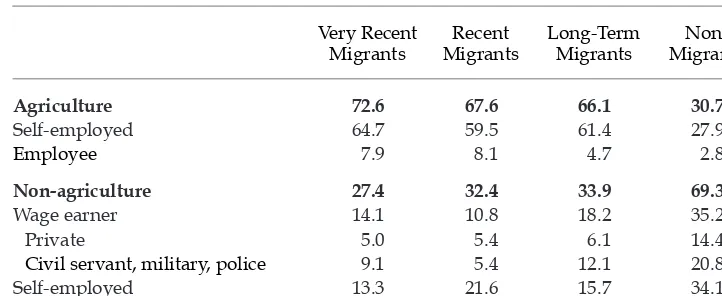
Our interest is in determining labour-market outcomes by employment sector and wages for VRMs, RMs, LTMs and NMs. Most rural–urban migrants come from households where the fathers of the head are self-employed or casual workers in agriculture (table 1), and previous empirical studies suggest that children tend to make occupational choices similar to those of their parents.13 Thus we might expect that migrants would seek out similar work environments in the informal sector when moving to urban areas.
12 Using the same data set, Effendi et al. (2010) and Resosudarmo et al. (2010) deine mi
-grants simply as people – not necessarily household heads – who spent at least ive con -tinuous years in a rural area before the age of 12.
13 For example, Ianelli (2002) inds that, across Europe, parental education inluences
young people’s occupational destinations. See also Harper and Haq (1997) and Constant and Zimmermann (2003), both of which examine occupational change across generations.
The
literature also argues that migrants ind it easier to enter the informal sec -tor than the formal sec-tor because they typically lack experience. Likewise, the framework of the dual urban economy predicts that a combination of economic and institutional factors restricts migrants from entering the formal sector (Harris and Todaro 1970; Welch 1974; and Mazumdar 1994). As we can now differenti-ate between migrants, it seems plausible that these arguments are likely to apply more strongly to RMs – and especially to VRMs – than to LTMs.
From this perspective, then, VRMs and perhaps RMs might be expected to seek casual-wage or informal-sector jobs, especially given that the Indonesian govern-ment does not provide unemploygovern-ment beneits to those queuing for formal-sector jobs. Add to this the increasingly distortionary inluence of labour-market regula -tion since the AFC, which has slowed the growth of regular-wage opportunities in the formal sector (where those regulations have had their main impact). Thus it is not surprising that VRMs and RMs often work in the informal sector and in formal-casual jobs (World Bank 2010). Thus we might expect RMs who have been in the urban labour market for only six to ten years to show patterns of employ-ment more similar to those of VRMs than to those of LTMs and NMs.
Socio-economic mobility is also relevant, as evidenced by the occupations of the children of migrants compared with those of their parents. Here we might hypothesise that such children are far more likely than their parents to work in the formal sector, in better-paid jobs than those in the informal sector. This hypoth-esis derives from the higher level of completed schooling observed among the children of migrants, which is likely to provide more opportunities for them to engage in higher-paying work. In contrast, the labour market in the wake of the AFC was marked by greater competition for scarce modern-sector jobs than in the period of rapid economic growth before it, as well as by more restrictive labour-market regulations. This might have made it harder for the children of migrants to obtain jobs in the formal sector than it had been for their parents. Improved educational qualiications might unlock many modern-sector jobs, especially if employers raise educational requirements in response to an increased supply of
TABLE 1 Main Occupation of Fathers of Household Heads and Spouses (%)
Non-agriculture 27.4 32.4 33.9 69.3
Wage earner 14.1 10.8 18.2 35.2
P rivate 5.0 5.4 6.1 14.4
Civil servant, military, police 9.1 5.4 12.1 20.8
Self-employed 13.3 21.6 15.7 34.1
Source: RUMiCI survey, 2009.
Note: Includes both living and deceased fathers.
more-educated manpower, or in response to higher and more strongly enforced minimum-wage levels and other labour regulations.
This article also examines the correlation between the occupations and earn-ings outcomes of migrants and NMs. It is often argued that RMs are paid less than LTMs and NMs, because they are more likely to work in the informal sec-tor (as discussed above).14 At the same time, the more stringent minimum-wage regulations introduced since the AFC might see those migrants who did obtain formal-sector jobs paid similar wages to LTMs and NMs (after controlling for age, education and other factors).15 As with work status and socio-economic mobility, the likely outcome is not obvious.
Work status
This
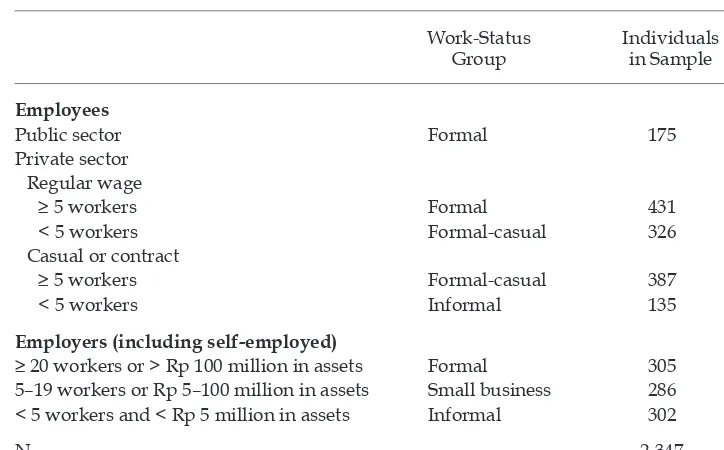
article reines the formal–informal dichotomy by identifying two new work sectors – the small-business and formal-casual sectors – thus distinguishing from the commonly used formal and informal division (table 2). The formal sector encompasses all public-sector employees, regular-wage employees in private-sector irms with at least ive workers, and employers whose irms either employ at least 20 workers or have business assets worth more than Rp 100 million. The formal-casual sector comprises casual or contract workers in irms with at least
14 Meng’s (1998 and 2001) studies in China established that the number of hours a rural– urban migrant spends working in the city is an important determinant of wage outcomes.
Speciically, she inds that this is signiicant for the self-employed but not signiicant for
formal-sector workers.
15 Manning and Roesad (2007) document the tighter minimum-wage regulations that have existed in Indonesia since the AFC.
TABLE 2 Work-Status Deinitions
Work-Status Group
Individuals in Sample
Employees
Public sector Formal 175
Private sector Regular wage
≥ 5 workers Formal 431
< 5 workers Formal-casual 326
Casual or contract
≥ 5 workers Formal-casual 387
< 5 workers Informal 135
Employers (including self-employed)
≥ 20 workers or > Rp 100 million in assets Formal 305 5–19 workers or Rp 5–100 million in assets Small business 286 < 5 workers and < Rp 5 million in assets Informal 302
N 2,347
Source: RUMiCI survey, 2009.
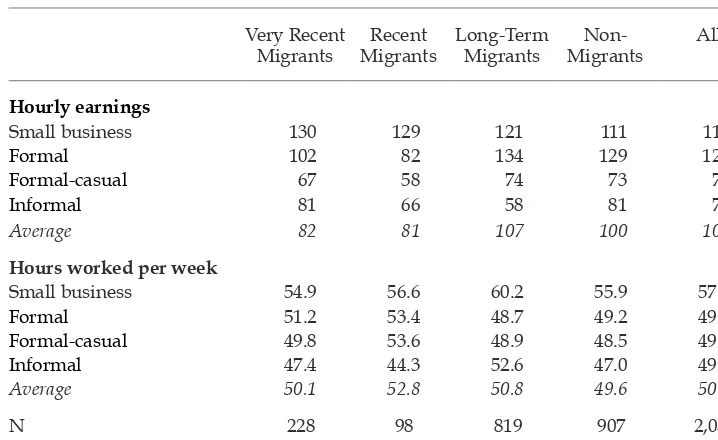
TABLE 3 Index of Hourly Earnings and Working Hours of
Small business 130 129 121 111 117
Formal 102 82 134 129 127
Formal-casual 67 58 74 73 71
Informal 81 66 58 81 72
Average 82 81 107 100 100
Hours worked per week
Small business 54.9 56.6 60.2 55.9 57.7
Formal 51.2 53.4 48.7 49.2 49.3
Formal-casual 49.8 53.6 48.9 48.5 49.1
Informal 47.4 44.3 52.6 47.0 49.0
Average 50.1 52.8 50.8 49.6 50.2
N 228 98 819 907 2,052
Source: RUMiCI survey, 2009.
Note: Average wage for the whole sample = 100.
ive
workers, as well as regular-wage employees in irms with fewer than ive workers. The small-business sector includes employers and self-employed indi-viduals in irms with between ive and 19 workers or Rp 5–100 million (approxi -mately $500–$10,000 at 2009 exchange rates) in ixed assets. Finally, the informal sector includes casual or contract workers for irms with fewer than ive workers, together with employers and self-employed individuals in irms with assets val -ued at less than Rp 5 million and employing fewer than ive workers.
Table 3 presents data on the income earned and the average hours worked by household heads and their spouses in these four sectors, disaggregated by migra-tion status. Hourly earnings in the small-business and formal sectors, across all migration categories, are roughly twice as high as in the formal-casual and infor-mal sectors – suggesting that forinfor-mal-casual work is more similar to inforinfor-mal than formal work, and that self-employment in the small-business sector is likely to be an important channel for socio-economic improvement. The formal–informal gap is especially wide among LTMs, while the small-business–informal gap is wide for both RMs and LTMs. The differences in total earnings between those in the small-business sector and those in the other three work-status groups are even greater than table 3 suggests, because self-employed people tend to work signii -cantly longer hours, on average, than employees and those in the informal sector. Note, also, that earnings in the small-business and formal work-status groups are signiicantly higher for LTMs than for VRMs and RMs.
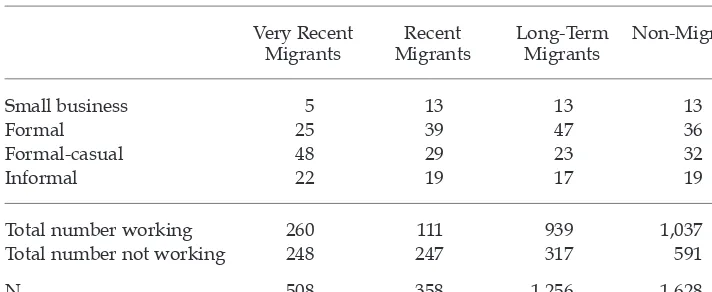
Cross-tabulating work sector and migration status (table 4) reveals interesting contrasts between groups in our sample, and supports our decision to separate the small-business and formal-casual work-status groups from the formal and the
informal. It also provides tentative support for the hypothesis that migrants do not remain stuck in the informal sector but are able to move into higher-income occupations over time.
We used a multinomial logit model to examine more rigorously the distribu-tion of migrant and non-migrant workers among our four work-status groups. The explanatory variables (covariates) are as follows:
• a set of migration statuses (VRM, RM, LTM and NM, as deined above);
• a set of occupational categories for the fathers of household heads and their spouses (agriculture, public sector, private sector, self-employed, and family worker or not working);
• a set of categories for the individual’s occupation (‘professional’, that is, professional, managerial and clerical or administrative work; trades and services; and all other blue-collar work);
• a set of personal characteristics of the household head (age and age squared, sex, and years of schooling);16
• a set of location dummies; and
• a set of categorical network dummies (the number of relatives and close friends, living outside the household, with whom the household head has regular contact).17
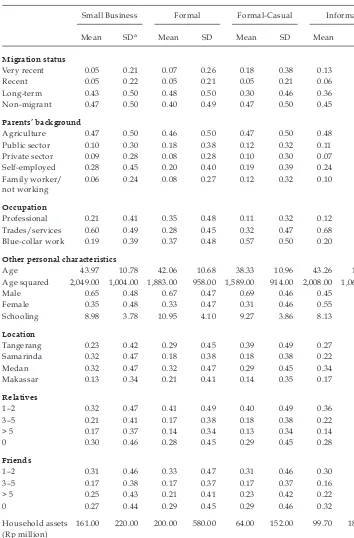
Table 5 contains summary statistics for the main variables across work-status groups.
16 Some potential factors, such as ethnicity, ability or skill, and whether the individual in question is a return migrant or a commuter, are not included as control variables, since they are not part of our data set.
17 Respondents were asked whether they had siblings, extended family members, or friends (or other persons not living with them) to whom they felt close enough to share thoughts and feelings. Several studies have found that such networks reduce both psy-chological and information costs and make it easier for migrants to get better jobs (see, for example, Zhao 2003).
TABLE 4 Work Status and Migration Status of Household Heads and Spouses (%)
Very Recent Migrants
Recent Migrants
Long-Term Migrants
Non-Migrants
Small business 5 13 13 13
Formal 25 39 47 36
Formal-casual 48 29 23 32
Informal 22 19 17 19
Total number working 260 111 939 1,037
Total number not working 248 247 317 591
N 508 358 1,256 1,628
Source: RUMiCI survey, 2009.
TABLE 5 Summary Statistics for Main Variables across Work Statuses
Small Business Formal Formal-Casual Informal
Mean SD a Mean SD Mean SD Mean SD
Migration status
Very recent 0.05 0.21 0.07 0.26 0.18 0.38 0.13 0.34 Recent 0.05 0.22 0.05 0.21 0.05 0.21 0.06 0.21 Long-term 0.43 0.50 0.48 0.50 0.30 0.46 0.36 0.48 Non-migrant 0.47 0.50 0.40 0.49 0.47 0.50 0.45 0.50
Parents’ background
Agriculture 0.47 0.50 0.46 0.50 0.47 0.50 0.48 0.50 Public sector 0.10 0.30 0.18 0.38 0.12 0.32 0.11 0.32 Private sector 0.09 0.28 0.08 0.28 0.10 0.30 0.07 0.26 Self-employed 0.28 0.45 0.20 0.40 0.19 0.39 0.24 0.43 Family worker/
not working
0.06 0.24 0.08 0.27 0.12 0.32 0.10 0.30
Occupation
Professional 0.21 0.41 0.35 0.48 0.11 0.32 0.12 0.32 Trades/services 0.60 0.49 0.28 0.45 0.32 0.47 0.68 0.46 Blue-collar work 0.19 0.39 0.37 0.48 0.57 0.50 0.20 0.40
Other personal characteristics
Age 43.97 10.78 42.06 10.68 38.33 10.96 43.26 11.72 Age squared 2,049.00 1,004.00 1,883.00 958.00 1,589.00 914.00 2,008.00 1,061.00 Male 0.65 0.48 0.67 0.47 0.69 0.46 0.45 0.50 Female 0.35 0.48 0.33 0.47 0.31 0.46 0.55 0.50 Schooling 8.98 3.78 10.95 4.10 9.27 3.86 8.13 3.74
Location
Tangerang 0.23 0.42 0.29 0.45 0.39 0.49 0.27 0.45 Samarinda 0.32 0.47 0.18 0.38 0.18 0.38 0.22 0.41 Medan 0.32 0.47 0.32 0.47 0.29 0.45 0.34 0.47 Makassar 0.13 0.34 0.21 0.41 0.14 0.35 0.17 0.38
Relatives
1–2 0.32 0.47 0.41 0.49 0.40 0.49 0.36 0.48 3–5 0.21 0.41 0.17 0.38 0.18 0.38 0.22 0.41 > 5 0.17 0.37 0.14 0.34 0.13 0.34 0.14 0.35 0 0.30 0.46 0.28 0.45 0.29 0.45 0.28 0.45
Friends
1–2 0.31 0.46 0.33 0.47 0.31 0.46 0.30 0.46 3–5 0.17 0.38 0.17 0.37 0.17 0.37 0.16 0.37 > 5 0.25 0.43 0.21 0.41 0.23 0.42 0.22 0.41 0 0.27 0.44 0.29 0.45 0.29 0.46 0.32 0.47
Household assets (Rp million)
161.00 220.00 200.00 580.00 64.00 152.00 99.70 183.00
N 286 911 713 437
Source: RUMiCI survey, 2009. a SD = standard deviation.
We have reported marginal effects for each explanatory variable in the multi-nomial logit model because the raw regression is neither directly informative nor comparable within different work-status categories. The marginal effects indicate the difference in each variable’s probability of being found in any of the work-status categories, relative to the following reference individual: a female, non-migrant, blue-collar worker living in Makassar and with no contact with relatives or friends outside the household, whose parents are either family workers or not working. Sampling weights are included in all regressions, to account for indi-viduals in different cities having a different probability of being sampled (Reso-sudarmo et al. 2010). Standard errors are robust to heteroskedasticity and are clustered at the city level.
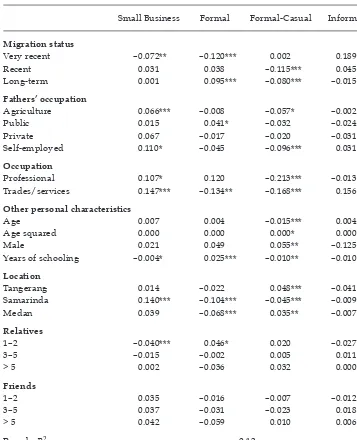
Table 6 reports the results of the multinomial logit model for the entire sam-ple. These generally support the argument that the informal sector is easier to enter than the formal sector, especially if we consider the similarities between formal-casual and informal work and between small-business and formal work. For example, VRMs are less likely to work in small business or in the formal sec-tor than all other groups, whereas LTMs are more likely to work in the formal sector.18 RMs and LTMs are less likely than VRMs to have formal-casual (that is, quasi-informal) occupations. VRMs and, to a lesser extent, RMs are more likely to work in the informal sector than LTMs and NMs.
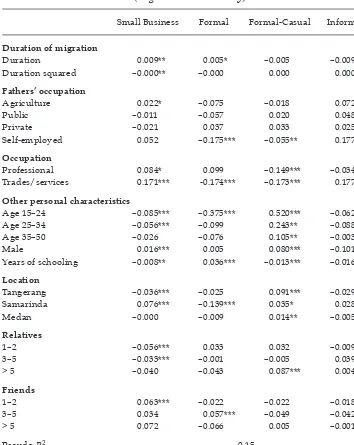
To examine whether the effect of migration duration on work status is non-linear, we re-estimated the work-status equation for migrants only, using the duration of migration and duration squared (rather than migration status) as explanatory variables. The other explanatory variables were the same as for the previous regression, except that the continuous age variable was replaced by a set of categorical variables (omitting age squared), to reduce the potential of high
collinearity
with the duration variable. The results in table 7 conirm that the
probability of working in the small-business and formal sectors increases with the duration of migration, while the probability of working in the informal sector declines. Duration of migration appears to have a linear relationship with work status, since the marginal effect of the duration of migration–squared variable was not signiicant in most cases.
A reliance on age categories, rather than on age itself, in the second model gen-erated more interesting results than in the irst. We observed that the probability of working in the formal-casual sector is very high for young migrants. But this probability declines noticeably with age, while that of running a small business or of having either formal or informal work increases with age. In both regres-sions, we found that being male increases the probability, relative to females, of having formal-casual work and decreases the probability of having informal work. Higher levels of education are associated with better access to formal work, and, correspondingly, lower probabilities of working in the informal or the quasi-informal formal-casual sectors. There is little, if any, correlation between the num-ber of years of schooling and the likelihood of running a small business.
18 This evidence is consistent with Meng’s (1998 and 2001) indings for China – that is, that
an increase in work experience in the city increases the probability of migrants working in the formal sector.
TABLE 6 Multinomial Logit for Work Status of Household Heads and Spouses (migrant and non-migrant households combined)
Small Business Formal Formal-Casual Informal
Migration status
Very recent –0.072** –0.120*** 0.002 0.189***
Recent 0.031 0.038 –0.115*** 0.045*
Long-term 0.001 0.095*** –0.080*** –0.015
Fathers’ occupation
Agriculture 0.066*** –0.008 –0.057* –0.002
Public 0.015 0.041* –0.032 –0.024
Private 0.067 –0.017 –0.020 –0.031
Self-employed 0.110* –0.045 –0.096*** 0.031
Occupation
Professional 0.107* 0.120 –0.213*** –0.013
Trades/services 0.147*** –0.134** –0.168*** 0.156***
Other personal characteristics
Age 0.007 0.004 –0.015*** 0.004
Age squared 0.000 0.000 0.000* 0.000
Male 0.021 0.049 0.055** –0.125***
Years of schooling –0.004* 0.025*** –0.010** –0.010***
Location
Tangerang 0.014 –0.022 0.048*** –0.041***
Samarinda 0.140*** –0.104*** –0.045*** –0.009
Medan 0.039 –0.068*** 0.035** –0.007
Relatives
1–2 –0.040*** 0.046* 0.020 –0.027***
3–5 –0.015 –0.002 0.005 0.011
> 5 0.002 –0.036 0.032 0.000
Friends
1–2 0.035 –0.016 –0.007 –0.012
3–5 0.037 –0.031 –0.023 0.018
> 5 0.042 –0.059 0.010 0.006
Pseudo R2 0.12
N 2,347
Source: RUMiCI survey, 2009.
Note: The dependent variable is the probability of working in each of the four work-status categories. Marginal effects are relative to the reference individual: a female, non-migrant, blue-collar worker living in Makassar and with no contact with relatives or friends outside the household, and whose parents are either family workers or not working.
* p < 0.1; ** p < 0.05; *** p < 0.01
TABLE 7 Multinomial Logit for Work Status of Household Heads and Spouses (migrant households only)
Small Business Formal Formal-Casual Informal
Duration of migration
Duration 0.009** 0.005* –0.005 –0.009**
Duration squared –0.000** –0.000 0.000 0.000
Fathers’ occupation
Agriculture 0.022* –0.075 –0.018 0.072***
Public –0.011 –0.057 0.020 0.048
Private –0.021 0.037 0.033 0.025
Self-employed 0.052 –0.175*** –0.055** 0.177***
Occupation
Professional 0.084* 0.099 –0.149*** –0.034
Trades/services 0.171*** -0.174*** –0.173*** 0.177***
Other personal characteristics
Age 15–24 –0.085*** –0.375*** 0.520*** –0.062
Age 25–34 –0.056*** –0.099 0.243** –0.088***
Age 35–50 –0.026 –0.076 0.105** –0.003
Male 0.016*** 0.005 0.080*** –0.101***
Years of schooling –0.008** 0.036*** –0.013*** –0.016***
Location
Tangerang –0.036*** –0.025 0.091*** –0.029***
Samarinda 0.076*** –0.139*** 0.035* 0.028**
Medan –0.000 –0.009 0.014** –0.005
Relatives
1–2 –0.056*** 0.033 0.032 –0.009
3–5 –0.033*** –0.001 –0.005 0.039
> 5 –0.040 –0.043 0.087*** 0.004
Friends
1–2 0.063*** –0.022 –0.022 –0.018
3–5 0.034 0.057*** –0.049 –0.042
> 5 0.072 –0.066 0.005 –0.001
Pseudo R2 0.15
N 1,309
Source: RUMiCI survey, 2009.
Note: The dependent variable is the probability of working in each of the four work-status categories. Marginal effects are relative to the reference individual: a female, blue-collar worker, aged over 50, living in Makassar and with no contact with relatives or friends outside the household, and whose parents are either family workers or not working.
* p < 0.1; ** p < 0.05; *** p < 0.01
Both models indicate that the probability of being employed in the formal sec-tor or of operating a small business increases with the duration of migration, or, plausibly, as migrants adapt to the urban environment. The intensity of migrants’ social networks is positively related to their obtaining jobs in the small-business, formal and formal-casual sectors (table 7), even though the same variables were
signiicant
only for formal-sector occupations among the total sample (table 6).
Finally, we controlled for different work-status patterns by location, especially for the possibility of there being fewer opportunities for recent migrants to move into small business or new formal-sector jobs in the older cities of Medan and Makassar than in the younger cities of Samarinda and Tangerang. The only con-sistent pattern of difference was between the two younger cities (tables 6 and 7). Small-business participation is positively and signiicantly related to working in Samarinda, Indonesia’s most rapidly growing city, where one might expect there to be more opportunities for small enterprises. In contrast, the densely populated industrial city of Tangerang was more likely to attract people into casual employ-ment in the formal sector, perhaps relecting migrants’ greater willingness to undertake such low-status work in Java.
Earnings
Our analysis also compares the relationship of earnings to occupation among dif-ferent cohorts of migrants and non-migrants in Indonesia’s formal sector.19 Since LTMs and NMs are more heavily represented in the better-paid jobs, we expect them to achieve higher earnings than VRMs and RMs. In practice, however, individuals might select themselves into their preferred work-status category, depending on the level of earnings on offer. This implies that unobserved factors that affect the choice among types of work (and hence work status) are also likely to be correlated with the unobserved factors in the wage equation, suggesting a potential sample-selection bias in the ordinary least squares (OLS) estimator. To control for this potential sample selection bias, we used Lee’s selection-biased corrections, based on the multinomial logit from the previous estimate, when esti-mating the earnings equation.20
The dependent variable in this estimate is the log of hourly wages, while the explanatory variables are broadly the same as in the previous section. At least one explanatory variable likely to affect work status (in the irst stage of estimation) but unlikely to affect the outcome variable (earnings) is needed to identify the selection term(s) – otherwise the selection-biased corrections will provide similar results to the OLS estimates. Following Dimova and Gang (2007), a dummy vari-able for total inancial assets owned by the household head can act as a proxy for
19 We focus only on formal-sector earnings in this article. Earnings were quite variable
in all other sectors, and so the coeficients tended to be unstable in the earnings equation.
20 Lee (1983) extends the traditional Heckman (1979) selection-biased correction by us-ing the multinomial logit model (with more than two choices) in the selection equation. As pointed out by Trost and Lee (1984) and Bourguignon, Fournier and Gurgand (2007), Lee’s method assumes that the error terms in the selection equations and the error term in the outcome equation are jointly normally distributed. Lee’s selection term is equivalent to Heckman’s inverse Mills ratio: the ratio of the standard normal probability density func-tion and the standard normal cumulative distributive funcfunc-tion (Hilmer 2001; Zhang 2004).
household wealth; it can also be added to the wage equation as an identifying
variable
, to tackle selection bias (in the irst-stage of the estimation). The amount
of inancial assets owned by the household head is likely to affect work status, but it should not affect earnings directly: there is no signiicant difference between the earnings of household heads with a higher value of inancial assets and those with a lower value of inancial assets. The sample selection term (λ) is also signii -cant, providing evidence of a selection bias in the absence of a suitable correction process.
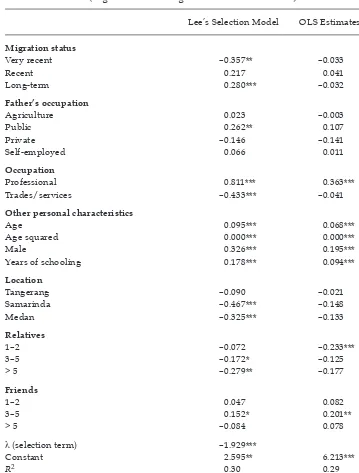
The irst column of table 8 presents the result of the earnings equation using Lee’s selection-biased corrections model; for the purpose of comparison, the OLS results (without the selection term) are presented in the second column. The coef-icient of the LTM dummy is estimated to be positive and signiicant: LTMs earn 28% more than the NM reference group (and the most of all migrant groups). In contrast, the coeficient for VRMs is negative and signiicant, indicating that VRMs working in the formal sector earn less than other groups, especially LTMs. These results support our work-status estimates, and are consistent with Meng’s (1998) inding that an increase in city work experience of one more year, in China, was associated with a 2.4% increase in migrants’ total earnings.
In general, we can conclude that LTMs are not only more likely to move into small-business and formal-sector jobs but are also more likely to earn more than other migrant groups. Given that LTMs also earned more than NMs, our study inds that migration beneits those who have remained in the city for long peri -ods: the duration of migration affects socio-economic mobility, as some other studies have found. Migration may have been more beneicial in Indonesia than in China, where long-term rural–urban migration has been tightly controlled.21 Restrictions preventing migrants from remaining in urban areas are likely to deny them opportunities for advancement. In Indonesia, restrictions of a different kind – namely, those preventing low-skilled migrants from offering themselves for work at wages below the regulated minimum – are likely to deny them access to formal-sector employment.
As with our multinomial logit analysis, the coeficients on most of the key con -trol variables in the earnings equation were found to be signiicant. In general, the results suggest that earnings rose at a decreasing rate with age, indicating that increased earnings are associated with greater work experience. Educational attainment (that is, years of schooling) also has a signiicant and positive inluence on the earnings of household heads and their spouses.22
WORK STATUS ACROSS GENERATIONS
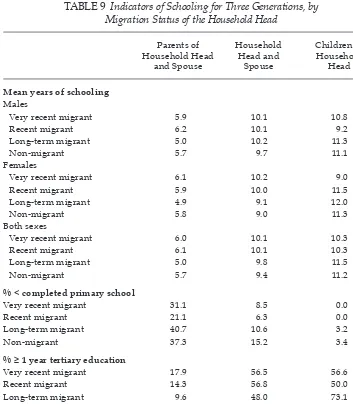
Owing partly to government investments, household heads and their spouses are much better educated than their parents (table 9). Adult children (especially females) have also achieved higher levels of schooling than their parents, though
21 Meng (1998) noted that most migrants stayed in a city for only a very short period, since
they could not obtain resident status and could not enjoy any of the social security beneits
provided to urban residents.
22 Other results are as might be expected. Females earn less than males in the formal sec-tor, while household heads and their spouses working as professionals, managers or clerks earned more than those in other occupations.
TABLE 8 Earnings Equation for Household Heads and Spouses in the Formal Sector (migrant and non-migrant households combined)
Lee’s Selection Model OLS Estimates a
Migration status
Very recent –0.357** –0.033
Recent 0.217 0.041
Long-term 0.280*** –0.032
Father’s occupation
Agriculture 0.023 –0.003
Public 0.262** 0.107
Private –0.146 –0.141
Self-employed 0.066 0.011
Occupation
Professional 0.811*** 0.363***
Trades/services –0.433*** –0.041
Other personal characteristics
Age 0.095*** 0.068***
Age squared 0.000*** 0.000***
Male 0.326*** 0.195***
Years of schooling 0.178*** 0.094***
Location
Tangerang –0.090 –0.021
Samarinda –0.467*** –0.148
Medan –0.325*** –0.133
Relatives
1–2 –0.072 –0.233***
3–5 –0.172* –0.125
> 5 –0.279** –0.177
Friends
1–2 0.047 0.082
3–5 0.152* 0.201**
> 5 –0.084 0.078
λ (selection term) –1.929***
Constant 2.595** 6.213***
R2 0.30 0.29
N 868
Source: RUMiCI survey, 2009.
Note: Dependent variable is ln hourly wage. Marginal effects are relative to the reference individual: a female, non-migrant, blue-collar worker living in Makassar and with no contact with relatives or friends outside the household, whose parents are either family workers or not working.
a OLS = ordinary least squares.
* p < 0.1; ** p < 0.05; *** p < 0.01
here
the differences are less pronounced. These advances are relected in a dra -matic decline across generations in the number of Indonesians not completing primary school. Table 9 also shows that there has been a large increase across generations in access to tertiary education.23 We therefore expect that children of migrants are more likely to be engaged in formal-sector work than their parents. To test this hypothesis, we compare the determinants of entry into different work-status categories among the children of migrants and non-migrants.
23 Note that whereas Van Ours and Veenman (2001) and Riphahn (2003) found that educa-tional outcomes of second-generation migrants lagged behind those of non-migrants, our data for Indonesia show very little difference between migrants and non-migrants in any of our three measures of educational attainment.
TABLE 9 Indicators of Schooling for Three Generations, by Migration Status of the Household Head
Parents of
Very recent migrant 5.9 10.1 10.8
Recent migrant 6.2 10.1 9.2
Long-term migrant 5.0 10.2 11.3
Non-migrant 5.7 9.7 11.1
Females
Very recent migrant 6.1 10.2 9.0
Recent migrant 5.9 10.0 11.5
Long-term migrant 4.9 9.1 12.0
Non-migrant 5.8 9.0 11.3
Both sexes
Very recent migrant 6.0 10.1 10.3
Recent migrant 6.1 10.1 10.3
Long-term migrant 5.0 9.8 11.5
Non-migrant 5.7 9.4 11.2
% < completed primary school
Very recent migrant 31.1 8.5 0.0
Recent migrant 21.1 6.3 0.0
Long-term migrant 40.7 10.6 3.2
Non-migrant 37.3 15.2 3.4
% ≥ 1 year tertiary education
Very recent migrant 17.9 56.5 56.6
Recent migrant 14.3 56.8 50.0
Long-term migrant 9.6 48.0 73.1
Non-migrant 19.8 49.4 69.4
Source: RUMiCI survey, 2009.
Around 68% of VRM household heads and their spouses are wage employees. This proportion shrinks steadily as the duration of migration increases, to around 54% for LTMs and NMs (table 10). Correspondingly, the proportion of those who are self-employed increases from 25% to around 40%. A very different pattern characterises the children of household heads and their spouses. The proportion of adult children in wage employment in migrant households increases from around two-thirds for VRMs and RMs combined to more than 75% for LTMs,24 compared with 83% for NMs.
Our earlier analysis also included the occupations of the fathers of household heads and their spouses, and their work status, as possible explanatory variables
in
the logit model. The indings were inconclusive: in relatively few cases were the father’s occupational categories signiicantly related to the work status of house -hold heads and their spouses. Moreover, we expected those whose fathers worked in the agricultural sector to be more likely to ind jobs in the informal sector; but this was supported only by the multinomial logit model (table 7), which examines the relationship between work status and the duration of migration. In contrast, the irst model (table 6) suggested that household heads whose fathers worked in the agricultural sector were more likely to be employed in small business.
Here we examine the relationship between the work status of (adult) children – whether living at home or outside the home – and that of household heads (usually their parents), using a simple logit model with just two categories of chil-dren’s work status (formal and informal).25 The work-status dependent variable is now expressed in binary form: work status is equal to one if the child is working in the formal sector (deined as working for wages), and equal to zero if the child is working in the informal sector (deined as working for remuneration other than wages). The explanatory variables used in this regression are similar to those in the previous section, except that the work status of household heads replaces the work status of fathers.
In this model, the estimated probabilities of children engaging in the formal sec-tor were signiicantly lower for those in VRM households, in particular, but also for those in LTM households, relative to the NM reference group (table 11). This inding contrasts with the results for LTM household heads and spouses (table 6), who were more likely to be engaged in the formal sector than those in NM households. Migration status aside, children appear to prefer to work in the same sectors as their household heads; those whose parents worked in either formal or formal-casual jobs were more likely to be engaged in the formal sector. It is inter-esting that both sons and daughters of household heads seem to have a similar probability of obtaining formal-sector employment, and that years of schooling do not seem to be a signiicant determinant of the probability of obtaining such work (owing, perhaps, to a lack of variation in the extent of schooling of children across migration categories, as shown in table 9).
In testing the distribution of children’s employment between formal and infor-mal sectors for migrant households only, we found that the migration status of
24 We ignore the seemingly very different data for RM households, since the small num-ber of observations suggests that these are unreliable.
25 Returning to this simple formal–informal dichotomy is necessary because we do not have detailed information on the work status of children living outside their parents’ home.
TABLE 10 Work Status of Household Heads, Spouses and Adult Children, by Migration Status
(%)
Household Head/ Spouse
Children of Household Head/
Spouse
Very recent migrant
Very recent and recent migrant a
Wage employee 67.7 64.3
Private sector 66.2 57.2
Civil servant, military, police 1.5 7.1
Self-employed 25.0 32.1
Family worker 7.3 3.6
N 260 28
Recent migrant
Wage employee 62.2
Private sector 58.6
Civil servant, military, police 3.6
Self-employed 30.6
Family worker 7.2
N 111
Long-term migrant
Wage employee 54.2 75.3
Private sector 43.9 70.4
Civil servant, military, police 10.3 4.9
Self-employed 40.3 16.1
Family worker 5.5 8.6
N 939 348
Non-migrant
Wage employee 54.5 82.9
Private sector 47.8 79.0
Civil servant, military, police 6.7 3.9
Self-employed 40.1 12.2
Family worker 5.4 4.9
N 1,037 386
Source: RUMiCI survey, 2009.
a Very recent and recent migrant groups aggregated because of small numbers in each group.
TABLE 11 Logit for Formal-Sector Work Status of Children (migrant and non-migrant households)
Migration status Location
Very recent –1.389** Tangerang –0.067
Recent –0.955 Samarinda 0.189
Long-term –0.481** Medan –0.327
Work status of household head Relatives
Formal sector 0.505** 1–2 –0.003
Formal-casual 0.853*** 3–5 –0.442*
Small business –0.346 > 5 0.208
Other personal characteristics Friends
Age –0.176** 1–2 –0.072
Age squared 0.020 3–5 –0.146
Male 0.021 > 5 0.521*
Years of schooling 0.030
Constant 4.301***
Pseudo R2 0.09
N 761
Source: RUMiCI project survey, 2009.
Note: The dependent variable is the probability of working in the formal sector. Marginal effects are relative to the reference individual: a female, adult child living in a non-migrant, informal-sector household in Makassar, and with no contact with relatives or friends outside the household.
* p < 0.1; ** p < 0.05; *** p < 0.01
the
household head was not signiicant in determining the probability of children working in the formal sector (results not presented here). Nevertheless, consistent with the above indings, if household heads worked in the formal-casual sector, this appears to have encouraged their children to ind a job in the formal sector. The children of migrants engaged in small business were also less likely to work in the formal sector (which also includes some small-business activities, accord-ing to our amended deinition).
CONCLUSIONS
This article has focused on the determinants of occupational change and associ-ated earnings among different cohorts of migrants moving from rural areas to cities in Indonesia. The literature suggests that the characteristics both of migrants and of the destination labour market help to deine the level of socio-economic mobility. Where labour markets are less regulated, or where economic growth is rapid, mobility has tended to be greater than when they are not.
Our indings for Indonesia conirm that rural–urban migration is an important source of occupational mobility. In answering the question posed in the title of this article, our analysis suggests that migrants do not get stuck in the informal sector. Moreover, the iner distinction of work-status categories – going beyond the usual formal–informal distinction – has helped us to identify the avenues of
mobility more precisely than in previous studies. Those migrants who moved before the AFC were considerably more likely to hold higher-paying, regular-wage jobs in the formal sector than recent and very recent migrants. They were also more likely to be found running small businesses than very recent migrants, who worked mostly for lower wages and in the informal sector.
We
also found that the outcomes of migrants’ job searches are signiicantly related to individuals’ characteristics (especially schooling, but also their sex and their participation in social networks). However, differences by location (across the different cities) were not systematic.
The group of recent migrants who moved to the cities during and immediately after the AFC displayed occupational characteristics more similar to VRMs than to LTMs. The coeficient for movement to the informal sector was positive and signiicant, although with a smaller marginal effect, suggesting a continuing pro -cess of movement into better-paid work. The regressions also suggest that higher educational attainment has been signiicant in helping both migrants and non-migrants obtain formal-sector jobs. In short, the data suggest that rural–urban migration in Indonesia can lead to considerable occupational mobility.
The RUMiCI study was designed to compare labour-market outcomes in two very different institutional settings: an economy where migration is relatively free of controls (Indonesia) and one where it is tightly controlled by the state (China). Our indings broadly support the proposition that the former beneits migrants more than the latter, at least from the standpoint of occupational mobility.26 However, Indonesia’s labour-market regulations that seem to have discouraged employment in the formal sector (where these regulations have their strongest impact) may have reduced the extent of this beneit.
We should caution that our study does not say anything about the levels of, or changes in, absolute earnings or educational attainment as a result of migration in Indonesia, compared with China’s very different urban environments. Indo-nesia has many urban slums, for example, whereas China has worked to contain urban sprawl. We might expect Indonesian migrants to fare less well than Chi-nese migrants on this score, but that is a subject for another study. As far as the comparison between migrants and non-migrants in the Indonesian setting is con-cerned, other studies based on the RUMiCI survey suggest that our indings are robust to broader indicators of welfare, such as the health status of migrants and their children, and the education of migrant children (Resosudarmo et al. 2010; Resosudarmo and Suryadarma 2011).
We add three other qualiications to our indings. Most important, we have not presented information on the job histories of migrants. The 2010 RUMiCI survey collected more detailed data on occupational histories of migrants and non-migrants, and therefore should be able to throw further light on whether most LTMs improved their occupational status while in the city. Second, there is a problem of selection bias – as with most studies of migration – since data were collected from only those migrants who remained in the city, and not from those who returned to their villages. Third, although we did compare the work status
26 For example, Frijters, Lee and Meng (2010), as part of the RUMiCI project, found that
after controlling for a range of personal characteristics, urban residents earn signiicantly
more than the temporary rural–urban migrants, or hukou holders, in urban China.
of different migrant cohorts, we were not able to determine the extent to which LTMs concentrated in formal-sector jobs because of better labour-market condi-tions before the AFC, rather than simply because of migration duration. This sub-ject, too, should be the focus of further research.
REFERENCES
Alisjahbana, A. and Manning, C. (2010) ‘Making it in the city: recent and long-term migrants in the urban labour market in Indonesia,’ in The Great Migration: Rural–Urban Migration in China and Indonesia, ed. Xin Meng et al., Edward Elgar, Cheltenham, UK: 194–221. Bourguignon, F., Fournier, M. and Gurgand, M. (2007) ‘Selection biased corrections based
on the multinomial logit model’, Journal of Economic Surveys 21 (1): 174–205.
Clemens, M. (2010) ‘A labor mobility agenda for development’, Working Paper No. 201, Center for Global Development, Washington DC.
Constant, A. and Zimmermann K.F. (2003) ‘Occupational choice across generations’, Dis-cussion Paper No. 975, Institute for the Study of Labor, Bonn.
Dimova, R. and Gang, I.N. (2007) ‘Self-selection and wages during volatile transition’, Jour-nal of Comparative Economics 35 (3): 612–29.
Effendi, T.N., Mujiyani, Itriyati, F., Darmawan, D.A. and Widhyharto, D.S. (2010) ‘Assess-ing the welfare of migrant and non-migrant households in four Indonesian cities: some demographic, social and labour force characteristics’, in The Great Migration: Rural– Urban Migration in China and Indonesia, ed. Xin Meng et al., Edward Elgar, Cheltenham, UK: 153–77.
Frijters, P., Lee, L. and Meng, X. (2010) ‘Jobs, working hours and remuneration packages for migrant and urban workers,’ in The Great Migration: Rural–Urban Migration in China and Indonesia, ed. Xin Meng et al., Edward Elgar, Cheltenham, UK: 47–73.
Harper, B. and Haq, M. (1997) ‘Occupational attainment of men in Britain’, Oxford Economic Papers 49 (4): 638–50.
Harris, J.R. and Todaro, M.P. (1970) ‘Migration, unemployment, and development: a two sector analysis’, American Economic Review 60 (1): 126–42.
Hart, K. (1973) ‘Informal income activities and informal employment in Ghana,’ Journal of Modern African Studies 11 (1): 61–89.
Heckman
, J.J. (1979) ‘Sample selection bias as a speciication error’, Econometrica 47 (1): 153–61.
Hilmer, M.J. (2001) ‘A comparison of alternative speciications of the college attendance
with an extension to two-stage selecivity-correction model’, Economics of Education Review 20 (3): 263–78.
Hugo, G. (1978) Population Mobility in West Java, Gadjah Mada University Press, Yogya-karta.
Hugo, G. (2000) ‘The impact of the crisis on internal population movement in Indonesia’, Bulletin of Indonesian Economic Studies 36 (2): 15–38.
IADB (Inter-American Development Bank) (2004) Good Jobs Wanted: Labor Markets in Latin America, Economic and Social Progress Report, IADB, Washington DC.
Ianelli, C. (2002) ‘Parental education and young people’s educational and labour market outcomes: a comparison across Europe’, MZES Working Paper No. 45, University of Mannheim.
Katz, E. and Stark, O. (1986) ‘Labor migration and risk aversion in less developed coun-tries’, Journal of Labor Economics 4 (1): 134–49.
Kong, S.T. and Effendi, T.N. (2011) ‘Occupational choice and mobility among migrants to four cities,’ in Employment, Living Standards and Poverty in Contemporary Indonesia, eds. C. Manning and S. Sumarto, Institute of South East Asian Studies, Singapore: 134–60.
Lall, S.V., Selod, H. and Shalizi, Z. (2006) ‘Rural–urban migration in developing countries: a
survey of theoretical predictions and empirical indings’, World Bank Policy Research
Working Paper No. 3915, World Bank, Washington DC.
Lee, L.F. (1983) ‘Generalized econometric models with selectivity’, Econometrica 51 (2): 507–12.
Lewis, W.A. (1954) ‘Economic development with unlimited supplies of labour,’ Manchester School of Economic and Social Studies 22 (2): 139–91.
Lucas, R.E.B. (1997) ‘Internal migration in developing countries’, in Handbook of Population and Family Economics, eds. M.R. Rosenzweig and O. Stark, Elsevier BV, Amsterdam: 721–98.
Maloney, W.F. (1998) ‘Are LDC labor markets dualistic?’, World Bank, Washington DC, mimeo.
Manning, C. (1987) ‘Rural economic change and labour mobility: a case study from West Java’, Bulletin of Indonesia Economic Studies 23 (3): 52–79.
Manning, C. (1998) Indonesian Labour in Transition: An East Asian Success Story?, Cambridge University Press, Cambridge, UK.
Manning, C. (2008) ‘The political economy of reform: labour after Soeharto’, Indonesian Studies Working Paper No. 6, University of Sydney, Sydney.
Manning, C. and Roesad, K. (2007) ‘The Manpower Law of 2003 and its implementing regulation: genesis, key articles, and potential impact’, Bulletin of Indonesian Economic Studies 43 (1): 59–86.
Mazumdar, D. (1994) ‘Urban poverty and labor markets’, in Urban Poverty in Asia: A Survey of Critical Issues, ed. E. Pernia, Oxford University Press, Hong Kong: 81–125.
Meng, X. (1998) ‘Gender occupational segregation and its impact on the gender wage dif-ferential among rural–urban migrants: a Chinese case study’, Applied Economics 30 (6): 741–52.
Meng, X. (2001) ‘The informal sector and rural–urban migration: a Chinese case study’, Asian Economic Journal 15 (1): 71–89.
Meng, X and Manning, C. (2010) ‘The great migration in China and Indonesia: trends and institutions’, in The Great Migration: Rural–Urban Migration in China and Indonesia, ed. Xin Meng et al., Edward Elgar, Cheltenham, UK: 1–22.
Resosudarmo, B.P. and Suryadarma, D. (2011) ‘The effect of childhood migration on human capital accumulation: evidence from rural–urban migrants in Indonesia’, Paper presented in the Arndt–Corden Department of Economics, Crawford School of Public Policy, Australian National University, 14 June.
Resosudarmo, B.P., Suryahadi, A., Purnagunawan, R., Yumna, A. and Yusrina, A. (2010) ‘The socio-economic and health status of rural–urban migrants in Indonesia’, in The Great Migration: Rural–Urban Migration in China and Indonesia, ed. Xin Meng et al., Edward Elgar, Cheltenham, UK: 178–93.
Resosudarmo, B.P., Yamauchi, C. and Effendi, T.N. (2010) ‘Rural–urban migration in Indo-nesia: survey design and implementation’, in The Great Migration: Rural–Urban Migra-tion in China and Indonesia, ed. Xin Meng et al., Edward Elgar, Cheltenham, UK: 222–4. Riphahn, R.T. (2003) ‘Cohort effects in the educational attainment of second generation
immigrants in Germany: an analysis of census data’, Journal of Population Economics 16 (4): 711–37.
Steele, R. (1980) ‘Origin and occupational mobility of lifetime migrants to Surabaya and East Java’, PhD diss., Australian National University, Canberra.
Trost R. and Lee, L.F. (1984) ‘Technical training and earnings: a polychotomous model with selectivity’, Review of Economics and Statistics 66 (1): 151–6.
University of Sussex (2009) Making Migration Work for Development, Development Research Centre on Migration, Globalisation and Poverty, University of Sussex, Brighton.
Van Ours J.C and Veenman J. (2001) ‘The educational attainment of second generation immigrants in the Netherlands’, Discussion Paper No. 297, Institute for the Study of Labor, Bonn.
Welch, F. (1974) ‘Minimum wage legislation in the United States’, Economic Inquiry 12 (3): 285–318.
World Bank (2009) World Development Report 2009: Reshaping Economic Geography, World Bank, Washington DC.
World Bank (2010) The Indonesia Jobs Report, World Bank, Jakarta.
Zhang, H. (2004) ‘Self-selection and wage differentials in urban China: a polychotomous model with selectivity’, Massachusetts Institute of Technology, Boston, mimeo.
Zhao, Y. (1999) ‘Labor migration and earnings differences: the case of rural China’, Eco-nomic Development and Cultural Change 47 (4): 767–82.
Zhao, Y. (2003) ‘The role of migrant networks in labor migration: the case of China’, Con-temporary Economic Policy 21 (4): 500–11.