Democratic Republic of Timor-Leste
Ministry of Finance
Executive Summary
By the 31
stMarch 2014, the General Government of Timor-Leste (GGoTL),
including the Petroleum Fund (PF) ran a net operating balance of $578.6 million
and had a net lending capacity of $567.2
million. Although this is a strong fiscal
position, the GGoTL without the PF ran a net operating balance of -$47.5 million.
Therefore the GGoTL is still reliant on the PF and cash balance to sustain its
current level of operations.
General Directorate State Finance
Economy Policy Directorate
QUARTERLY FISCAL BULLETIN
January
–
March 2014
GOVERNMENT FINANCE STATISTICS (GFS)
Quarterly Fiscal Bulletin Jan-Mar 2014 Page 2
1.
Revenues
At the end of the first quarter of 2014, total revenues for the GGoTL and the PF1 amounted to $664.7million. This was divided into $35.5 million from non-oil revenues and $629.2 million from oil revenues.
1.1 Non-oil Revenues
Non-oil revenues are composed of taxes, grants and other revenues. However no grants were received by GGoTL during the first quarter of 2014.
Non-oil taxes are the greatest source of revenue in the domestic non-oil economy (73% of total non-oil revenues) totalling $26.0 million during the first quarter of 2014. These are divided into:
Taxes on income, profits and capital gains were 49.3% higher at the end of March 2014 than for the same period of 2013, reaching $10.0 million at the end of the first quarter of 2014.
Taxes on goods and services totalled $12.9 million at the end of the first quarter of 2014 and were thus the largest source of tax revenue. This collection was 11.2% higher than the $11.6 million collected in 2013. The increase was mostly due to greater excise tax collection and particularly social game receipt collection (which increased from $0.002 million in the first quarter of 2013 to $0.1 million in the first quarter 2014).
Taxes on international trade and transactions were 23.1% higher at the end of the first quarter of 2014 than in the first quarter of 2013 and amounted to $3.2 million. The increase was due to a rise of 22.4% in the collection of import duties.
Other non-tax revenue collected was 6.7% higher than the total collection for the first quarter of 2013, totalling $9.5 million by the end of March 2014.
1.2 Oil Revenues
Oil revenues are the major source of revenues in Timor-Leste (representing 95% of total oil and non-oil revenues). These are divided into:
Taxes in the first quarter of 2014 totalled $229.4 million, mostly due to income taxes recorded under taxes on income, profits and capital gains.
Other revenue included profit from oil, first tranche petroleum, interest, trust and dividend income and totalled $399.8 million by 31st March 2014. This was mostly due to first tranche petroleum which reached $217.1 million at the end of March 2014.
Quarterly Fiscal Bulletin Jan-Mar 2014 Page 3
2.
Expenses
Expenses incurred in the first quarter of 2014 by the GGoTL and the PF amounted to $86.2 million. This was mostly incurred by the GGoTL which spent $83.0million, whilst $3.1million were expenditures in the PF.
2.1 General Government Expenditures
Expenditure categories for GGoTL are composed of:
Compensation of Employees was 16.5% higher than the $30.9 million spent in the first quarter 2013, totalling $36.0 million by the 31st March 2014.
Use of Goods & Services reached $24.7 million by the end of the first quarter of 2014 (almost equal to that spent in the same quarter of 2013) and represented 29.8% of total expenses.
Social benefits totalled $16.5 million in the end of the first quarter of 2014, 22.6% higher that was recorded in the same quarter of 2013.
Other expenses reached $5.9 million at the end of the first quarter of 2014, much higher than the $0.04 million spent 2013. This large increase was due to the transfer of public grants worth $4.9 million.
2.2 PF Expenditures
PF expenses reached $3.1 million in the first quarter of 2014 and were solely composed of management costs.
3.
Net Operating Balance
The net operating balance is calculated as revenues minus expenses and it shows the Gover e t’s a ility to sustai its current level operations, given revenues and expenses.2
At the end of the first quarter of 2014, the GGoTL and the PF were running a net operating surplus of $578.6 million. However petroleum revenues played a key role i the GGoTL’s fis al surplus, as the net operating balance for the GGoTL without the PF and the PF Grants was -$47.5 million3 by the 31st March 2014.
4.
Net Acquisition of Non-Financial Assets
Net Acquisition of Non-Fi a ial Assets re ords tra sa tio s that ha ge GGoTL’s holdi gs of non-financial assets. It is broadly equivalent to capital expenditure as recorded in the Charter of Accounts in Timor-Leste.
At the end of March 2014 total acquisition of non-financial assets for the GGoTL including the PF stood at $11.3million. However this expense was solely incurred by the GGoTL. Net acquisition of non-financial assets was 5% lower than the first quarter of 2013.
5.
Net Lending/Borrowing
Net Lending/Borrowing is calculated as total expenditures minus revenues. Net lending for the GGoTL with the PF was $474.8 million at the end of the first quarter of 2014, taking into account the combination of total revenue, expenditures and acquisition of non-financial assets. This means that the GGoTL with the PF incurred a surplus which is being invested in financial assets.
2
In Timor-Leste, Gross and Net Operating Balance are the same, as there is no inventory for depreciation of fixed capital to date.
Quarterly Fiscal Bulletin Jan-Mar 2014 Page 4
6.
Net Acquisition of Financial Assets
The i rease i the Gover e t’s holdi gs of fi a ial assets is re orded u der et acquisition of financial assets. In the case of Timor-Leste, the net lending capacity is being invested, mostly through the PF, in a range of financial assets including shares, securities, deposits, cash and other equities.
At the close of the first quarter of 2014, the net acquisition of financial assets for the GGoTL and the PF was $474.8 million. This was composed of two parts: $58.8 million was withdrawn from the CFTL cash balance to finance the gap between expenses and revenues in the GGoTL (this explains why the value is negative for currency and deposits in the tables in the annex) and $533.6 million invested in financial instruments in the PF.
Finally the unrealized market value of financial assets is recorded under Other Economic Flows and reached $92.4 million by the end of March 2014. This is recorded separately to the net acquisition of financial assets, as it shows changes in value in PF investments and thus results in the total acquisition of financial assets being larger than net lending in the tables in the annex.
7.
Financial Conclusion
Quarterly Fiscal Bulletin Jan-Mar 2014 Page 5
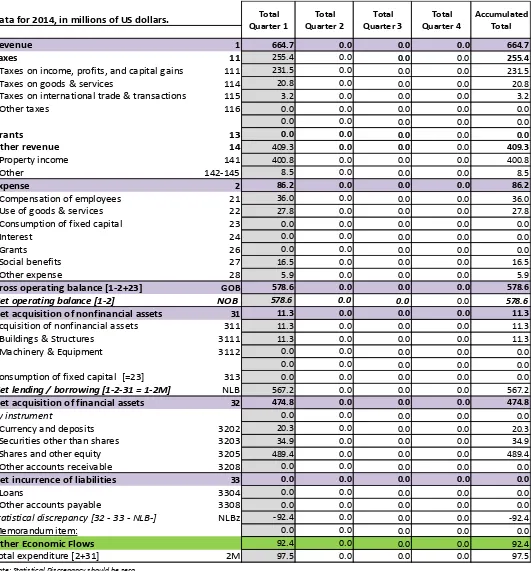
Annex: Statement of Total Government Operations
Figure 1. Accumulated Statement of Government Operations Q1 2014 (GGoTL and PF)
Data for 2014, in millions of US dollars.
Revenue 1 664.7 0.0 0.0 0.0 664.7
Taxes 11 255.4 0.0 0.0 0.0 255.4
Taxes on income, profits, and capital gains 111 231.5 0.0 0.0 0.0 231.5
Taxes on goods & services 114 20.8 0.0 0.0 0.0 20.8
Taxes on international trade & transactions 115 3.2 0.0 0.0 0.0 3.2
Other taxes 116 0.0 0.0 0.0 0.0 0.0
0.0 0.0 0.0 0.0 0.0
Grants 13 0.0 0.0 0.0 0.0 0.0
Other revenue 14 409.3 0.0 0.0 0.0 409.3
Property income 141 400.8 0.0 0.0 0.0 400.8
Other 142-145 8.5 0.0 0.0 0.0 8.5
Expense 2 86.2 0.0 0.0 0.0 86.2
Compensation of employees 21 36.0 0.0 0.0 0.0 36.0
Use of goods & services 22 27.8 0.0 0.0 0.0 27.8
Consumption of fixed capital 23 0.0 0.0 0.0 0.0 0.0
Interest 24 0.0 0.0 0.0 0.0 0.0
Grants 26 0.0 0.0 0.0 0.0 0.0
Social benefits 27 16.5 0.0 0.0 0.0 16.5
Other expense 28 5.9 0.0 0.0 0.0 5.9
Gross operating balance [1-2+23] GOB 578.6 0.0 0.0 0.0 578.6
Net operating balance [1-2] NOB 578.6 0.0 0.0 0.0 578.6
Net acquisition of nonfinancial assets 31 11.3 0.0 0.0 0.0 11.3
Acquisition of nonfinancial assets 311 11.3 0.0 0.0 0.0 11.3
Buildings & Structures 3111 11.3 0.0 0.0 0.0 11.3
Machinery & Equipment 3112 0.0 0.0 0.0 0.0 0.0
0.0 0.0 0.0 0.0 0.0
Consumption of fixed capital [=23] 313 0.0 0.0 0.0 0.0 0.0
Net lending / borrowing [1-2-31 = 1-2M] NLB 567.2 0.0 0.0 0.0 567.2
Net acquisition of financial assets 32 474.8 0.0 0.0 0.0 474.8
by instrument 0.0 0.0 0.0 0.0 0.0
Currency and deposits 3202 20.3 0.0 0.0 0.0 20.3
Securities other than shares 3203 34.9 0.0 0.0 0.0 34.9
Shares and other equity 3205 489.4 0.0 0.0 0.0 489.4
Other accounts receivable 3208 0.0 0.0 0.0 0.0 0.0
Net incurrence of liabilities 33 0.0 0.0 0.0 0.0 0.0
Loans 3304 0.0 0.0 0.0 0.0 0.0
Other accounts payable 3308 0.0 0.0 0.0 0.0 0.0
Statistical discrepancy [32 - 33 - NLB-] NLBz -92.4 0.0 0.0 0.0 -92.4
Memorandum item: 0.0 0.0 0.0 0.0 0.0
Other Economic Flows 92.4 0.0 0.0 0.0 92.4
Total expenditure [2+31] 2M 97.5 0.0 0.0 0.0 97.5
Quarterly Fiscal Bulletin Jan-Mar 2014 Page 6
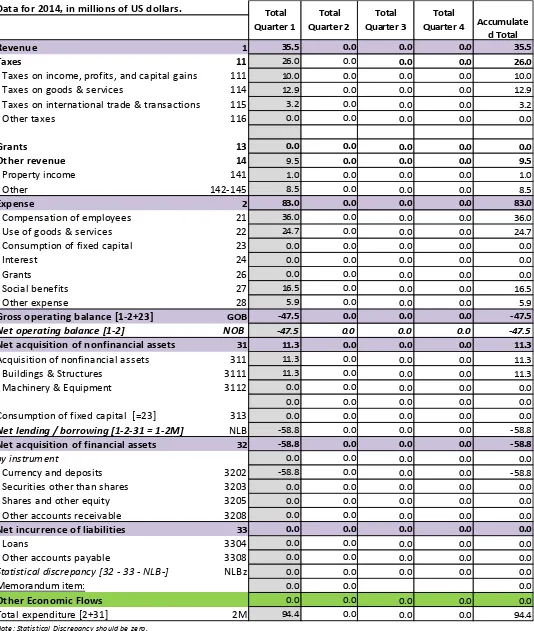
Data for 2014, in millions of US dollars.
Revenue 1 35.5 0.0 0.0 0.0 35.5
Taxes 11 26.0 0.0 0.0 0.0 26.0
Taxes on income, profits, and capital gains 111 10.0 0.0 0.0 0.0 10.0
Taxes on goods & services 114 12.9 0.0 0.0 0.0 12.9
Taxes on international trade & transactions 115 3.2 0.0 0.0 0.0 3.2
Other taxes 116 0.0 0.0 0.0 0.0 0.0
Grants 13 0.0 0.0 0.0 0.0 0.0
Other revenue 14 9.5 0.0 0.0 0.0 9.5
Property income 141 1.0 0.0 0.0 0.0 1.0
Other 142-145 8.5 0.0 0.0 0.0 8.5
Expense 2 83.0 0.0 0.0 0.0 83.0
Compensation of employees 21 36.0 0.0 0.0 0.0 36.0
Use of goods & services 22 24.7 0.0 0.0 0.0 24.7
Consumption of fixed capital 23 0.0 0.0 0.0 0.0 0.0
Interest 24 0.0 0.0 0.0 0.0 0.0
Grants 26 0.0 0.0 0.0 0.0 0.0
Social benefits 27 16.5 0.0 0.0 0.0 16.5
Other expense 28 5.9 0.0 0.0 0.0 5.9
Gross operating balance [1-2+23] GOB -47.5 0.0 0.0 0.0 -47.5
Net operating balance [1-2] NOB -47.5 0.0 0.0 0.0 -47.5
Net acquisition of nonfinancial assets 31 11.3 0.0 0.0 0.0 11.3
Acquisition of nonfinancial assets 311 11.3 0.0 0.0 0.0 11.3
Buildings & Structures 3111 11.3 0.0 0.0 0.0 11.3
Machinery & Equipment 3112 0.0 0.0 0.0 0.0 0.0
0.0 0.0 0.0 0.0 0.0
Consumption of fixed capital [=23] 313 0.0 0.0 0.0 0.0 0.0
Net lending / borrowing [1-2-31 = 1-2M] NLB -58.8 0.0 0.0 0.0 -58.8
Net acquisition of financial assets 32 -58.8 0.0 0.0 0.0 -58.8
by instrument 0.0 0.0 0.0 0.0 0.0
Currency and deposits 3202 -58.8 0.0 0.0 0.0 -58.8
Securities other than shares 3203 0.0 0.0 0.0 0.0 0.0
Shares and other equity 3205 0.0 0.0 0.0 0.0 0.0
Other accounts receivable 3208 0.0 0.0 0.0 0.0 0.0
Net incurrence of liabilities 33 0.0 0.0 0.0 0.0 0.0
Loans 3304 0.0 0.0 0.0 0.0 0.0
Other accounts payable 3308 0.0 0.0 0.0 0.0 0.0
Statistical discrepancy [32 - 33 - NLB-] NLBz 0.0 0.0 0.0 0.0 0.0
Memorandum item: 0.0 0.0 0.0
Other Economic Flows 0.0 0.0 0.0 0.0 0.0
Total expenditure [2+31] 2M 94.4 0.0 0.0 0.0 94.4
Note: Statistical Discrepancy should be zero.
Quarterly Fiscal Bulletin Jan-Mar 2014 Page 7
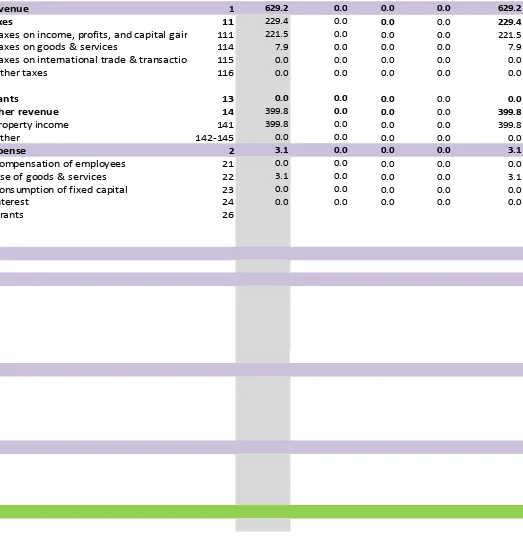
Data for 2014, in millions of US dollars.
Revenue 1 629.2 0.0 0.0 0.0 629.2
Taxes 11 229.4 0.0 0.0 0.0 229.4
Taxes on income, profits, and capital gains 111 221.5 0.0 0.0 0.0 221.5
Taxes on goods & services 114 7.9 0.0 0.0 0.0 7.9
Taxes on international trade & transactions 115 0.0 0.0 0.0 0.0 0.0
Other taxes 116 0.0 0.0 0.0 0.0 0.0
Grants 13 0.0 0.0 0.0 0.0 0.0
Other revenue 14 399.8 0.0 0.0 0.0 399.8
Property income 141 399.8 0.0 0.0 0.0 399.8
Other 142-145 0.0 0.0 0.0 0.0 0.0
Expense 2 3.1 0.0 0.0 0.0 3.1
Compensation of employees 21 0.0 0.0 0.0 0.0 0.0
Use of goods & services 22 3.1 0.0 0.0 0.0 3.1
Consumption of fixed capital 23 0.0 0.0 0.0 0.0 0.0
Interest 24 0.0 0.0 0.0 0.0 0.0
Grants 26
0.0
Quarterly Fiscal Bulletin Jan-Mar 2014 Page 8
Key Terminology
Compensation of employees are remuneration in cash or kind, payable to an employee in return for work done and social insurance contributions made by a general government unit on behalf of its employees. Compensation of employees is incurred on a monthly basis in Timor-Leste.
Expenses include all transactions that decrease the net worth of the general government sector. Expenditures are financed from the ESI, excess withdrawals from the PF, loans or the use of cash balance.
General Government of Timor-Leste is the combination of the Consolidated Fund (CFTL), Human Capital and Development Fund (HCDF) and the Infrastructure Fund in Timor-Leste.
Grants: are non-compulsory current or capital transfers from one government unit to another government unit or an international organization. These are divided into estimated sustainable income (ESI) and excess withdrawals.
Gross Operating Balance is the revenue minus expenses other than consumption of fixed capital. It indicates whether the government is able to sustain its current level of operations and ideally should portray a surplus. However consumption of fixed capital is not measured in Timor-Leste, therefore Gross Operating Balance is equal to Net Operating Balance.
Net lending/borrowing is a balancing item defined as the net acquisition of all financial assets less the net incurrence of all liabilities from transactions. It is thus a summary measure indicating the extent to which GGoTL is either putting financial resources at the disposal of other sectors in the economy or utilizing the financial resources generated by other sectors.
Net Operating Balance is equal to revenue minus expenses and indicates whether the government is able to sustain its current level of operations.
Other Revenue includes a variety of forms of revenue earned by GGoTL including property income, sales of goods, fines & penalties and other miscellaneous revenue.
Revenues are all transactions that increase the net worth of general government sector and exclude domestic and external borrowing. Revenues tend to increase during the last period of the year, due to the collection of accumulated taxes.
Social benefits are current transfers to households to provide for needs arising from events such as sickness, unemployment, retirement, housing or family circumstances.
Taxes on goods & services are taxes levied on the production, extraction, sale, transfer, leasing or delivery of goods and rendering of services.
Taxes on income, profits, and capital gains are composed of corporate taxes in Timor-Leste.
Quarterly Fiscal Bulletin Jan-Mar 2014 Page 9
Transactions in financial assets and liabilities record financial transactions. I.e. they record transactions that change a
gover e t’s holdi gs of fi a ial assets a d lia ilities. I Timor-Leste financial assets are all composed of currency and deposit.
Transactions in nonfinancial assets a d lia ilities re ord tra sa tio s that ha ge a gover e t’s holdings of nonfinancial assets. In Timor-Leste these assets are classified as Buildings & Structures and Machinery & Equipment.