Student Responses to Merit
Scholarship Retention Rules
Christopher M. Cornwell
Kyung Hee Lee
David B. Mustard
A B S T R A C T
A common justification for state-sponsored merit scholarships like Georgia’s HOPE program is to promote academic achievement. However, grade-based retention rules encourage other behavioral responses. Using longitudinal records of enrolled undergraduates at the University of Georgia between 1989 and 1997, we estimate the effects of HOPE on course-taking, treating nonresidents as a control group. First, we find that HOPE decreased full-load enrollments and increased course withdrawals among resident fresh-men. Second, the scholarship’s influence on course-taking behavior is concentrated on students whose predicted freshmen GPAs place them on or below the scholarship-retention margin. Third, HOPE substantially increased summer school credits.
I. Introduction
Introduced in 1993 and funded by a state lottery, Georgia’s HOPE (Helping Outstanding Pupils Educationally) Scholarship covers tuition, mandatory
Christopher M. Cornwell is a professor of economics and senior fellow at the Institute of Higher Education at the University of Georgia. David B. Mustard is an associate professor of economics and a senior fellow at the Institute of Higher Education at the University of Georgia. Kyung Hee Lee is a BK research professor of economics at Sogang University in Seoul, Korea. We thank Arthur Snow and work-shop participants at Alabama, Clemson, Columbia Teachers College, Cornell, Emory, George Mason, Georgia State, Colorado-Denver, and the University of Georgia Institute of Higher Education for their helpful comments. Earlier versions of this paper were also presented at the 2003 American Economic Association meetings and the 2004 American Education Finance Association meetings. Cornwell and Mustard gratefully acknowledge the support of the NSF under grant SES-9986469, American Educational Research Association, and Terry College of Business through its Terry-Sanford Research Grant Program. Lee’s research was funded in part by the American Education Finance Association. The data used in this article can be obtained beginning May 2006 through April 2009 from Christopher M. Cornwell at Department of Economics, Terry College of Business, University of Georgia, Athens, GA or cornwl@terry.uga.edu.
[Submitted July 2003; accepted February 2005]
ISSN 022-166X E-ISSN 1548-8004 © 2005 by the Board of Regents of the University of Wisconsin System
fees, and a book allowance for all eligible degree-seeking high school graduates at any of Georgia’s public postsecondary institutions. The award value has accounted for at least 40 percent of the total cost of attendance at the state’s top public universities, amounting to $4,378 per student in the 2003–2004 academic year. HOPE recipients attending in-state private institutions receive a fixed payment of $3,000. To qualify for the scholarship, an entering freshman must have graduated from a Georgia high school since 1993 with at least a “B” average and be a Georgia resident. Eligibility is not restricted by family income.1To retain the scholarship a student must have a 3.0 cumulative grade-point average (GPA) at regular credit-hour checkpoints. Through July 2004, more than $1.4 billion in scholarship funds have been disbursed to more than 600,000 students.
Since 1993, 15 other states have followed Georgia, adopting their own HOPE-style merit scholarships. These actions have typically been justified in three ways. One is to increase college enrollment; another is to keep the best and brightest from going to school out-of-state. Cornwell, Mustard, and Sridhar (2005) find that Georgia’s pro-gram raised total freshmen enrollment in Georgia colleges by about 6 percent between 1993 and 1997, but “keeping the best and brightest in state” accounts for as little as a quarter of the overall program effect. Further, the enrollment increase attributable to HOPE is less than 15 percent of scholarship recipients.
A third justification is to promote and reward academic achievement. Henry, Rubenstein, and Bugler (2004) matched the academic records of 1,915 “borderline” HOPE-eligible Georgia high school graduates with a group of 1,817 nonqualifiers, who graduated from high school in the same year with the same core-course GPA and matriculated at the same type of postsecondary institution.2They showed that students in the first group had higher college GPAs and probabilities of graduating in four years and completed more college credits. However, their findings cannot be con-strued as policy effects because both groups are influenced by HOPE, as qualifiers can become nonqualifiers and vice versa.
The requirements for HOPE eligibility and retention effectively raise the costs of failing to maintain a 3.0 GPA in high school and college, which in turn increases the payoffs to a variety of potentially grade-enhancing behaviors. Thus far, little attention has been paid to the influence of the GPA discontinuity on students’ academic choices. The only other study that examines HOPE’s effect on academic achievement is Dee and Jackson (1999), which examined the incidence of scholarship loss in the 1996 entering class of Georgia Tech freshmen. They reported that computing, engi-neering, and science majors were more likely to lose their awards, but did not address potential behavioral responses to the HOPE rules.
Our interest is in the behavioral responses of college students to the retention rules. Some of these, such as increasing effort and substituting schoolwork for market work, are directly related to academic achievement, as intended. Others, like enrolling in fewer classes per term, withdrawing from classes when performing unsatisfactorily, and choosing courses with higher expected grades, are clearly unintended and more
1. There were income restrictions in the first two years of the program. A household income cap was set at $66,000 in 1993 and raised to $100,000 in 1994, but abolished in 1995.
tenuously related to achievement. While effort and hours devoted to schoolwork are generally not observable, the basic choices underlying many of the unintended responses are in the data compiled by university registrars.
Using data from the longitudinal records of all undergraduates who enrolled at the University of Georgia (UGA) between 1989 and 1997, we estimate the effects of HOPE on course enrollment, withdrawal, and completion. The response to seek courses with higher expected grades could affect the choice of instructors, elective courses, or majors, or simply cause some course-taking to be shifted to the summer. An analysis of the first set of strategies is beyond the scope of this paper, but we do examine HOPE’s effect on summer school enrollment.3
Our empirical strategy is to contrast the behavior of in-state and out-of-state stu-dents before and after HOPE was implemented, using the nonresistu-dents, who cannot receive the scholarship, as a control group. We find that HOPE decreased full-load enrollments and increased course withdrawals among resident freshmen. The combi-nation of these responses is a 9.3 percent lower probability of full-load completion and an almost one-credit reduction in annual course credits completed. The latter implies that between 1993 and 1997 resident freshmen completed over 3,100 fewer courses than they would have in the absence of HOPE. In addition, the scholarship’s influence on course-taking behavior is concentrated on students whose GPAs place them on or below the scholarship-retention margin and increased as the income cap was lifted and more students received the award. Finally, in-state students diverted an average of 2.5 more credits from the regular academic year to the first two summer terms after their matriculation.
Because the value of working for a year or even a semester after graduation is sub-stantially greater than the value of the scholarship, it would be surprising if HOPE led to delays in graduation or substantial changes in course-taking. Of course, it is possi-ble that taking fewer courses or attending summer school aids in the transition to col-lege and better facilitates learning. However, the option to take fewer and less challenging courses has always existed and did not arise with the HOPE Scholarship. Furthermore, HOPE has little effect on whether the typical student enrolled at UGA attends college.4Thus, we argue that these unintended behavioral responses at least partially weaken HOPE’s promotion of academic achievement.
II. Data
Our data come from three sources. The Office of Student Financial Aid provided each student’s HOPE status. From the Registrar’s Office, we obtained credit hours enrolled, attempted and earned, cumulative GPA, matriculation and
Cornwell, Lee, and Mustard 897
3. HOPE’s influences on the choice of majors and elective courses is addressed by Cornwell, Lee, and Mustard (2005).
graduation terms (if available), high school GPA (HSGPA), and advanced placement (AP) credits. Finally, the Undergraduate Admissions Office provided precollege and personal characteristics such as SAT scores, high school attended, residency, ethnic-ity, gender, and age.5
Over the sample period, about 38,200 enrollees appear in the data set. However, because we are concerned with how HOPE affects academic choices from the outset of a college career, we limit the sample to (the nearly 33,000) students who enrolled at UGA as first-time freshmen (FTF). Further, we restrict attention to those FTF we regard as “typical”—students who matriculated at UGA in the fall term of the same year as they graduated from high school. Thus we exclude individuals who entered UGA before graduating from high school, during the summer term after they gradu-ated from high school, and after the fall term following their high school graduation.6 There are over 31,000 typical FTF in the sample, accounting for nearly 95 percent of all FTF from 1989–97.
After dropping to 3,042 in 1991, the number of typical FTF rose steadily to 4,165 in 1997. In HOPE’s first year, when a $66,000 income cap was in force, only 35.2 per-cent (949) of Georgia FTF entered with the scholarship. In 1994, the income cap was increased to $100,000 and this percentage increased to 75.5. After the income cap was removed in 1995, almost all resident, typical FTF started their careers at UGA as HOPE Scholars.
Table 1 reports the means and standard deviations of the variables used in our analysis, separately for residents and nonresidents, over the pre- and post-HOPE peri-ods. The resident–nonresident contrasts shown in the first six rows preview our main results. For example, about the same percentage of resident and nonresident freshmen (64.2 percent versus 63.5 percent) completed a full courseload between 1989 and 1992. However, after 1992 the full-load completion rates of these two groups diverged sharply, with the percentage of in-state students completing full loads dropping to 50.9 percent while the out-of-state percentage remained near 60 percent.
III. Retention Rules and Academic Achievement
To retain a HOPE Scholarship a student must have a 3.0 GPA at each of three checkpoints. If a student fails to meet the GPA standard, she loses the schol-arship, but can reestablish eligibility at the next checkpoint if she raises her GPA back to the 3.0 threshold. Those who do not qualify for HOPE in high school can become eligible at each checkpoint if their GPAs are at least 3.0. During our sample period, UGA used a quarter system where 45 credit hours (15 hours per quarter) was consid-ered a full load for an academic year. The GPA checkpoints occurred at 45, 90, and 135 credit hours, corresponding to the end of one’s freshmen, sophomore, and junior
5. The College Board recentered SAT scores for tests taken on or after 1 April 1995 to reestablish the aver-age SAT I verbal and math scores near the midpoint of the 200-to-800 scale. SAT scores from the Admissions Office for students in 1989 through 1994 classes were on the original scale. We recentered pre-April 1995 SAT scores using the College Board’s SAT I individual score conversion table.
Cornwell, Lee, and Mustard
899
Table 1
Sample Means for Typical FTFa(Standard Deviations in Parentheses)
Pre-HOPE (1989–92) Post-HOPE (1993–97)
Variable Nonresident Resident Nonresident Resident
Full-load enrollment rateb 81.2 82.2 81.2 77.0
Withdrawal ratec 25.7 26.1 33.7 39.4
Full-load completion rated 63.5 64.2 58.8 50.9
Credit hours enrolled 43.65 44.22 44.10 44.25
(7.13) (6.22) (6.95) (5.86)
Credit hours withdrawn 1.61 1.57 2.10 2.53
(3.29) (3.18) (3.66) (3.92)
Credit hours completede 42.04 42.65 42.00 41.71
(8.00) (7.22) (7.84) (7.33)
High school GPA 2.99 3.12 3.21 3.40
(0.45) (0.51) (0.43) (0.42)
SAT math score 564.51 559.78 585.17 582.40
(64.06) (67.93) (65.80) (69.38)
SAT verbal score 574.01 565.92 592.70 589.22
(73.63) (77.26) (73.21) (71.74)
SAT total score 1,138.52 1,125.70 1,177.88 1,171.62
(113.63) (124.78) (117.89) (120.98)
AP credit hours earned 3.27 2.77 5.24 4.55
(6.10) (6.01) (8.38) (8.15)
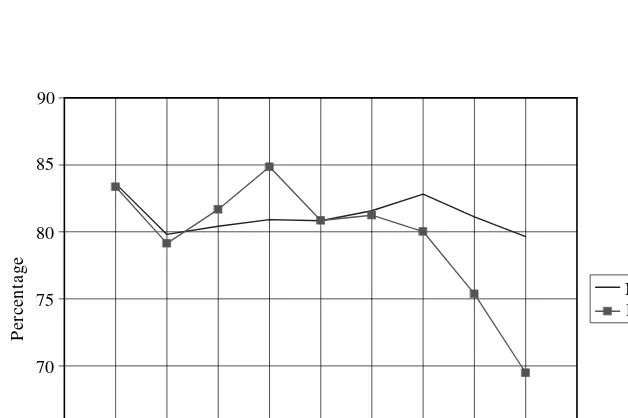
a. “Typical FTF” refers to first-time freshmen who matriculate at UGA in the fall term of the same year as they graduate from high school. b. Percentage of typical FTF enrolling in a full-course load.
c. Percentage of typical FTF withdrawing from a class. d. Percentage of typical FTF completing a full-course load.
years. HOPE paid for 190 credit hours, the level required to earn a typical under-graduate degree. However, there was (and is) no time limit on a student’s potential HOPE endowment, which can be spent in the summer under exactly the same terms as the regular academic year.
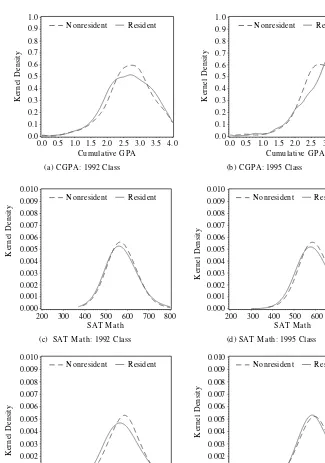
As discussed at the outset, the goal of tying scholarship retention to grades is to promote academic achievement. Insofar as academic achievement is measurable by improvements in students’ grades, changes in the GPA distribution after 1993 suggest this goal is being met at some level. Panels A and B of Figure 1 plot the kernel den-sity estimates of cumulative GPA distributions of typical UGA freshmen in the year prior to HOPE’s introduction (1992) and the first “full coverage” year (1995, the year the income cap was removed), by residency.7Prior to HOPE, the nonresident grade distribution lies to the right of the resident distribution and exhibits less variance. By 1995 the situation reversed, with the resident distribution exhibiting a conspicuous peak at 3.0, implying that HOPE contributed to the relative GPA gains for resident freshmen.
Some of these gains may be explained by the admission of relatively better in-state students. Consider Panels C–F of Figure 1, which show the kernel density estimates of the SAT math (SATM) and verbal (SATV) scores for 1992 and 1995, by residency. Before HOPE, nonresidents typically entered UGA with higher SAT scores. After HOPE, there is no noticeable relative change in the resident SATM distribution, but SATV scores of in-state students exhibit some “catchup.” Thus, based on SAT scores, the evidence for a substantial improvement in the relative quality of resident freshmen is not very strong. However, changes in the relative quality of in-state students could have occurred in other quality measures such as HSGPAs and AP credits, and we investigate these possibilities more formally below.
HOPE’s retention rules encourage a variety of grade-enhancing behavioral responses. Students may increase their effort or substitute schoolwork for market work, consistent with the goals of program. However, the scholarship also creates an incentive for adjusting courseloads and difficulty to achieve the GPA objective. We examine three particular responses.
One response is to enroll in fewer courses at the beginning of the term. A one-course reduction from a full load during the first year guarantees an extra term of funding by forestalling the HOPE checkpoint, no matter how low a student’s GPA is. A lighter load also may translate into greater per-class effort and an increased likeli-hood of earning higher grades without raising overall effort. Because HOPE benefits have no time limit, any propensity to take lighter loads is exacerbated. A second response is to withdraw from classes when performing poorly. Withdrawn classes do not enter the GPA calculation, so students who are near the HOPE margin and not doing well in a class have an added inducement to withdraw. The combined effects of enrolling in lighter loads and withdrawing more frequently will reduce completed credits.
A third response is to choose classes where the expected grade is higher, all else equal. Such a choice could be made on the basis of course content or a professor’s
Cornwell, Lee, and Mustard 901
(e) (f) SAT Verbal: 1995 Class
0.0
N onresident R esident N onresident R esident
N onresident R esident N onresident R esident
N onresident R esident
200 300 400 500 600 700 800 200 300 400 500 600 700 800
200 300 400 500 600 700 800 200 300 400 500 600 700 800
SAT Verbal: 1992 Class
SAT M ath SAT M ath
SAT Verbal SAT Verbal
Figure 1
reputation for grading leniently. Alternatively, a student may defer course work to the summer, when grade distributions are significantly more generous. From 1989–92, the mean summer term GPA of UGA freshmen was 2.89, compared with a fall-semes-ter average of 2.57, and this 0.32-point difference widened affall-semes-ter HOPE. This fall-sum-mer GPA differential shows up in all three major core-curriculum areas—humanities, mathematics and natural sciences, and social sciences—even though the typical sum-mer enrollee is a “lower quality” student. The mean fall-sumsum-mer SAT differential was 15 (1,141 vs. 1,126) points before HOPE and 16 points (1,185 vs. 1,169) thereafter.
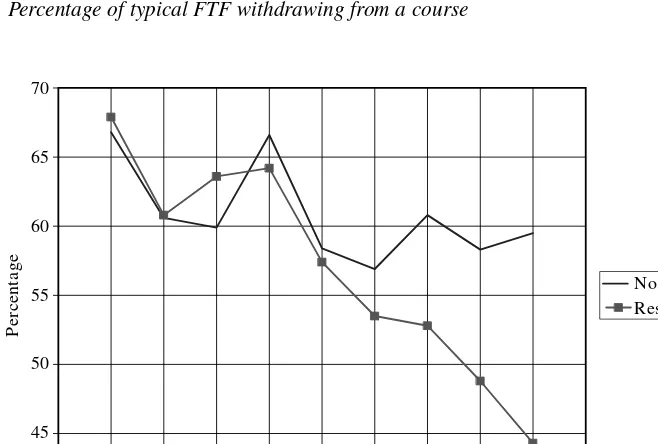
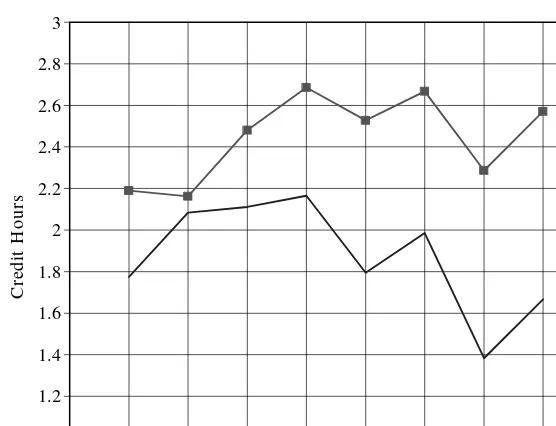
The raw data shown in Figures 2–5 provide evidence consistent with all three of these behavioral responses. Figure 2 shows that the rates of full courseload enrollment for res-ident and nonresres-ident freshmen diverged sharply after 1992. Between 1993 and 1997, the fraction of resident freshmen enrolled in a full load fell from 82 percent to 69 per-cent, while the percentage of nonresident full-load enrollees remained at 80 percent or above. Similarly, residents and nonresidents withdrew at about the same rate before 1993, but after HOPE in-state students withdrew much more frequently (see Figure 3). The combined effect of these responses, plotted in Figure 4, was a precipitous decline in the resident full-load completion rate from 68 percent to 44 percent, with the rate for nonresidents fluctuating fairly narrowly around 60 percent during the entire period. Figure 5 reflects the same story in summer school enrollment, where residents increased their credit hours compared to nonresidents after 1992.
60 65 70 75 80 85 90
88 89 90 91 92 93 94 95 96 97 98
P
er
ce
n
ta
ge
R esidents N onresidents
Academic Year
Figure 2
Cornwell, Lee, and Mustard 903
20 25 30 35 40 45
88 89 90 91 92 93 94 95 96 97 98
P
er
ce
n
ta
ge
Academic year
N onresidents R esidents
Figure 3
Percentage of typical FTF withdrawing from a course
Figure 4
Percentage of typical FTF completing a full load Academic Year
P
er
ce
n
ta
ge
40
88 89 90 91 92 93 94 95 96 97 98 45
50 55 60 65 70
IV. Estimation and Results
A. Empirical Model
We identify the scholarship’s effect on courseload adjustments and summer school enrollment by contrasting the responses of residents before and after the HOPE “treat-ment” with those of nonresidents who, because they cannot qualify for HOPE, serve as the control group.8In a regression context, this means estimating empirical models of the form
(1) yitj= βGAi$Ht+ α1GAi+ α2Ht+Xi´ γ + δjSj+ εitj
where yitjis a behavioral response measure for student ifrom high school jin aca-demic year t(t= 89,90, . . . ,97); GAiis a Georgia-resident dummy; Htis a HOPE
8. The population of nonresidents could still be affected by HOPE if states that traditionally supply students to UGA followed Georgia in adopting merit scholarships, or if the program allowed UGA to transfer insti-tutional aid previously allocated to Georgia residents to out-of-state students. However, neither happened during our sample period in an empirically meaningful way. First, Florida’s Bright Futures is the only other HOPE-like scholarship introduced and it did not start until the last year of our sample. Second, the only evi-dence for institutional aid transfers occurs in 1996 and 1997 when UGA began awarding Charter Scholarships (which provided about $2,000 in direct aid and an out-of-state tuition waiver) to nonresidents, but less than fifty of these scholarships were awarded in these two years to all (not just freshmen) out-of-state students.
Figure 5
Mean credit hours completed in the first summer term
1 1.2 1.4 1.6 1.8 2 2.2 2.4 2.6 2.8 3
89 90 91 92 93 94 95 96 97 98
Academic Year
C
re
d
it
H
o
u
rs
indicator that is set to one for students who matriculated after 1992; Xicontains race, gender, and class-year control variables; Sjindicates a graduate of high school j; and εitjis the error term. The program effect is captured by β, the coefficient of the interaction between the HOPE and Georgia-resident dummies. The high school dummies control for unobserved precollege peer and school quality that may affect course-taking decisions in college. Using data similar to ours from the University of California–San Diego, Betts and Morrell (1999) find that college GPA was sys-tematically related to the high school attended, even after controlling for high school GPA, SAT scores, and a host of personal characteristics. They further show that adding high school fixed effects to a college GPA regression with the same covariates as in Xiplus measures of high school achievement, explains another 10 percent of the variation in college GPA. It seems reasonable to infer that if college GPA is (partially) correlated with high school attended, then choices about course-loads, which also affect college GPA, will be as well.9
The courseload and summer school responses have both extensive and intensive margin expressions (for example, whether enrolled in a full-course load versus credit hours enrolled), and we estimate the HOPE effect for each case. Both discrete and continuous outcomes are estimated by OLS, and heteroscedasticity-consistent stan-dard errors are reported. To check our empirical strategy, we also determine whether the timing of the program effects coincides with HOPE’s introduction by estimating Equation 1 allowing βto vary over time. We expect stronger behavioral responses as the raising of the income cap increased the number of students eligible for the award and information about the retention rules became more widely diffused.
B. Changes in the Quality of Incoming Students
The average quality of both in-state and out-of-state students rose substantially after HOPE. Table 1 shows that the average resident SAT score, HSGPA, and AP credits increased by 45.9, 0.28, and 1.8, respectively. Similarly, the nonresident averages jumped by 39.4, 0.22, and 2.0. We examine the relative gains in student quality by deter-mining HOPE’s effect on the SAT scores, HSGPAs and AP credits of Georgia freshmen, estimating regressions like Equation 1 for each precollege outcome. During our sample period these measures of high school achievement were the sole determinants of admis-sion for about 90 percent of applicants. Lee (2004) confirms their importance in pre-dicting success in college. When SAT scores, HSGPAs, and AP credits are added to a regression of first-year college GPA on Georgia-resident, HOPE, race, and gender dum-mies, the effects of race and gender fall by 70 percent and 50 percent respectively, and the regression R2more than triples, rising from 0.091 to 0.367.
The precollege outcome results are given in Panel A of Table 2. The SATV regres-sion produces an estimated program effect of 9.3 with a t-ratio over three. In contrast, the HOPE effect estimate for SATM scores is only 1.5 with a t-ratio well below one. These findings are consistent with the SAT distribution changes shown in Figure 1. The estimated HOPE effect for HSGPA is 0.065 with a t-ratio of about four. However,
Cornwell, Lee, and Mustard 905
it is unclear how much importance to assign the relative increase of HSGPA for in-state students, because just as the shifts in UGA grade distributions may be explained by behavioral responses enumerated above, the same is true at the high school level. The eligibility rules create many of the same incentives as the retention rules. Further, there is no scholarship effect on AP credits, which suggests that HOPE has not led Georgia high schoolers to choose more advanced programs of study.10
C. Course Enrollment, Withdrawal, and Completion
Now we consider the evidence related to HOPE’s influence on courseload adjust-ments. The main findings are presented in Panels B and C of Table 2.
1. Extensive Margins
The results in Panel B indicate that HOPE reduced the probability of full courseload enrollment by 4.2 percentage points and increased the likelihood of course withdrawal by the same amount. The combined impact of these behavioral responses is a six per-centage point lower probability of completing a full-course load. Each estimated pro-gram effect is statistically significant at the 0.01 level. Evaluated at the pre-HOPE means of each outcome, these estimates imply that the full courseload enrollment rate fell by 5.1 percent, the withdrawal rate rose by 16.1 percent, and the full-load com-pletion rate decreased by 9.3 percent because of the scholarship.
When we allow the HOPE effect to vary over time, the estimated pre-1993 effects are uniformly small and statistically insignificant for each outcome.11In contrast, after 1994 when the income cap was lifted and more students became eligible, the coeffi-cient estimates are larger in magnitude, have the “correct” sign, and are much more precisely estimated. Further, in each case the post-HOPE coefficient estimates increase in magnitude over the period. After the income cap was removed in 1995, the estimated HOPE effects for course withdrawal more than doubled, while the full-load enrollment and completion estimates rose by about 80 percent. By 1997, the scholar-ship had reduced the probability that a freshman would complete a full load by over 16 percentage points (relative to 1993).
2. Intensive Margins
The estimates in Panel C show that the scholarship reduced completed credits hours by almost one, with decreased enrollments and increased withdrawals each counting for half of the drop, consistent with the scholarship effects on each extensive-margin out-come. Both the completed- and withdrawn-credits coefficient estimates are statistically
10. As an additional check, we also allowed the HOPE effect to vary by year for each precollege outcome. Consistent with the overall result for SATM scores and AP credits, none of year-specific coefficient estimates is statistically significant. In the cases of SATV scores and HSGPA, the estimated effects for the first three years of HOPE are positive, increasing, and statistically significant, whereas the post-1995 coefficient esti-mates are smaller and not statistically different from zero. Thus, the relative gains of residents are concen-trated in the first three years of the program.
significant at the 0.01 level; the estimated coefficient for enrolled credits is less precise, but still statistically significant at the 0.10 level.12 A one-credit-per-year HOPE-induced decline in credit hours means that between 1993 and 1997 Georgia residents completed over 15,710 fewer credit hours than nonresidents, or about 3,142 fewer courses.
Allowing the HOPE effect to vary over time produces generally the same pattern as in the extensive margins. Again, all pre-HOPE coefficient estimates are statistically insignificant. At the end of the sample period, first-year residents were completing, on average, 1.8 fewer credit hours (compared with 1993 levels).
Furthermore, our finding that the relative quality of in-state students rose in terms of SATV scores and HSGPA quality does not explain these behavioral responses. When we include the high school achievement variables in our course-taking regres-sions, the program effect estimates change very little, but always increase in magni-tude.13This is consistent with our finding that students with higher SATs and HSGPAs and more AP credits are less likely to withdraw from a course and more likely to enroll in and complete a full load. Thus, if anything, the relative improvements in in-state student quality bias our college outcome results againstshowing a scholarship effect.
D. HOPE Effects Throughout the GPA Distribution
HOPE’s influence on course-taking decisions should depend on a student’s place in the GPA distribution. One who is far below the 3.0 threshold in her first year has a strong incentive to enroll in fewer courses, because she will otherwise lose HOPE at the first checkpoint. Delay will guarantee one extra term of funding. A student on the retention margin faces a similar, though probably weaker, incentive, because her probability of HOPE loss is lower. In contrast, an individual with a GPA well above 3.0, who is unlikely to lose the scholarship, may take more credit hours, as HOPE lowers the cost of enrolling in an additional course.
To test these propositions, we examine the effects of the scholarship at three inter-vals of the grade distribution for typical first-year students: < 2.7, ≥2.7 and < 3.3, and
≥3.3. Because a student’s realized GPA category is endogenous, we base our analy-sis on an ordered probit model’s prediction of her category. Using the pre-HOPE data only (to avoid any potential contamination by the program), we estimated the ordered probit and predicted the GPA interval each student will fall into for both pre- and post-HOPE samples.14Then, we repeat the analyses represented in Panels B and C of Table 2 separately for the students predicted to be in each GPA category. Of the 30,703 stu-dents whose records contain high school achievement variables and the name of their
Cornwell, Lee, and Mustard 907
12. Although its eligibility and retention rules are somewhat different, Binder and Ganderton (2002), in their study of New Mexico’s merit-based SUCCESS Scholarship, report that program also led college students to reduce the number of registered and completed credit hours during their first two semesters.
13. For example, in Panel B of Table 2 we report an estimated HOPE effect of −0.042 on the full-load enroll-ment probability. Controlling for SAT scores, HSGPAs, and AP credits raises this estimate to −0.048. The difference between the two estimates in this case is typical of that we find in the other outcomes. See Cornwell, Lee, and Mustard (2003) for details.
The Journal of Human Resources
Table 2
Estimated HOPE Effect on Precollege and First-Year Course-Taking Outcomes Typical FTF, 1989–97a
Coefficient (Standard Error)
Outcomes on GA$Hf R2 N
A. Precollege outcomes
SAT math score 1.502 (2.307) 0.256 30,784
SAT verbal score 9.305 (2.700) 0.193 30,784
High school GPA 0.065 (0.016) 0.289 31,021
AP credits −0.013 (0.281) 0.148 31,116
B. First-year course-taking outcomes: extensive margin
Full-load enrollmentb −0.042 (0.016) 0.094 31,115
Course withdrawalc 0.042 (0.018) 0.099 31,115
Full-load completiond −0.060 (0.019) 0.108 31,115
C. First-year course-taking outcomes: intensive margin
Credits enrolled −0.474 (0.267) 0.110 31,115
Credits withdrawn 0.441 (0.140) 0.103 31,115
Credits completede −0.915 (0.306) 0.109 31,115
a. Heteroscedasticity-consistent standard errors reported in parentheses. b. Probability that a student enrolls in a full load in the first year;
yitj= 1 if credits enrolled ≥45.
c. Probability that a student withdraws from a course in the first year;
yitj= 1 if credits withdrawn > 0.
d. Probability that a student completes a full load in the first year;
yitj= 1 if credits completed ≥45.
e. Credits completed = credits enrolled – credits withdrawn.
Cornwell, Lee, and Mustard 909
high school, there are 18,653 with predicted GPAs below 2.7, 7,092 between 2.7 and 3.3, and 4,958 with at least 3.3.15Table 3 presents the results of this exercise.
1. Extensive Margins
The estimated HOPE effects on full-load completion, which reflect enrollment and withdrawal decisions, closely conform to our expectations. Students with predicted GPAs below 2.7 are 12.0 percentage points less likely to complete a full load; the largest of the effects. Those between 2.7 and 3.3 are 8.4 percentage points less likely to complete a full load. Students predicted to fall in the highest category are 7.7 per-centage points more likely, suggesting that the scholarship promotes the academic progress of individuals with the greatest prospects for success at the university. The HOPE effect estimate for the lowest GPA interval is very precise, and all three esti-mates are statistically significant at better than the 0.10 level.
Georgia residents with the lowest predicted GPAs are 5.8 percentage points less likely to enroll in a full load and 11.2 percentage points more likely to withdraw from a course because of HOPE. Students predicted to fall in the interval around 3.0 adjust primarily through course enrollment. They are 8.4 percentage points less likely to enroll in a full load, but no more likely to withdraw. The estimates for stu-dents with predicted GPAs above 3.3 indicate a higher probability of full-load enrollment and a lower probability of withdrawal for residents, neither of which is precisely estimated.
2. Intensive Margins
The HOPE effect estimates for credits completed, enrolled, and withdrawn follow the pattern of the corresponding extensive margin findings. In general, HOPE’s influence weakens as predicted GPA rises, and the most precisely estimated program responses are concentrated in the <2.7 category. Georgia residents with the lowest predicted GPAs completed an average of 1.57 fewer credits, enrolling in 0.65 less, and with-drawing from 0.92 more, during the HOPE period. The results also suggest that HOPE caused a 0.8–credit drop among students near the retention margin and a 0.7–credit rise among those predicted to be well above the 3.0 threshold, but both esti-mates fail to meet even the 0.20 level of significance.
To summarize, analyzing HOPE’s impacts by predicted GPA confirms the proposition that the courseload reduction responses are concentrated among the students most affected by the retention rules. The same story emerges when this exercise is repeated in terms of HSGPA categories corresponding to eligibility sta-tus: <3.0 (ineligible), ≥3.0 and <3.5 (marginally eligible), and ≥3.5 (“safely” eli-gible). Students with HSGPAs lower than 3.0 and between 3.0 and 3.5 are less likely to complete a full load and complete fewer credit hours in their first year because of HOPE, while the effect for those with HSGPAs greater than 3.5 is essentially nil.
The Journal of Human Resources
Table 3
Estimated HOPE Effect on Course Enrollment, Withdrawal, and Completion by Predicted GPA Category for Typical FTF in 1989–97a
Coefficient (Standard
Outcomes Predicted GPAb Error) on GA•$Hg R2 N
A. Extensive margin
Full-load enrollmentc < 2.7 −0.058 (0.022) 0.114 18,653
2.7–3.3 −0.084 (0.038) 0.154 7,092
≥3.3 0.040 (0.033) 0.156 4,958
Course withdrawald < 2.7 0.112 (0.026) 0.125 18,653
2.7–3.3 0.021 (0.044) 0.151 7,092
≥3.3 −0.051 (0.041) 0.146 4,958
Full-load completione < 2.7 −0.120 (0.027) 0.130 18,653
2.7–3.3 −0.084 (0.047) 0.172 7,092
≥3.3 0.077 (0.044) 0.161 4,958
B. Intensive margin
Credit hours enrolled < 2.7 −0.654 (0.361) 0.132 18,653
2.7–3.3 −0.643 (0.686) 0.150 7,092
Cornwell, Lee, and Mustard
911
Credit hours withdrawn < 2.7 0.920 (0.203) 0.134 18,653
2.7–3.3 0.144 (0.315) 0.143 7,092
≥3.3 −0.202 (0.261) 0.145 4,958
Credit hours completedf < 2.7 −1.573 (0.419) 0.135 18,653
2.7–3.3 −0.787 (0.764) 0.156 7,092
≥3.3 0.700 (0.704) 0.171 4,958
a. Heteroscedasticity-consistent standard errors reported in parentheses.
b. GPA category predictions were obtained from an ordered probit model estimated with the pre-HOPE data. See Lee (2004) for details. c. Probability that a student enrolls in a full load in the first year (yitj= 1 if credits enrolled ≥45)
d. Probability a student withdraws from a course in the first year (yitj= 1 if credits withdrawn > 0) e. Probability a student completes a full load in the first year (yitj= 1 if credits completed ≥45) f. Credits hours completed = credits hours enrolled – credits hours withdrawn.
E. Intertemporal Substitution or Delay?
Do the program responses for Georgia-resident freshmen reflect decisions to intertem-porally adjust their course loads—completing fewer credits in their first year and making up for it in their later years? Or, do these decisions slow their academic progress, leaving them behind their nonresident counterparts for the remainder of their undergraduate careers? We address these questions by estimating HOPE’s effect on the extensive and intensive course-completion margins by school year.
In our sample, there are 31,117 typical students in their first year, 23,923 in their second year, 18,981 in their third year, and 14,755 in their fourth year. Some students drop out, but most of the attrition occurs because we cannot follow 1995–97 entering classes through their fourth, third, and second years, respectively.16We found no pro-gram effect on persisting at UGA beyond the first year. The coefficient estimates on the GA• Hinteraction were uniformly small and statistically insignificant.
Panel A of Table 4 presents the estimated HOPE effects on full-load completion and completed credits. The first-year results are reproduced from Table 2. None of the HOPE effect estimates, on either margin, are statistically significant for students who are beyond their first year in school. These findings suggest that the retention rules do not simply encourage intertemporal substitution, but on balance, slow the typical res-ident’s progression through college.
However, the estimates presented in Panel A may be problematic for two reasons. First, the income cap weakens the experiment for the 1993 and 1994 classes, as resi-dents are placed in the treatment group who are ineligible for the scholarship and not subject to its incentives. Second, the prospects for intertemporal substitution are somewhat obscured because the analysis unevenly lumps together several pre- and post-HOPE cohorts. As an alternative, Panel B repeats the analysis, limiting the sam-ple to only the 1990 and 1995 classes, the latter being the first “full-HOPE-coverage” cohort and the former being the most recent never to benefit from the scholarship. Although we cannot follow the 1995 class into its fourth year, two findings stand out from this experiment: (a) the first-year program effects are larger, and (b) the HOPE-induced drop in completed credits in the first year is erased in the second year. While completed credits are about 1.5 hours lower in the first year because of HOPE, they are two hours higher in the second year. Both estimates are statistically significant at the 0.05 level. In contrast to the results presented in Panel A, the comparisons between the 1990 and 1995 classes cast doubt on the notion that the scholarship slows aca-demic progress.
F. Summer School Course Enrollment
Tying scholarship retention to grades also creates an incentive to enroll in classes where the expected grade is higher. We explore this behavioral response by examining the effect of HOPE on deferring course-taking to the summer. As we discussed in Section III, summer school grade distributions are more generous even though summer
Cornwell, Lee, and Mustard
913
Table 4
Estimated HOPE Effect on Intertemporal Substitution and Summer School Course-takinga
Outcomes Year/Summer Coefficient (Standard
in School Error) on GA• Hf R2 N
A. Intertemporal Substitution (1989–97 Classes)
Full-load completionb 1st Year −0.060 (0.019) 0.108 31,115
2nd Year 0.017 (0.023) 0.103 23,922
3rd Year −0.010 (0.025) 0.109 18,981
4th Year −0.020 (0.031) 0.108 14,755
Credit hours completedc 1st Year −0.915 (0.306) 0.109 31,115
2nd Year 0.479 (0.455) 0.120 23,922
3rd Year 0.524 (0.561) 0.122 18,981
4th Year 0.385 (0.717) 0.115 14,755
B. Intertemporal Substitution (1990 and 95 Classes)
Full-load completion 1st Year −0.065 (0.046) 0.168 7,081
2nd Year 0.053 (0.055) 0.162 6,304
3rd Year −0.013 (0.056) 0.165 5,770
Credit hours completed 1st Year −1.520 (0.666) 0.198 7,081
2nd Year 2.054 (1.038) 0.181 6,304
3rd Year 0.931 (1.282) 0.191 5,770
The Journal of Human Resources
Table 4 (continued)
Outcomes Year/Summer Coefficient (Standard
in School Error) on GA• Hf
C. Summer school course-taking (1990 and 95 classes)
Summer course enrollmentd 1st Summer 0.071 (0.045) 0.175 6,304
2nd Summer 0.037 (0.055) 0.172 5,770
3rd Summer 0.020 (0.059) 0.165 5,602
Summer credits completede 1st Summer 1.440 (0.443) 0.178 6,304
2nd Summer 1.042 (0.559) 0.171 5,770
3rd Summer −0.169 (0.643) 0.176 5,602
a. Heteroscedasticity-consistent standard errors reported in parentheses. b.yitj= 1 if credits taken in the t-th school year ≥45.
c. Credit hours taken = credit hours enrolled – credit hours withdrawn. d. yitj= 1 if credits taken in the summer of the t-th school year > 0.
e. Summer credits taken = summer credits enrolled – summer credits withdrawn.
school students are lower quality than those enrolled in regular academic-year courses. The program effect estimates on enrollment and credits completed, for the summers following a student’s first, second, and third years, are reported in Panel C of Table 4. On the extensive margin, there is some evidence that HOPE increased the proba-bility that in-state students take courses in their first summer. The estimated HOPE effect is 7.1 percentage points with a t-ratio of about 1.6. However, the estimates for the second and third summers are much smaller and statistically insignificant.
The program effect on the intensive margin is stronger. HOPE increased completed credits by 1.44 in the first summer, and by another 1.04 credits in the second; both estimates are statistically significant at the 0.06 level. The estimated HOPE effect for the third summer is negative, but its standard error is three times as large. Evaluated at the pre-HOPE mean, the results for the first two summers imply that summer school credits completed by Georgia residents rose 63 percent and 46 percent because of the scholarship.
Overall, the summer school enrollment data indicate that HOPE induced students to divert course-taking to the summer to meet HOPE retention requirements. Furthermore, the incentive to forestall the first checkpoint by taking fewer courses in the first year is balanced by the incentive to take courses in the first summer to improve their GPAs. To the degree intertemporal substitution occurs between the first and second academic years, taking classes in the intervening summer accounts for most of it.17
V. Conclusion
Following the introduction of Georgia’s HOPE program in 1993, state-sponsored merit scholarships have proliferated, justified in part as inducements for academic achievement. While their GPA requirements for eligibility and retention encourage students to apply greater effort toward their studies, they also encourage other behavioral responses like adjusting course loads and difficulty. This paper examines student responses to the eligibility and retention rules associated with the HOPE Scholarship. Using data on the undergraduates who enrolled at the University of Georgia between 1989 and 1997, we estimated the effects of HOPE on enrollment, withdrawal, and completion, and the shifting of course credits to the summer, treating out-of-state students as a control group.
We find that HOPE reduced the probability of full-course load enrollment and enrolled credit hours, and increased the probability of course withdrawal and with-drawn credits for Georgia-resident freshmen. Together these responses amount to a 9.3 percent reduction in the likelihood of completing a full load and almost a one-credit drop in completed credits. The credit-hour decline means that resident freshmen com-pleted over 3,100 fewer courses between 1993 and 1997 than they would have in the absence of HOPE. Further, these courseload adjustments are concentrated among stu-dents whose predicted freshman GPA places them on or below the scholarship
reten-Cornwell, Lee, and Mustard 915
tion margin, and their timing and magnitude are consistent with the introduction of the scholarship and the increase in the number of HOPE Scholars as the income restric-tions were removed. However, the evidence is mixed on whether these courseload adjustments constitute a delay in academic progress or intertemporal substitution.
The diversion of course-taking to the summer is an example of adjusting course dif-ficulty, as the average GPA of UGA freshmen is 10–15 percent higher in the summer than in the fall, even though the typical summer school enrollee has a lower SAT score and HSGPA. We show that HOPE increased summer school credits completed by Georgia residents by 63 percent and 44 percent in the first two summers following matriculation. The summer school results suggest that, to the extent intertemporal substitution occurs between the first and second years, summer enrollment accounts for most it.
We conclude that HOPE’s grade-based retention requirements lead to behavioral responses that partially undermine its objective to promote academic achievement. While responses like taking fewer courses per term may enhance human capital investment, the option to slow one’s progress toward degree completion existed prior to HOPE. Finally, given the opportunity cost of delaying graduation and entry into the labor market, and that HOPE is infra-marginal to most UGA students’ decisions whetherto attend college, it is surprising that the scholarship has any influence on behavior.
One explanation of the scholarship’s influence is that these student responses emerge from intra-household bargaining over HOPE rents in the decision whereto attend college. It is not uncommon for UGA undergraduates to admit to being “bribed” to forgo an out-of-state or private-school alternative with an offer of a car. The results of Cornwell and Mustard (2005), which show that car registrations in high-income counties rise almost 1 percent for each 10 percent increase in the num-ber HOPE recipients attending a public college or university, support this anecdotal evidence.
To what extent can these results be generalized to other state-sponsored merit scholarships? The answer depends on how HOPE-like they are. At least two charac-teristics of Georgia’s program are key in this regard. First, the award is earned and retained solely through meeting specified (mostly grade-based) academic criteria. Second, there is no fixed time period (for example, eight semesters) for scholarship qualifiers to use their awards. Many of programs started in the mid-1990s have these characteristics, although the newest of the scholarships have limits on the number of semesters or academic years they can be used. Finally, because UGA is a flagship institution and virtually every first-year student qualifies for the award, the magnitude of the effects may differ from lower-tier institutions where smaller fractions of stu-dents qualify.
References
Betts, Julian R., and Darlene Morell. 1999. “The Determinants of Undergraduate Grade Point Average: The Relative Importance of Family Background, High School Resources, and
Binder, Melissa, and Philip T. Ganderton. 2002. “Musical Chairs in Higher Education: Incentive Effects of a Merit-Based State Scholarship Program.” Working Paper, Department of Economics. Albuquerque: The University of New Mexico.
Cornwell, Christopher M., Kyung Hee Lee, and David B. Mustard. 2003. “The Effects of Merit-Based Financial Aid on College Enrollment, Withdrawal and Completion in College.” Working Paper, Department of Economics. Athens: The University of Georgia. Cornwell, Christopher M., Kyung Hee Lee, and David B. Mustard. 2005. “The Effects of
State Sponsored Scholarships on Grades and Course Selection: Evidence from Georgia.” Working Paper, Department of Economics. Athens: The University of Georgia.
Cornwell, Christopher M., and David B. Mustard. 2005. “Merit-Based College Scholarships and Car Sales.” Working Paper, Department of Economics. Athens: The University of Georgia.
Cornwell, Christopher M., David B. Mustard, and Deepa J. Sridhar. 2005. “The Enrollment Effects of Merit-based Financial Aid: Evidence from Georgia’s HOPE Scholarship.” Working Paper, Department of Economics. Athens: The University of Georgia.
Dee, Thomas S., and Linda A. Jackson. 1999. “Who Loses HOPE? Attrition from Georgia’s
College Scholarship Program.” Southern Economic Journal66(2):379–90.
Evans, William N., Wallace N. Oates, and Robert M. Schwab. 1992. “Measuring Peer Group
Effects: A Study of Teenage Behavior.” Journal of Political Economy100(5):966–91.
Henry, Gary T., Ross Rubenstein, and Daniel T. Bugler. 2004. “Is HOPE Enough? Impacts of
Receiving and Losing Merit-Based Financial Aid.” Educational Policy18(5): 686–709.
Lee, Kyung Hee. 2004. The Effects of Merit-Based Financial Aid on Academic Choices in College: Evidence from Georgia’s HOPE Scholarship. Dissertation, Department of Economics. Athens: The University of Georgia.