Who’s related to whom? Recent results from molecular
systematic studies
Elizabeth A Kellogg
Similarities among model systems can lead to generalizations about plants, but understanding the differences requires systematic data. Molecular phylogenetic analyses produce results similar to traditional classifications in the grasses (Poaceae), and relationships among the cereal crops are quite clear. Chloroplast-based phylogenies for the Solanaceae show that tomato is best considered as a species ofSolanum, closely related to potatoes. Traditional classifications in the Brassicaceae are misleading with regard to true phylogenetic relationships and data are only now beginning to clarify the situation. Molecular data are also being used to revise our view of relationships among flowering plant families. Phylogenetic data are critical for interpreting hypotheses of the evolution of development.
Address
Harvard University Herbaria, 22 Divinity Avenue Cambridge, MA 02138, USA
Current Opinion in Plant Biology1998,1:149–158 http://biomednet.com/elecref/1369526600100149
Current Biology Ltd ISSN 1369-5266 Abbreviation
ITS internal transcribed spacer
Introduction
The study of model organisms is generally justified on the grounds that the results will be applicable to all organisms. Testing this assumption requires comparative studies. When laboratory models are compared across kingdoms or phyla, the similarities are taken as fundamental aspects of life. This approach is obviously powerful; it is the source of most of what we know about proteins, cell biology, and genetic structure and function. Such comparison also represents higher-level systematics: the commonalities among kingdoms are the shared derived characters (synapomorphies, in phylogenetic jargon) of life. This broad comparison can easily be performed within kingdoms as well. If a result fromArabidopsisis assumed to be common to all plants, then it is simple to compare it to another dicot (e.g. snapdragon or tomato) or to a monocot (e.g. maize) [1,2••]. This too is implicit use of phylogenetic data.
The limitations of the model system approach become obvious when there are differences between plants. Organisms and their characteristics evolve, leading to shared similarities that vary across a near-infinite number of hierarchical levels. This is particularly true as more and more molecular geneticists concern themselves with mechanisms of development, and move closer to the
systematist’s question — why are there so many different kinds of organisms? Studies of the evolution of develop-ment demand that the investigator go beyond the model system and learn the pattern of variation in its relatives [3•]. This requires a reasonable assessment of the relatives’ identity.
Knowledge of plant relationships has increased rapidly in the past decade, reflecting partly the development of molecular systematics. It has been known for some time that plant classifications do not reflect phylogeny accurately, even though both phylogeny and classification are hierarchical. The hierarchy of classification was imposed in the late 18th century, well before ideas of descent with modification (evolution) were prevalent [4]. These pre-evolutionary groups were then re-interpreted in an evolutionary context, and were assumed to be products of evolution, rather than man-made artefacts. Thus, every named group represents an historic assumption of relationship that may or may not be accurate but these assumptions can now be tested. Data are accumulating that show, in some cases, historically recognized groups are indeed phylogenetically linked (monophyletic), and other ‘groups’ are quite miscellaneous and made up of unrelated elements (polyphyletic). In addition, taxa whose placement have been ambiguous can frequently now be placed.
Molecular systematics proceeds by firstly sequencing a gene from multiple organisms, secondly aligning the sequences, and thirdly by constructing a phylogenetic tree from the sequences. There are many methods that can be used to produce the tree; one of the most common is the so-called ‘parsimony method,’ which assumes that the best inference of evolutionary history is the one that requires postulating the fewest mutations (i.e., the shortest tree). The underlying principle is that scientists prefer explanations that best fit their data. Given the shortest tree, it is often desirable to assess how much evidence there is for particular groups. This too can be done in various ways; one commonly used quasistatistical method is bootstrap analysis. The nucleotide positions in the alignment are sampled randomly with replacement to generate a new ‘sequence’ and this is analyzed to produce a phylogenetic tree; the randomization procedure is repeated many times and the support for a particular group can be estimated as the percentage of randomised trees in which it occurs. Bootstrap values vary between 0 (no support for a particular group) and 100% (a group well supported by the data).
organisms. There are many cases when this may not be true, however. For example, if introgression occurs, then genes may find themselves in a nucleus different from the one in which they evolved. Similarly, chloroplasts, which are maternally inherited in most plants, may be transferred among species, so that a chloroplast may now share a cell with a nucleus quite different from the nucleus with which it had been associated historically. Such chloroplast transfer can be detected by comparison with the phylogeny of a nuclear gene.
In this review, I focus on the major plant model systems —Arabidopsis thaliana, Antirrhinum majus (snap-dragon), Lycopersicon esculentum (=Solanum lycopersicum; tomato),Zea mays(maize), andOryza sativa(rice) — begin-ning with recent studies that identify their near relatives. I then comment briefly on progress in determining the ‘big picture’ of flowering plant evolution. I have highlighted particular studies that use multiple gene and genome comparisons to track the history of organisms. This tests the assumption that all pieces of DNA have similar histories. I have also focused on studies that include large numbers of taxa as these avoid errors associated with biased sampling of species.
Maize, rice and the grass family
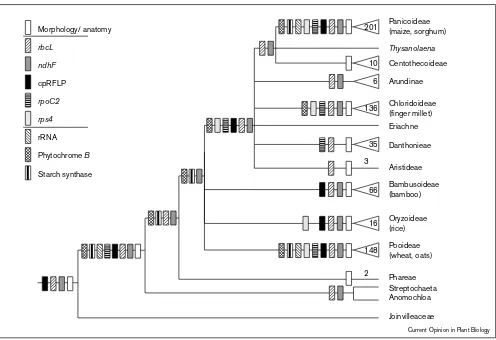
Of all plant model organisms, the grasses (Poaceae or Gramineae) are the best understood phylogenetically. There are now seven published molecular phylogenies: five representing markers from the chloroplast [5–12], and two using nuclear markers [13•,14]. These phylogenies are strikingly congruent as can be seen in Figure 1 (see also [15••]). The lack of resolution in relationships among Bambusoideae, Oryzoideae, and Pooideae reflects strongly supported differences among the various gene trees, but this is almost certainly due to sampling problems in some data sets; some gene trees (e.g. the chloroplast-encoded gene for subunit F of NADH dehydrogenase [ndhF] and phytochrome B [phyB] [11,13•]) indicate that these three subfamilies form a single clade. This phylogeny shows that the panicoid grasses — maize, sugar cane, sorghum, pearl millet — are more closely related to finger millet than they are to rice. Furthermore, if thephyB andndhF phylogenies are accurate, the small grains — wheat, barley, rye, and oats, in the Pooideae — are more closely related to rice than they are to maize.
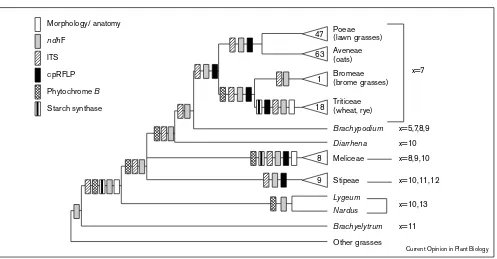
Even at lower taxonomic levels, phylogenies of different genes all indicate the same relationships. Within the subfamily Pooideae, for example, there are four molecular phylogenies, all of which are congruent (Figure 2). This group was identified as monophyletic by cladistic studies of morphology [16], but several genera or small tribes, including the Stipeae, were sometimes placed with the pooids [17] and sometimes in other subfamilies [18]. Two of the molecular studies are based on chloroplast
because the chloroplast does not recombine and thus has a single history. The other two are based on nuclear genes encoding ITS [20], and phytochrome B ([13•]; SY Mathews, RC Tsai, EA Kellogg, unpublished data). These also support the placement of Stipeae. As all data from both nuclear and chloroplast genomes suggest the same relationships, the gene trees are probably good estimates of the organismal phylogeny.
Within the pooid tribe Triticeae, the general congruence among gene trees is lost. This is a cytogenetically complex group, containing 17 intersterile diploid genera from which a number of allopolyploids are derived. For the diploid genera, we have five molecular phylogenies. The two chloroplast phylogenies, based on restriction site polymorphisms [21•] and sequences of the gene encoding RNA polymerase subunit A (rpoA) [22•], suggest the same history. The three nuclear gene trees, however, are significantly different, both from each other and from the chloroplast phylogeny ([23••,24••]; Figure 3). The explanation for this is not clear, but may involve a history of rare gene flow among the genera, perhaps across different ploidal levels. The important point is that each gene has a distinct history, indicating that the organismic history is complex and reticulate and is better diagrammed as a network than as a tree. This might have been expected for a group of interfertile species or subspecies, but not for a group of intersterile genera.
Tomato and snapdragon
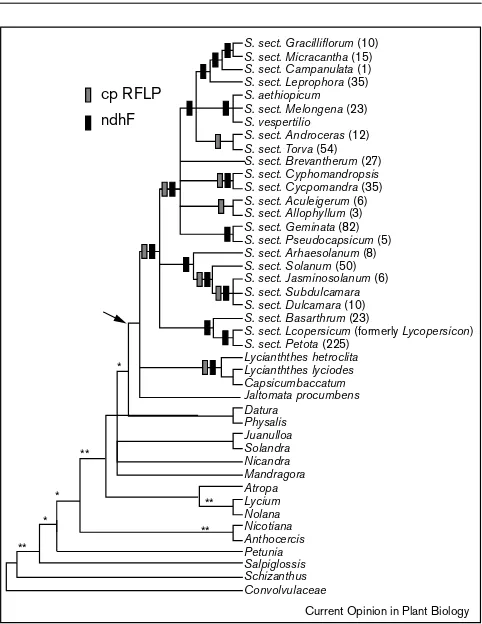
Tomato, generally classified asLycopersicon esculentum, is a member of the family Solanaceae; next to the grasses, this is the group for which we have the most comprehensive picture of relationships ([25•,26••,27••]; Figure 4). Note, however, that virtually all gene trees to date are based on chloroplast markers. We, therefore, make an assumption that the organismal phylogeny is tracked accurately by this single genome.
The traditional genus Lycopersicon clearly represents a single lineage of seven species. It has been known for some time that Lycopersicon was closely related to the genus Solanum which, in its traditional circumscription, includes potatoes (S. tuberosum) and eggplant (S. melongena) as well as∼1400 other species. These are apportioned for convenience into seven subgenera each of which is in turn divided into sections [28,29]. Lycopersicon is most closely related to section Petota, subgenus Potatoe [26••,27••,30], which includes the familiar grocery store potato, as well as many other tuber-bearing species. As Lycopersicon is derived from within Solanum and does not represent a separate evolutionary line, its genetic relationships are more accurately reflected if it is considered a species
of Solanum (S. lycopersicum) rather than an independent
Figure 1
Current Opinion in Plant Biology
201
10 6
136
35
66
16
148 2 3 Morphology/ anatomy
rbcL
ndhF
cpRFLP
rpoC2
rps4
rRNA Phytochrome B
Starch synthase
Panicoideae (maize, sorghum)
Chloridoideae (finger millet)
Bambusoideae (bamboo) Oryzoideae (rice) Pooideae (wheat, oats) Phareae Streptochaeta Anomochloa Joinvilleaceae
Thysanolaena
Eriachne Danthonieae Aristideae Centothecoideae Arundinae
Summary (combinable component analysis) of phylogenetic data on the grass family. Extant taxa are listed on the right of the diagram; points at which lines attach indicate hypothetical ancestors. Triangles indicate large groups and numbers refer to number of genera in the group. Joinvilleaceae is the sister family of the grasses; all other taxa are members of the Poaceae. If more than one line attaches to a particular ancestor it indicates that we do not know the order in which the lineages formed. For example, some evidence [11,13•] suggests that there was a single branch that later divided into Bambusoideae, Oryzoideae and Pooideae, but this is not yet well supported, so the relationship is drawn to indicate that we do not know the order in which the three lineages formed. The diagram synthesizes data from morphology [16,83,84];
rbcL[5,8,9];ndhF[11]; chloroplast restriction sites [7];rpoC2[6,10];rps4[12]; rRNA [14]; phytochrome B ([13]; SY Mathews, RC Tsai, EA Kellogg, unpublished data). If a group is found in a particular gene phylogeny, and is not strongly contradicted by any other gene phylogeny, an appropriately patterned rectangle is placed below the common ancestor of the group. For example, bothndhFand phytochrome B sequences linkStreptochaetaandAnomochloa, as indicated by the two rectangles just below the pair of genera; no other gene has been sequenced for both genera. Reprinted with permission from [15••].
Solanum, whereas it is in fact more closely related to some
members of Solanumthan to others.
The phylogeny of Solanaceae has obvious implications for the evolution of form. To consider a single example, many species of Solanum have compound leaves, as do species
ofSchizanthus, whereas other members of the family have
simple leaves. The degree of leaf compounding in sect.
Lycopersicumis known to be affected by homeobox genes
such as Let6[31•]. Changes in the regulation of this gene may thus have been involved in the changes leading to the origin of compound leaves in the ancestor ofSolanum. The phylogeny shows that leaf compounding in Schizanthus
originated independently; it is, therefore, necessary to test whether it is genetically and developmentally the same.
The Solanaceae is the sister family to the Convolvulaceae (morning glory family) and these, in turn, are closely related to the large group of families including the Lamiaceae (mints) and Scrophulariaceae (snapdragon family) [32,33•]. Both Lamiaceae and Scrophulariaceae are polyphyletic. Scrophulariaceae can be divided into two unrelated groups, one of which contains the genus
Scrophularia (and thus must be called Scrophulariaceae)
and the other of which contains Antirrhinum, Digitalis
(foxglove), and Veronica(speedwell) [32].
Arabidopsis
Arabidopsis thaliana is a member of the mustard family
Current Opinion in Plant Biology
47 Poeae(lawn grasses) Aveneae (oats) Bromeae (brome grasses) Triticeae (wheat, rye)
Brachypodium
Diarrhena
Meliceae Stipeae
Lygeum
Nardus
Brachyelytrum
Other grasses
x=5,7,8,9 x=7
x=10 x=8,9,10 x=10,11,12 x=10,13 x=11 63
1
18
8 9 Morphology/ anatomy
ITS
ndhF
cpRFLP Phytochrome B
Starch synthase
Summary (combinable component analysis) of phylogenetic data on the grass subfamily Pooideae. An appropriately shaded rectangle marks any clade supported by particular sets of data and not strongly contradicted by any other set of data. Triangles indicate large clades and numbers refer to the number of genera. The overlapping triangles for Poeae and Aveneae indicate that tribal boundaries are unclear. Base chromosome numbers (x) for each clade are shown to the right of the diagram. Sources of data are as follows: morphological data [16,84];ndhF [19•]; ITS [20]; chloroplast restriction sites [7]; phytochrome B ([13•]; SY Mathews, RC Tsai, EA Kellogg unpublished data); granule-bound starch synthase [65].
the existing classification of Brassicaceae, based largely on fruit structure, is proving to be a poor indicator of relationship. In other words, generic and tribal names do not indicate anything about evolutionary history. (An analogous situation in modern society would be if children were not given the family name of either parent but rather a name pulled at random from the ‘phone book). Preliminary data from rbcL [34] — the gene encoding the large subunit of the photosynthetic enzyme Ribulose-1,5-bisphosphate carboxylase/oxygenase (RuBisCo) — indicate that species in the genusArabidopsis
are not closely related to A. thaliana and, conversely, that the closest relatives of A. thaliana are in the genera
CardaminopsisandArabis.
This proposal was recently corroborated by sequences of the nuclear ITS which verified the allopolyploid
Arabidopsis suecicaas being the offspring ofA. thalianaand
most likely Cardaminopsis arenosa, or possibly C. neglecta
[35•].C. petraeais also closely related toA. thalianaandA. suecicabut is not involved in the allopolyploidization event. ITS sequences also verify the substantial evolutionary distance between A. thaliana and other species currently classified inArabidopsis.
Molecular data have led to a new classification of
Arabidopsis, which places Arabis lyrata and all species
formerly known as Cardaminopsis into Arabidopsis [36•]. 49 other species, formerly calledArabidopsis, are excluded from the genus, with several of them already placed elsewhere (e.g. [37–39]). Molecular phylogenies for a newly circumscribed genus Arabidopsis are forthcoming (RA Price, S O’Kane, personal communication).
The one tribe of Brassicaceae that does appear to be monophyletic is Brassiceae [34]. Restriction site data have been used to reconstruct the history of the chloroplast genome in Brassiceae [40••]. If the history of the chloroplast mirrors the history of the organism, then the genusBrassicais polyphyletic, with the speciesB.oleracea
(cabbage, brussels sprouts, broccoli, etc.) and several other
Brassica species closely related to the genus Diplotaxis,
whereas radish (Raphanus sativus) is related toB. barrelieri
andB. oxyrrhina.
Figure 3
Taeniatherum caput-medusae Aegilops searsii
Aeg. bicorn./longis./sharon. Aeg. com./tripsa./dichas. Aegilops tauschii Aegilops speltoides Aegilops uniaristatum Triticum monococcum Crithopsis delileana Thinopyrum spp.
Lophopyrum elongatum Pseudoroegneria spp.
Peridictyon sanctum Australopyrum spp.
Agropyron spp.
Secale spp.
Eremopyrum distans Eremopyrum bonaepartis Henrardia persica Dasypyrum villosum Psathyrostachys spp.
Heteranthelium piliferum Hordeum spp.
Critesion spp.
Bromus spp.
Current Opinion in Plant Biology
Combined data from
three nuclear genes restriction site variationData from chloroplast 81
100
53 74 71
72 78
56
99 57
79
81
67 84
65 93
99
Evolutionary relationships in the grass tribe Triticeae. Relationships identified on the basis of three nuclear genes are shown on the left, and relationships identified on the basis of the chloroplast genome are on the right. Crossed lines indicate that there are many differences between the chloroplast and nuclear gene phylogenies. The differences among the various sources of phylogenetic data may indicate a history of introgression. Dotted lines indicate well-supported differences among the nuclear genes. Numbers above branches indicate bootstrap support values. Redrawn from [23••].
Relationships among flowering plants
Systematists have grappled for a long time with the relationships among flowering plant families [43–47]. The system of Cronquist [47] is perhaps the most familiar to American botanists, and has the advantage of being comprehensive. It is not at all phylogenetic, however, and many relationships are ambiguous. Molecular systematic data have now overturned many of the proposed higher-level (ordinal and superordinal) groups.
Many plant systematists were involved in a community-wide effort to generate a large database of sequences of
rbcL, the gene encoding the large subunit of the pho-tosynthetic enzyme ribulose-1,5-bisphosphate carboxy-lase/oxygenase (RuBisCO). This led to a phylogeny for all seed plants, using 499 rbcL sequences [48]. As the authors observed, the results should be interpreted with caution. The published trees turned out not to be the shortest available [49•], and a few of the sequences proved to be pseudogenes [50•]. Nonetheless, therbcL phylogeny is taken as the starting point for many current research projects.
Another large co-operative effort, analogous to that used for rbcL, has recently generated a large database of sequences for the small subunit of nuclear ribosomal RNA
(18S rRNA; [51••]). This study helps test some of the tentative conclusions of the original rbcL study. In broad outline, phylogenies of the two genes find similar groups among angiosperms. Additional data have been generated for the geneatpB (a chloroplast gene encoding the subunit B of ATP synthase), and these data have been combined with those from rbcL and 18S rRNA [52••,53••]. From the combination of these data sets, a number of robust conclusions emerge.
Many aspects of the rbcL, 18S, and atpB trees sup-port ideas that had already been formed on the basis of morphology. For example, the Caryophillidae — the group including spinach, beets, cacti, and campion — are monophyletic. The Asteridae, a group that includes many of the plants with fused petals — such as Antirrhinum,
Petunia, Nicotiana, and Solanum— are also monophyletic.
S. sect. Gracilliflorum (10)
cp RFLP ndhF
S. sect. Micracantha (15)
S. sect. Campanulata (1)
S. sect. Leprophora (35)
S. aethiopicum S. sect. Melongena (23)
S. vespertilio S. sect. Androceras (12)
S. sect. Torva (54)
S. sect. Brevantherum (27)
S. sect. Cyphomandropsis S. sect. Cycpomandra (35)
S. sect. Aculeigerum (6)
S. sect. Allophyllum (3)
S. sect. Geminata (82)
S. sect. Pseudocapsicum (5)
S. sect. Arhaesolanum (8)
S. sect. Solanum (50)
S. sect. Jasminosolanum (6)
S. sect. Subdulcamara S. sect. Dulcamara (10)
S. sect. Basarthrum (23)
S. sect. Lcopersicum (formerly Lycopersicon)
S. sect. Petota (225)
Lycianththes hetroclita Lycianththes lyciodes Capsicumbaccatum Jaltomata procumbens Datura
Physalis Juanulloa Solandra Nicandra Mandragora Atropa Lycium Nolana Nicotiana Anthocercis Petunia Salpiglossis Schizanthus Convolvulaceae
*
**
* *
**
** **
Current Opinion in Plant Biology
Phylogenetic relationships in Solanaceae. The diagram was produced by grafting thendhF [26••] and chloroplast restriction site (cpRFLP; [27••]) histories (above the arrow) to a chloroplast history inferred from a combination of three genes ([85]; below the arrow). Above the arrow, an appropriately shaded rectangle marks any clade supported by one set of data and not strongly contradicted by the other. Below the arrow, clades with bootstrap support greater than 90% in the combined phylogeny are indicated by two asterisks; clades with 80–90% support are indicated by a single asterisk.
and hydrangeas) and Caprifoliaceae (honeysuckles) appear polyphyletic, as had also been suspected. The eudicot clade, first identified in morphological studies [55] as including all taxa with tricoplate (three-grooved) pollen, is supported as monophyletic, as are the monocots.
In other cases, the molecular data support relationships that previously appeared ambiguous. For example, the Ericaceae (health family, including rhododendron, blue-berries, and cranberries) were placed by 19th century botanists with other fused-petal families (the Sympetalae [56] or Gamopetalae [57]), but systematists of the 20th century thought the groups were unrelated [43–47]. The
rbcL, 18S, and atpB data support the placement of an Ericalean clade in a larger clade with the Asteridae, reuniting much (but not all) of the Englerian Sympetalae. As another example, Juglandaceae (walnuts) are clearly placed with Betulaceae and Fagaceae (birches and oaks, respectively), despite Cronquist’s suggestion [47] that the two groups might be unrelated.
unexpected. The polyphyly of the Scrophulariaceae was noted above. Another striking example is the fact that the nine families with nitrogen-fixing members fall into a single large clade, along with only ten families that are not nitrogen-fixing [58]. As the nitrogen-fixing families had previously appeared to be completely unrelated, this is unusual and suggests that these families may have more in common than was formerly believed.
The congruence among the 18S, rbcL, and atpB phy-logenies has made it clear that the existing systems of classification [43–47] need to be replaced. In particular, the relationships among families need to be rearranged to reflect the phylogenetic history, some families need to be dismembered, and others reconstituted. Our picture of the evolution of flowering plants is still coming into focus and further changes will undoubtedly be necessary. Fortunately, the technology of the World Wide Web has permitted the construction of Web Sites that provide classifications [59] and descriptions of families and orders (PF Stevens, unpublished data). These place extensive morphological data in the phylogenetic framework pro-vided by molecular studies.
Do gene trees indicate species trees?
With the exception of the grass phylogenies, most molecular systematic studies focus on either chloroplast genes or nuclear ribosomal DNA. In general, they indicate similar relationships among organisms, suggesting that, indeed, the gene chosen does not matter much. For very large data sets (hundreds of taxa), however, more base pairs are needed to identify each branching event [53,60•]. Work on low copy number genes is in its infancy in plant molecular systematics, and no nuclear gene has yet been used across enough groups to provide a clear comparison with chloroplast or ribosomal data. Other nuclear genes that are good candidates for phylogeny reconstruction are the phytochrome genes [13•,61], the small heat-shock proteins [62•], alcohol dehydrogenase (Adh) [63•,64•], granule-bound starch synthase [65], and phosphoglucoisomerase [66•]. In all cases, the history of the gene may or may not be a faithful reflection of the history of the cell in which it resides. Functional constraints, natural selection, and random genetic drift, can under certain circumstances, cause the phylogeny of the gene to differ from that of other genes in the same nucleus or cell. Only by comparison of multiple genes will we be able to discern the history of the organisms that bear them.
quite misleading about the history of organisms. It is not uncommon to find that the history of the chloroplast differs from that of the nucleus in one or more taxa [67–70,71••]. Few studies incorporate sequence data on more than one nuclear marker, however; a notable exception is the study of relationships among species of peony, in which genes for
Adh1 estimated relationships similar to those from ITS and the chloroplast genematK [64•];Adh2 gene trees, however, had a significantly different history.
Phylogeny and genome evolution
Phylogenies will be critical to the interpretation of the burgeoning data on genome structure and size, because only with a phylogeny is it possible to determine the direction and frequency of change. In a standard genetic study, it is easy to keep track of which plants are mutant and which are wild-type, but over evolutionary time the only way to know which are the ‘mutants’ (i.e. derived) is to have a phylogeny. For example, with the grass phylogeny shown in Figure 1, it is possible to infer that there exists some mechanism for replacing the centromeric region of one chromosome with an entirely different chromosome and its centromere, such that two ancestral chromosomes are combined by inserting one into the other [15••]. A phylogeny can also be used to show that changes in genome size are frequent, even among groups such as the grasses in which genome structure is largely conserved [15••,72•].
Bharathan used phylogenetic data to study correlates of genome size with reproductive characteristics of monocots [73••]. She found four to nine independent transitions to large genomes (which she defined as those with more than 9.025 pg DNA per 1C nucleus) and up to five reversions to small genomes. She found no strong association between genome size and the presence of nuclear endosperm or the presence of simultaneous microsporogenesis, but did find that genomes were significantly larger in families with bisporic or tetrasporic embryo sacs. Her study relied extensively on available molecular phylogenies, and indeed would not have been possible without them.
Conclusions
As a consequence of space limitation, this review cannot incorporate the many methodological advances that have led to the data cited above. Computational advances have made it possible to analyze data sets that are an order of magnitude larger than was possible a decade ago (e.g. [49•,74••]). It is also increasingly possible to assess support for the data sets [74••,75]. This is critical as assessment of support is necessary for accurate comparison of gene trees [24••,71••]. There has also been much discussion of the relationship between gene trees and species trees [76•,77•] and the methods of incorporating information from different gene trees [24••,71••,78–82].
Relationships among major groups of grasses are now known with some precision, although the history is
complex in the Triticeae (which includes wheat, barley and rye). Rapid progress is occurring on relationships within Solanaceae and other sympetalous families, although we must still assume that the chloroplast phylogeny is an accurate reflection of the organismal phylogeny. Understanding of the phylogeny of Brassicaceae lags behind that of other groups. This is partly because the morphological classification is so radically different from the molecular phylogeny that it is impossible to use any one species as a place-holder for a genus or tribe, as can be done in the grasses or Solanaceae; each species must be re-evaluated individually. Finally, our understanding of angiosperm relationships is being revolutionized by molecular data. It is too early to know what new insights will come from these data but they are likely to be profound.
We can now envisage a time in the near future when robust phylogenies will have been constructed for many angiosperm groups. This will permit an entirely new discipline — let us call it “evolutionary genetics” — to test the generality of the model systems, and use comparative data to understand the genetic basis of diversification.
Acknowledgement
I thank Pam Soltis for providing preprints of her work, David Baum and Peter Stevens for helpful comments on the manuscript, and Abigail Amey for patient editorial assistance.
References and recommended reading
Papers of particular interest, published within the annual period of review, have been highlighted as:
• of special interest
•• of outstanding interest
1. Kellogg EA, Shaffer HB:Model organisms for evolutionary studies.Syst Biol1993,42:409-414.
••
2. Meyerowitz EM:Plants and the logic of development.Genetics
1997,145:5-9.
This succinct essay explores current knowledge of plant development and compares it to animal development. In general, the basic cellular machinery is quite similar between the kingdoms. Although the same classes of devel-opmental regulatory proteins are found in both animals and plants, their func-tions are analogous rather than homologous. Cell–cell and cell–environment communication are substantially different for plants.
•
3. Baum DA:The evolution of plant development.Curr Opin Plant Biol1998,1:79-86.
Recent studies of plant development point to genes that may have been im-portant in mediating evolutionary change. These are candidates for compar-ative studies, particularly of floral organization, leaf morphology, and inflores-cence morphology. Except for studies on cultivated maize and its ancestors, few of these genes have yet been studied in a broadly comparative context. 4. Stevens PF:The development of biological systematics. New
York: Columbia University Press; 1994.
5. Barker NP, Linder HP, Harley E:Phylogeny of Poaceae based on
rbcL sequences.Syst Bot1995,20:423-435. 6. Barker NP:A Molecular Phylogeny of the Subfamily
Arundinoideae (Poaceae), [Ph.D. thesis].University of Cape Town, 1995.
7. Davis JI, Soreng RJ:Phylogenetic structure in the grass family (Poaceae), as determined from chloroplast DNA restriction site variation.Amer J Bot1993,80:1444-1454.
9. Duvall MR, Morton BR:Molecular phylogenetics of Poaceae: an expanded analysis ofrbcL sequence data.Mol Phylog Evol
1996,5:352-358.
10. Cummings MP, King LM, Kellogg EA:Slipped-strand mispairing in a plastid gene:rpoC2 in grasses (Poaceae).Mol Biol Evol
1994,11:1-8.
11. Clark LG, Zhang W, Wendel JF:A phylogeny of the grass family (Poaceae) based onndhF sequence data.Syst Bot1995, 20:436-460.
12. Nadot S, Bajon R, Lejeune B:The chloroplast generps4 as a tool for the study ofPoaceaephylogeny.Pl Syst Evol1994, 191:27-38.
•
13. Mathews S, Sharrock RA:The phytochrome gene family in grasses (Poaceae): a phylogeny and evidence that grasses have a subset of the loci found in dicot angiosperms.Mol Biol Evol1996,13:1141-1150.
The grasses have only three phytochrome loci (A,B, andC), in contrast to five in dicots. Sequences of these three loci for a set of phylogenetically disparate grasses indicate that the genes may be useful indicators of phy-logenetic relationship, which are similar to those inferred from chloroplast genes.
14. Hamby RK, Zimmer EA:Ribosomal RNA sequences for inferring phylogeny within the grass family (Poaceae).Plant Syst Evol
1988,160:29-37.
••
15. Kellogg EA:Relationships of cereal crops and other grasses. Proc Natl Acad Sci USA1998, in press.
Phylogenetic relationships among grasses are becoming increasingly well understood. Changes in genomic arrangement can be mapped onto the phylogeny, which permits inferences about the structure of the ancestral grass genome. The phylogeny also shows that genome size has decreased in several lineages, including rice, whereas it has increased substantially in the tribe Triticeae.
16. Kellogg EA, Campbell CS:Phylogenetic analysis of the Gramineae.InGrass Systematics and Evolution. Edited by Soderstrom TR, Hilu KW, Campbell CS, Barkworth ME. Washington, DC: Smithsonian Institution Press; 1987:310-322. 17. Clayton WD, Renvoize SA:Genera graminum. Kew Bulletin
Additional Series XIII. 1986, London: Her Majesty’s Stationery Office. 389.
18. Watson L, Dallwitz MJ:The grass genera of the world. Wallingford: CAB International; 1992.
•
19. Catalan P, Kellogg EA, Olmstead RG:Phylogeny of Poaceae subfamily Pooideae based on chloroplastndhF gene sequencing.Mol Phylog Evol1997,8:150-166.
Sequences of a portion of the chloroplast genendhF show that the core Pooideae — tribes Bromeae, Triticeae, Aveneae, and Poeae — form a clade.
Brachypodiumis sister to the core pooids, contradicting existing classifica-tions, but supporting recent molecular phylogenetic data. The earliest diverg-ing branches of the pooid clade, in order of divergence, areBrachyelytrum,
LygeumandPhaenosperma; these three genera had been difficult to place using morphological data.
20. Hsiao C, Chatterton NJ, Asay KH, Jensen KB:Molecular phylogeny of the Pooideae (Poaceae) based on nuclear rDNA (ITS) sequences.Theor Appl Genet1995,90:389-398.
•
21. Mason-Gamer RJ, Kellogg EA:Chloroplast DNA analysis of the monogenomic Triticeae: phylogenetic implications and genome-specific markers.InMethods of Genome Analysis in Plants.Edited by Jauhar P Boca Raton: CRC Press; 1996:301-325.
Restriction site maps of the chloroplast genome of the diploid Triticeae in-dicate thatTriticumandAegilopsform a clade. Each genus, which corre-sponds to a genomic group, is monophyletic. Diagnostic restriction site mark-ers are provided for each chloroplast. These should be useful for tracking cytoplasmic genomes in breeding programs.
•
22. Petersen G, Seberg O:Phylogenetic analysis of the Triticeae (Poaceae) based onrpoA sequence data.Mol Phylog Evol
1997,7:217-230.
Sequences forrpoA from the diploid Triticeae produced a phylogeny gener-ally congruent with that produced by restriction sites [21•]. Genera (genomic groups) are monophyletic. The amount of sequence variation in this region of the chloroplast was quite low (68 total variable nucleotides and seven insertion/deletion mutations among 31 species).
••
23. Kellogg EA, Appels R, Mason-Gamer RJ:When genes tell different stories: the diploid genera of Triticeae (Gramineae). Syst Bot1996,21:321-347.
plant. ITS sequences on chromosomes 1 and 5 appear to have undergone concerted evolution. The history of the group is best diagrammed as a net, rather than as a tree. This is unprecedented for a group of intersterile genera.
••
24. Mason-Gamer RJ, Kellogg EA:Testing for phylogenetic conflict among molecular data sets in the tribe Triticeae.Syst Biol
1996,45:524-545.
Gene trees for the diploid Triticeae are compared statistically to determine if they are significantly different. Several tests were applied, all leading to the conclusion that the gene trees available for the Triticeae reflect significantly different histories.
•
25. Castillo RO, Spooner DM:Phylogenetic relationships of wild potatoes,SolanumseriesConicibaccata(Sect.Petota).Syst Bot1997,22:45-83.
Accessions from throughout the range of seriesConicibaccatawere studied for morphological and chloroplast restriction site variation. Although the se-ries is currently thought to include 40 named species, the chloroplast data suggest that this may be an overestimate and the actual number may be closer to eight. This affects naming and classification of wild germplasm, as well as studies of evolution in the genusSolanum.
••
26. Bohs L, Olmstead RG:Phylogenetic relationships inSolanum
(Solanaceae) based onndhF sequences.Syst Bot1997,22 :5-17.
Sequences ofndhF show that the chloroplasts ofSolanumspecies are monophyletic.Capsicum(green and red pepper) is derived from within Ly-cianthes. Four of the subgenera ofSolanumare polyphyletic.Lycopersicon
(tomato) andCyphomandra(tree tomato) are derived from withinSolanum. Spines and stellate hairs have evolved more than once in the genus.
••
27. Olmstead RG, Palmer JD:Implications for the phylogeny, classification, and biogeography ofSolanumfrom cpDNA restriction site variation.Syst Bot1997,22:19-29.
Restriction site variation in the chloroplast DNA produces a phylogeny of
Solanumlargely congruent with that produced byndhF sequences [26••]. The genusSolanumapparently originated in the New World, and then sub-sequently spread to the Old World and Australia.
28. D’Arcy WG:The Solanaceae since 1976, with a review of its biogeography.InSolanaceae III: Taxonomy, Chemistry, Evolution. Edited by Hawkes JG, Lester RN, Nee M, Estrada-R. N. Richmond, Kew: Royal Botanic Gardens; 1991:75-137.
29. D’Arcy WG:Solanaceae studies II: typification of subdivisions ofSolanum. Ann Missouri Bot Gard1972,59:262-278. 30. Olmstead RG, Sweere JA:Combining data in phylogenetic
systematics: an empirical approach using three molecular data sets in the Solanaceae.Syst Biol1994,43:467-481.
•
31. Chen J-J, Janssen B-J, Williams A, Sinha N:A gene fusion at a homeobox locus: alterations in leaf shape and implications for morphological evolution.Plant Cell1997,9:1289-1304. A fusion of a phosphofructokinase gene with aknotted-class homeobox gene leads to the dominant mutation,Mouse earsin tomato. The homeobox gene,Let6, is overexpressed in the gene fusion, leading to increased leaf compounding. This sort of mutation may have led to the origin of novel phenotypes in evolution.
32. Olmstead RG, Reeves PA:Polyphyletic origin of the Scrophulariaceae: evidence fromrbcL andndhF sequences. Ann Missouri Bot Gard1995,82:176-193.
•
33. Wagstaff SJ, Olmstead RG:Phylogeny of Labiatae and Verbenaceae inferred fromrbcL sequences.Syst Bot1997, 21:165-179.
The mint family (Labiatae) and verbena family (Verbenaceae) have long been known to be close relatives. This study shows that their evolutionary his-tory is intertwined; neither family is monophyletic. They are part of a large clade that also includes Scrophulariaceae (itself polyphyletic), Bignoniaceae, Acanthaceae, and Gesneriaceae, as well as several other families. If this chloroplast phylogeny is indeed an accurate reflection of the organismic phylogeny, several characteristics of the gynoecium and of the fruit have evolved in parallel.
34. Price RA, Palmer JD, Al-Shehbaz IA:Systematic relationships ofArabidopsis: a molecular and morphological perspective.In
Arabidopsis. Edited by Meyerowitz EM, Somerville CR. Plainview NY: Cold Spring Harbor Laboratory Press; 1994:7-19.
•
35. O’Kane SL, Schaal BA, Al-Shehbaz IA:The origins of
Arabidopsis suecica(Brassicaceae) as indicated by nuclear rDNA sequences.Syst Bot1996,21:559-566.
suecicahas two ITS sequences, one fromA. thalianaand the other from ei-therC. arenosaorC. neglecta. Biogeography points toC. arenosaas being the parent, rather thanC. neglecta. Sequences of other putative relatives of
Arabidopsisshowed that they were more distantly related.
•
36. O’Kane SL, Al-Shehbaz IA:A synopsis ofArabidopsis
(Brassicaceae).Novon1997,7:323-327.
The genusArabidopsisis redefined to include nine species and five sub-species. Most of these had previously been in the genusCardaminopsis, although two had been inArabis. The remaining names inArabidopsisare excluded from the genus and have been or will be placed elsewhere. The taxonomic realignment is based on unpublished molecular phylogenetic data. 37. Al-Shehbaz IA:Erysimum hedgeanum(Brassicaceae), a new
name replacingArabidopsis erysimoides. Novon1994,4:1-2. 38. Al-Shehbaz IA, O’Kane SL:Placement ofArabidopsis parvulain
Thellungiella(Brassicaceae).Novon1995,5:309-310. 39. Al-Shehbaz IA, O’Kane SL:Arabidopsis gamosepalaandA.
tuemurnicabelong toNeotorularia(Brassicaceae).Novon1997, 7:93-94.
••
40. Warwick SI, Black LD:Phylogenetic implications of chloroplast DNA restriction site variation in subtribes Raphaninae and Cakilinae (Brassicaceae, tribe Brassiceae).Can J Bot1997, 75:960-973.
This study of two subtribes of the monophyletic tribe Brassiceae is the most comprehensive phylogeny for any portion of Brassicaceae. This follows several other papers by the same authors investigating chloroplast restric-tion site polymorphisms in other subtribes. The analysis shows that subtribe Cakilinae is monophyletic, but Raphaninae is polyphyletic. A lineage that the authors call RAPA-OLERACEA includesRaphanus, many economically important species ofBrassica, and three other genera.
41. Rodman JE, Karol KG, Price RA, Sytsma KJ:Molecules, morphology, and Dahlgren’s expanded order Capparales.Syst Bot1996,21:289-307.
42. Rodman J, Soltis P, Soltis D, Sytsma K, Karol K:PlastidrbcL
shouts and nuclear 18S-ribosomal DNA whispers, but the message is the same: Dahlgren cuts the mustard.Amer J Bot
1997,84(suppl):226.
43. Takhtajan AL:Outline of the classification of flowering plants (Magnoliophyta).Bot Rev1980,46:225-359.
44. Takhtajan A:Diversity and classification of flowering plants. 1997, New York: Columbia University Press.
45. Thorne RF:Classification and geography of the flowering plants.Bot Rev1981,58:225-348.
46. Dahlgren R:General aspects of angiosperm evolution and macrosystematics.Nord J Bot1983,3:119-149.
47. Cronquist A:An integrated system of classification of flowering plants. 1981, New York: Columbia University Press.
48. Chase MW, Soltis DE, Olmstead RG, Morgan D, Les DH, Mishler BD, Duvall MR, Price RA, Hills HG, Qiu Y-Let al.:Phylogenetics of seed plants: an analysis of nucleotide sequences from the plastid generbcL.Ann Missouri Bot Gard1993,80:528-580.
•
49. Rice KA, Donoghue MJ, Olmstead. RG:Analyzing large data sets:rbcL 500 revisited.Syst Biol1997,46:554-563.
Reanalysis of 499rbcL sequences found marginally shorter trees than de-scribed by Chaseet al.[48]. More importantly, this paper describes possible ways to sample large data sets so that the computational problem can be minimized. One solution may be to replace large clades with the sequences of their hypothetical ancestors.
•
50. Kellogg EA, Juliano ND:The structure and function of RuBisCO and their implications for systematic studies.Amer J Bot1997, 84:413-428.
Extensive structural data on RuBisCO have been largely ignored by systema-tists. The protein is under considerable functional constraint, which limits the amount of variation possible in evolutionary time. Protein sequences indicate that some plants may haverbcL pseudogenes, and in others the protein may have altered kinetics.
••
51. Soltis DE, Soltis PS, Nickrent DL, Johnson LA, Hahn WJ, Hoot SB, Sweere JA, Kuzoff RK, Kron KA, Chase MWet al.:Angiosperm phylogeny inferred from 18S ribosomal DNA sequences.Ann Missouri Bot Gard1997,84:1-49.
18S rRNA sequences were generated for 223 angiosperms. Phylogenetic analysis of these sequences gave results that were largely similar to those found in a previous study ofrbcL [48]. The earliest flowering plants had monosulcate pollen. From this group arose the monocot clade and a clade of dicots with tricolpate (three-grooved) pollen (the eudicots).
••
52. Soltis DE, Hibsch-Jetter C, Soltis PS, Chase MW, Farris JS: Molecular phylogenetic relationships among angiosperms: an
overview based onrbcL and 18S rDNA sequences.J Plant Res
1998, in press.
Information from a nuclear and a chloroplast gene (18S rRNA andrbcL, respectively) are combined to give a phylogeny of flowering plants. The in-creased amount of data gives stronger support to many groups. General re-sults are similar to those found for each data set alone. In addition, two large clades — Asteridae and Rosidae — are supported as making up the eudicots.
••
53. Soltis DE, Soltis PS, Mort ME, Chase MW, Savolainen V, Hoot SB, Morton CM:Inferring complex phylogenies using parsimony: an empirical approach using three large data sets for angiosperms.Syst Biol1998,46:in press.
Information from three genes — 18S rRNA,rbcL andatpB — give the most resolved picture yet for flowering plant relationships. This paper focuses on the effects of combining multiple genes. In general more is better, despite significant incongruence between the data sets. The ability of current com-puter programs to analyze very large data sets (200 taxa or more) is partly determined by the number of phylogenetically informative characters. 54. Judd WS, Sanders RW, Donoghue MJ:Angiosperm family pairs:
preliminary phylogenetic analyses.Harvard Pap Bot1994,5 :1-51.
55. Donoghue MJ, Doyle JA:Phylogenetic studies of seed plants and angiosperms based on morphological characters.InThe Hierarchy of Life: Molecules and Morphology in Phylogenetic Analysis. Edited by Fernholm B, Bremer K, J ¨ornvall H. Amsterdam: Elsevier Science Publishers; 1989:181-193.
56. Engler A, Prantl K:Die nat ¨urlichen Pflanzen Familien Teil II, Abt. 11889Teil IV, 1890-1997, [Title translation: The Natural Plant Families] Leipzig: Wilhelm Engelmann.
57. Bentham G, Hooker JD:Genera Plantarum, Vol. II.1873-1876, London: Reeve & Co.
58. Soltis DE, Soltis PS, Morgan DR, Swensen SM, Mullin BC, Dowd JM, Martin PG:Chloroplast gene sequence data suggest a single origin of the predisposition for symbiotic nitrogen fixation in angiosperms.Proc Natl Acad Sci USA1995, 92:2647-2651.
••
59. A database of phylogenetic knowledge on the World Wide Web URL: http//herbaria.harvard.edu/treebase/index.html
This is a prototype database that incorporates phylogenetic information on green plants. It can be searched by taxon or by author and will ultimately provide current information on relationships of many different plant groups.
•
60. Hillis DM:Inferring complex phylogenies.Nature1996, 383:130.
Despite previous suggestions that very large data sets were intractable, simulations suggest that a dense sampling of taxa plus a large number of phylogenetically informative characters (>5000) permit resolution of large phylogenetic problems.
61. Mathews S, Sharrock RA, Lavin M:Evolution of the phytochrome gene family and its utility for phylogenetic analyses of angiosperms.Ann Missouri Bot Gard1995,82:296-321.
•
62. Waters ER, Lee GJ, Vierling E:Evolution, structure and function of the small heat shock proteins in plants.J Exp Bot1996, 47:325-338.
Small heat-shock proteins fall into distinct gene families, corresponding to cytosolic, endoplasmic reticulum, and organellar proteins. The duplications leading to the different families occurred before the origin of angiosperms (>150 million years ago).
•
63. Morton BR, Gaut B, Clegg M:Evolution of alcohol
dehydrogenase genes in the palm and grass families.Proc Natl Acad Sci USA1996,93:11735-11739.
ThreeAdhgenes were cloned from a palm (Washingtonia robusta) and were compared toAdhgene sequences from grasses. Independent duplication events occurred in the two families. The history ofAdhgenes is a dynamic process of duplication and loss.
•
64. Sang T, Donoghue MJ, Zhang D:Evolution of alcohol dehydrogenase genes in peonies (Paeonia): phylogenetic relationships of putative nonhybrid species.Mol Biol Evol1997, 14:994-1007.
Adh1 produced a phylogeny similar to that produced by another nuclear marker (ITS) and a chloroplast gene (matK) in species ofPaeonia, but sig-nificantly different from the phylogeny indicated byAdh2. This is one of the few phylogenetic applications of low-copy number nuclear gene sequences in plants.
65. Mason-Gamer RJ, Kellogg EA:Potential utility of the nuclear genewaxyfor plant phylogenetic analysis.Amer J Bot1996, 83(suppl):178.
•
and has become a pseudogene. The gene is used to infer relationships among species ofClarkia. Gene silencing has occurred at least four different times inPgiC2.
67. Rieseberg LH, Soltis DE:Phylogenetic consequences of cytoplasmic gene flow in plants.Evol Trends Pl1991,5:65-84. 68. Wendel JF, Stewart JM, Rettig JH:Molecular evidence for
homoploid reticulate evolution in Australian species of
Gossypium.Evolution1991,45:694-711.
69. Wendel JF, Schnabel A, Seelanan T:An unusual ribosomal DNA sequence fromGossypium gossypioidesreveals ancient, cryptic, intergenomic introgression.Mol Phylo Evol1995,4 :298-313.
70. Soltis DE, Kuzoff RK:Discordance between nuclear and chloroplast phylogenies in theHeucheragroup (Saxifragaceae).Evolution1995,49:727-742.
••
71. Seelanen T, Schnabel A, Wendel JF:Congruence and consensus in the cotton tribe (Malvaceae).Syst Bot1997,22:259-290. Commercial cotton (Gossypium hirsutum) is an allotetraploid with genomes designated A and D. Its diploid progenitors are an A-genome cotton of Africa (G. herbaceum) and a D-genome cotton of South and Central America (G. raimondii). Among the genera of the tribe Gossypieae, nuclear (ITS) and chloroplast (ndhF) markers indicate the same relationships. Within Gossyp-ium, however, the chloroplast and ITS sequences have significantly different histories. Some of this can be attributed to known or suspected hybridiza-tion, leading to allopolyploids, or hybrid diploids. Other discrepancies are harder to explain. The paper discusses in considerable detail the various explanations for apparent differences in gene trees, including the possibil-ity of spurious differences caused by branching events occurring in rapid succession.
••
72. Bennetzen JL, Kellogg EA:Do plants have a one-way ticket to genomic obesity?Plant cell1997,9:1509-1514.
The phylogeny of the grasses is used to investigate the possibility that genome size always tends to increase. The answer depends on assump-tions about the likelihood of change, which in turn depends on knowledge of underlying mechanisms. If increase and decrease are assumed to be equally likely, then the small genomes of rice and sorghum are inferred to represent reductions from an ancestrally large genome. If, however, increase is assumed to be far more likely than decrease, then rice and sorghum may have retained the ancestral small genome.
••
73. Bharathan G:Reproductive development and nuclear DNA content in angiosperms.Amer J Bot1996,83:440-451. Phylogenies of monocotyledons are used to test whether genome size is correlated with several reproductive characters. Bisporic or tetrasporic em-bryo sacs often occur in families with large genomes; the correlation is not absolute, but is statistically significant. Bisporic and tetrasporic embryo sacs are characterised by a lack of synchrony between nuclear division and cy-tokinesis; the author suggests that asynchrony may be causally connected to
••
74. Swofford D:PAUP 4.0d59, test version. 1997, Sunderland: Sinauer Associates.
A remarkably flexible computer program with an excellent user-interface. This is the industry standard for phylogenetic studies. Without this program, few of the advances cited would have been possible.
75. Farris JS, Albert VA, K ¨allersj ¨o M, Lipscomb D, Kluge AG: Parsimony jack-knifing outperforms neighbor-joining.Cladistics
1996,12:99-124.
•
76. Doyle JJ:Trees within trees: genes and species, molecules and morphology.Syst Biol1997,46:537-553.
Just as the history of a species may be described by the history of multiple genes, the history of a gene may be described by multiple histories, some as small as a single nucleotide. The central problem in phylogeny reconstruction is reconciling differences among histories at different hierarchical levels. This is also a potential problem for phenotypic characteristics, which may have complex genetic and historical bases.
•
77. Maddison WP:Gene trees in species trees.Syst Biol1997, 46:523-536.
Species trees are made up of gene trees, some of which may have the same topology, but some of which may be different. Several reasons are known for discrepancies between gene trees and species trees. Species trees can be viewed as a statistical distribution, or ‘cloud’, of gene histories. 78. DeQueiroz A, Donoghue MJ, Kim J:Separate versus combined
analysis of phylogenetic evidence.Annu Rev Ecol Syst1995, 26:657-681.
79. Kluge AG:A concern for evidence and a phylogenetic hypothesis of relationships amongEpicrates(Boidae, Serpentes).Syst Zool1989,38:7-25.
80. Farris JS, K ¨allersj ¨o M, Kluge AG, Bult C:Testing significance of incongruence.Cladistics1994,10:315-319.
81. Bull JJ, Huelsenbeck JP, Cunningham CW, Swofford DL, Waddell PJ:Partitioning and combining data in phylogenetic analysis.Syst Biol1993,42:384-397.
82. Miyamoto MM, Fitch WM:Testing species phylogenies and phylogenetic methods with congruence.Syst Biol1995,44 :64-76.
83. Verboom GA, Linder HP, Barker NP:Haustorial synergids: an important character in the systematics of danthonioid grasses (Arundinoideae: Poaceae)?Amer J Bot1994,81:1601-1610. 84. Kellogg EA, Watson L:Phylogenetic studies of a large data
set. 1. Bambusoideae, Andropogonodae, and Pooideae (Gramineae).Bot Rev1993,59:273-343.