DIPTEROCARP FOREST IN SAMBOJA,
EAST KALIMANTAN
Haruni Krisnawati1,2, Djoko Wahjono3 and Rinaldi Imanuddin1
ABSTRACT
he dynamics of species composition, stand structure and aboveground biomass were studied over a 4.3-yr period (December 2004 – April 2009) in a lowland dipterocarp forest of Samboja, East Kalimantan. his study was conducted in six permanent sample plots (100 m x 100 m each) distributed over an area of 26.5 ha of Samboja Research Forest. All woody plants ≥ 10 cm dbh (diameter at 1.3 m aboveground) were identiied. In December 2004, 2.143 trees were measured in the six plots, consisting of 39 families, 82 genera and 111 species. he condition in April 2009 (ater 4.3 yr) was: 2,466 trees, 40 families, 86 genera and 123 species. Most species were found in both occasions. Fourteen new species were registered, which contributed to 9.8% of a net addition of the total number of species found in the six plots. Over the 4.3-yr period, there was also an increase of 15.1% in density, 12.9% in basal area, and 11.6% in aboveground biomass, respectively. he density increased from 357 to 411 trees per ha; the basal area increased from 20.09 to 22.67 m2 ha-1; and the aboveground biomass increased from 286.3 to 319.4 ton ha-1. he
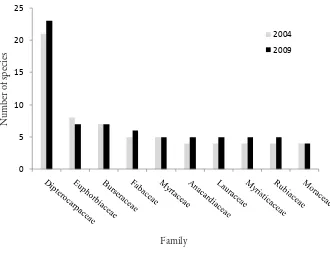
family Dipterocarpaceae was the richest in species (more than 20 species found in both occasions), followed by Euphorbiaceae, Burseraceae, Fabaceae, and Anacardiaceae (more than ive species). Most genera (80%) contained just one species, but Shorea with 13 species was the richest. Four families (Dipterocarpaceae, Fabaceae, Myrtaceae and Lauraceae) contained more than 80% of the aboveground biomass in both occasions (75% of them from Dipterocarpaceae family). he increases in species richness and density did not cause any signiicant diferences in the diversity index and diameter distribution. his condition suggested that forest vegetation of the study site maintains its diversity composition and structural features over the period of study.
Keywords: stand dynamic, structure, biomass, permanent plots, tropical forest
I. INTRODUCTION
Sustainable forest management is an important issue in Indonesia. Sound forest management cannot possibly be applied without an understanding of the basic ecology of the forests. One prerequisite for sustainable forest management is reliable information
1 Center for Forest Conservation and Rehabilitation Research and Development, Forestry Research and Development Agency. Jl. Gunung Batu No. 5 Bogor, Indonesia.
2 Corresponding Author. E-mail: [email protected]
on stand dynamics and its characteristics since it is essential to know how the forest will grow and respond to natural conditions or occasional disturbances. However, little information is available regarding the dynamics of species composition, structural and productivity (biomass) changes of the tropical forests in Indonesia over time.
Most studies in Indonesia are based on surveys on compositional and structural patterns of certain sites or forests at one occasion (e.g. Kartawinata et al., 1981; Riswan, 1987; Suselo and Riswan, 1987; Sist and Saridan, 1998; Heriyanto, 2001; Krisnawati, 2003). Forest vegetations, however, are dynamic and changes occur continuously at individual and species population levels throughout time, eventhough the vegetation as a whole is expected to be stable, as a result of a balance between growth, recruitment and mortality. Several studies on forest dynamics in other tropical regions have been conducted (e.g. Lieberman et al., 1985; Manokaran and Kochummen, 1987; Swaine et al., 1987); however, a better understanding of the tropical forest dynamics particularly in Indonesian forests is still limited. Measurement of permanent sample plots at certain intervals and over a long period is therefore required for understanding of the process in which the changes occur at individual, species and stand or community levels.
he objective of this study was to analyse the changes in species composition, stand structure, and aboveground biomass of the woody plants of a lowland dipterocarp forest in the Samboja Research Forest, East Kalimantan, over a period of time (December 2004 - April 2009). he results were expected to provide an insight whether the forest vegetation in the study site would maintain its species composition and structural characteristics over the period of time.
II. MATERIALS AND METHODS
A. Site Description
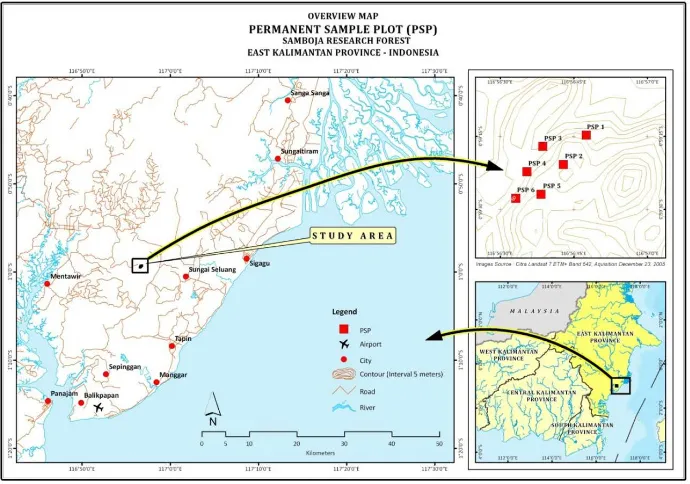
his study was conducted in the 26.5 ha of 504 ha remaining Samboja Research Forest, 4.5 km from the starting point of Samboja-Semoi route (0°59’ N latitude and 116.56° E longitude, Figure 1). his unlogged natural forest was considered as a miniature of tropical rain forest in Kalimantan due to its high biodiversity (Gunawan
et al., 2007). About 296 species of 54 families including species of Palmae have been reported to inhabit this forest (Yassir and Juliati, 2003).
he site is located at the village of Sungai Merdeka, the Sub-District of Samboja, District of Kutai Kartanegara, East Kalimantan Province. The average annual precipitation in the site ranges from 1,682 to 2,314 mm with the number of rainy days of 72–154 days per year. he average temperature is about 26–28 oC with the minimum value in the day time of 23.3 oC and the maximum value in the night time of 32.7 oC. he humidity ranges from 63 to 89% (Adinugroho et al., 2006;Atmoko, 2007).
may reach 60% (Gunawan et al., 2007). he dominant soil type includes ultisol which is typically quite acidic and deicient in major nutrients, such as calcium and potassium. Geologically, the soil is mostly derived from tertiary sedimentary rocks.
B. Methods
he study was based on the results of the monitoring of six permanent sample plots (100 m x100 m square plot of 1 ha each; Figure 1) distributed over an area of 26.5 ha of Samboja Research Forest. All plots were irst delineated on the ground to cover the range of topography of the site. Each plot was divided into 100 sub-plots (quadrats) of 10 m x 10 m to allow a better control of measurement and monitoring. he plot establishment and the irst measurement were conducted in December 2004 and then re-measured in May 2006, June 2008, and April 2009 (in total 4 measurements). However, only the irst and fourth measurements covering a period of 4 years and 4 months (approximately 4.3 years) were reported in the present study.
In each plot, all woody plants of at least 10 cm dbh (diameter at 1.3 m aboveground) were marked, identiied and measured. he dbh of every target tree was measured at each measurement, and dead and newly recruited target trees were registered at each re-measurement time. Tree height was measured by using a hagameter for all trees in the plots for the irst and second measurements and 100 trees with various dbh (one
tree in each sub-plot) for the third and fourth measurements. All trees in the plots were mapped, but no analysis was done at the individual level.
All tree specimens were collected and identiied in the herbarium collection of the Samboja Forestry Research Institute. Alist of species was compiled at each measurement. Shannon's diversity and Pielou's evenness indices were calculated for each occasion (Magurran, 1988; Ludwig and Reynolds, 1988). Stand density (number of trees), basal area, and aboveground biomass were also calculated at each occasion (Husch et al. 2003). he aboveground biomass was estimated using allometric equations developed by Yamakura et al. (1986) for undisturbed tropical lowland rain forests in Sebulu, East Kalimantan province. he site of their study was considered to have similar characteristics with this study site in terms of forest type, topography, climate, soil type, and dominant family in the forests. Changes in the species composition, stand density, basal area, and aboveground biomass were analysed and then compared at each assessment. he diferences of diameter distribution between the two occasions were also tested using a Kolmogorov-Smirnov two sample test (Zarr, 2006).
III. RESULTS AND DISCUSSION
A. Species Composition
In December 2004 2,143 trees of ≥ 10 cm in diameter were measured in six permanent sample plots of the Samboja Research Forest. hey consisted of 39 families, 82 genera and 111 species. he condition in April 2009 (ater 4.3 yr) was: 2466 trees, 40 families, 86 genera and 123 species. he list of species and families found in these plots for both measurement times was presented in Appendix 1.
Most species were found in both occasions (2004 and 2009), except for Garcinia nervosa and Trigonostemon laevigatus that did not occur in 2009, although these species might still be present below the diameter limit (10 cm) used in this study. Fourteen new species were registered (i.e. Actinodaphne malaccensis, Albizia minahasae, Diospyros confertifolia, Durio oxleyanus, Knema conferta, Magnolia borneensis, Palaquium pseudorostratum, Palaquiun gutta, Parishia insignis, Porterandia anisophylla, Dillenia sp.,
Durio sp. Parashorea sp., and Shorea sp.1), which contributed to 9.8% of a net addition of the total number of species found in the study site over the 4.3-yr period.
he species that disappeared from the plots occurred at low density in the study area (less than one tree per ha) and any cause of mortality might eliminate them from the plots. However, their absence might be replaced by newly recruited trees due to ingrowth. hese species might have also been represented in the study site as smaller individuals. he same state applied to the new species that entered the plots.
Fabaceae, and Myrtaceae (more than ive species found in both occasions) (Figure 2). Most genera (80%) contained just one species; however, Shorea was the richest genus consisting of 13 species.
he indices of Shannon’s diversity and Pielou's evenness were 3.34 and 0.71 in 2004, respectively; and 3.33 and 0.69 in 2009. Result of statistical t-test (Zarr, 2006) indicated that these values were not diferent (P < 0.05) meaning that the changes in species richness over the period of 4.3-yr did not cause any diference in the value of Shannon 's diversity index, which is little afected by rare species. Approximately 70% of the species found in the plots were rare species (low density) with only less than one tree (dbh ≥ 10 cm) per ha. However, this low density of the species is typically found in tropical rain forests (Whitmore, 1984). Although the majority of species have been found with a low density, the forest state in the study area can still be considered to be stable, as the value of Shannon's diversity index is above 3.0 (Odum, 1971). his result suggested that the vegetation of the study site maintains its original composition.
B. Stand Structure
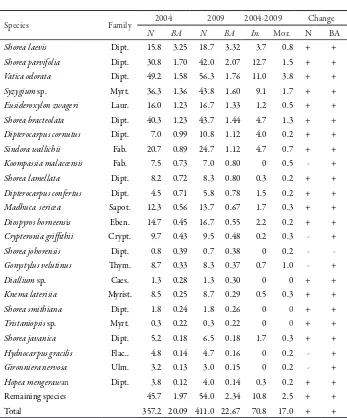
In the irst measurement (December 2004), 15 species comprised about 80% of the stand basal area (BA) and 77% of the stand density (N)over 10 cm dbh (Table 1). All of
these were categorized as commercial species. Of these species, half of them were from Dipterocarpaceae family which contributes to 44% of the stand density and 53% of the basal area. Most of them are fast growing and shade tolerant. he most abundant species was Vatica odorata, followed by Shorea bracteolata and Shorea parvifolia.
Ater the 4.3 yr period, the same species still comprised 80% of the stand basal area but the ranking changed slightly (Table 1). Shorea bracteolata ranked ith in basal area (higher than Eusideroxylon zwageri),since more recruited trees of this species entered the plots. However, in terms of stand density the ranking retained the same. A study conducted by Silva et al. (1995) in the logged-over area of the Tapajós Forest, Brazil, found a slight change in species ranking; but another study, conducted in the same site of the Brazilian Amazon (Carvalho, 1992, citedinSilva et al., 1995), found no major changes in species ranking before and ater logging.
In general, the stand density in the study site increased by 15.1% from 357 trees per ha to 411 trees per ha over the 4.3 yr period. Similarly, the basal area increased by 12.9% from 20.09 m2 ha-1 to 22.67 m2 ha-1. he same trends applied to all individual plots ranging from 5.8 to 24.5% in density and from 9.8 to 17.7% in basal area. he positive changes in density found in this study probably due to more species and more recruited trees entered the plots. he number of trees that pass the minimum diameter limit was about 71 trees per ha over 4.3 yr (or 16 trees ha-1 yr-1), while the mortality was lower (about 17 trees per ha over 4.3 yr or 4 trees ha-1 yr-1). he loss of basal area by death of some trees was lower than the gain by growth of surviving trees. Most of species showed a positive balance in basal area (Table 1).
Compared with other studies conducted in several other topical forests, the change or the increase found in this study was greater which was probably due to an increase in the number of recruited trees and the fast growth of some species (particularly from Dipterocarpaceae family). Felili (1995) reported a reduction of 2% in density over 5 cm dbh for a 6-yr period for a gallery forest located in the Central Brazil. Another study by Felili et al. (2000) for a forest site in Brazil also showed a reduction (4.5%) in density over a 9-yr period. On the other hand, Silva et al. (1995) found an addition of 13% in density for a 11-yr period for a logged-over forest also located in Brazil. he increase in density was also reported by Carvalho (1992), cited in Silva et al. (1995), who found an addition of 1% for an Amazonian site over 8-yr period. Several other studies in Malaysian dipterocarp forest (Manokaran and Kochumen, 1987) and in Ghana forest (Swaine et al. 1987) showed smaller variation in density over the study period than in this study (Table 1).
gaps formed previously), the stand state can be said to reach the dynamic equilibrium, and therefore, maintaining the structure of the vegetation over time.
Table 1. Changes in stand density (N) and basal area (BA) of the six permanent plots in the Samboja Research Forest, East Kalimantan
(December 2004-April 2009) listed based on basal area
Species Family 2004 2009 2004-2009 Change
N BA N BA In. Mor. N BA
Shorea laevis Dipt. 15.8 3.25 18.7 3.32 3.7 0.8 + +
Shorea parvifolia Dipt. 30.8 1.70 42.0 2.07 12.7 1.5 + +
Vatica odorata Dipt. 49.2 1.58 56.3 1.76 11.0 3.8 + +
Syzygium sp. Myrt. 36.3 1.36 43.8 1.60 9.1 1.7 + +
Eusideroxylon zwageri Laur. 16.0 1.23 16.7 1.33 1.2 0.5 + +
Shorea bracteolata Dipt. 40.3 1.23 43.7 1.44 4.7 1.3 + +
Dipterocarpus cornutus Dipt. 7.0 0.99 10.8 1.12 4.0 0.2 + +
Sindora wallichii Fab. 20.7 0.89 24.7 1.12 4.7 0.7 + +
Koompassia malaccensis Fab. 7.5 0.73 7.0 0.80 0 0.5 - +
Shorea lamellata Dipt. 8.2 0.72 8.3 0.80 0.3 0.2 + +
Dipterocarpus confertus Dipt. 4.5 0.71 5.8 0.78 1.5 0.2 + +
Madhuca sericea Sapot. 12.3 0.56 13.7 0.67 1.7 0.3 + +
Diospyros borneensis Eben. 14.7 0.45 16.7 0.55 2.2 0.2 + +
Crypteronia griithii Crypt. 9.7 0.43 9.5 0.48 0.2 0.3 - +
Shorea johorensis Dipt. 0.8 0.39 0.7 0.38 0 0.2 -
-Gonystylus velutinus hym. 8.7 0.33 8.3 0.37 0.7 1.0 - +
Diallium sp. Caes. 1.3 0.28 1.3 0.30 0 0 + +
Knema laterisia Myrist. 8.5 0.25 8.7 0.29 0.5 0.3 + +
Shorea smithiana Dipt. 1.8 0.24 1.8 0.26 0 0 + +
Tristaniopsis sp. Myrt. 0.3 0.22 0.3 0.22 0 0 + +
Shorea javanica Dipt. 5.2 0.18 6.5 0.18 1.7 0.3 + +
Hydnocarpus gracilis Flac.. 4.8 0.14 4.7 0.16 0 0.2 - +
Gironniera nervosa Ulm. 3.2 0.13 3.0 0.15 0 0.2 - +
Hopea mengerawan Dipt. 3.8 0.12 4.0 0.14 0.3 0.2 + +
Remaining species 45.7 1.97 54.0 2.34 10.8 2.5 + +
Total 357.2 20.09 411.0 22.67 70.8 17.0 + +
Notes: N = number of trees per ha; BA = basal area (m2 ha-1); In = ingrowth (number of recruited trees per ha);
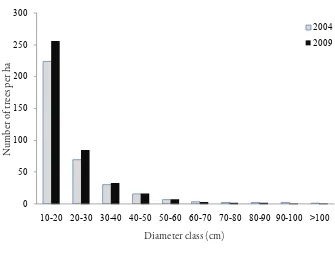
he diameter distribution of surviving trees for both occasions in December 2004 and April 2009 (Figure 3), showed a reversed-J shape which indicated a continuous ingrowth. he same trends applied to other diameter distributions for other years. For dead trees, numbers of mortality tend to decrease with increasing diameter. he diameter distributions showed that the number of trees at each diameter class generally increased over 4.3 yr period. However, the diferences were not signiicant between the two occasions; the test statistic of the Kolmogorov-Smirnov two sample test (K-S) was 0.0062. he distributions between 2004 and other years (2006 and 2008) were also not signiicantly diferent (K-S of 2004-2006 = 0.0179; K-S of 2004-2008 = 0.0056). he same results were found by e.g. Swaine et al. (1987) for moist semi-deciduous forest in Kade, Ghana over a 14 yr period and Felili et al. (2000) for savanna woodland in Brazilian Amazon over a 9 yr period.
C. Aboveground Biomass
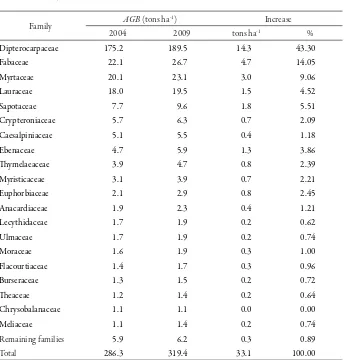
Four families (Dipterocarpaceae, Fabaceae, Myrtaceae and Lauraceae) contained more than 80% of the aboveground biomass (≥ 10cm dbh) in both 2004 and 2009 (Table 2). Of these, almost 75% of them were from Dipterocarpaceae family which comprised about 43% of the total aboveground biomass contained in the plots. he
0
10-20 20-30 30-40 40-50 50-60 60-70 70-80 80-90 90-100 >100
N
highest value in the amount of aboveground biomass belonged to Shorea parvifolia, followed by Sindora wallichii and Shorea bracteolata. hese three species contributed to a net addition of 30% of total aboveground biomass.
Table 2. Changes in aboveground biomass (AGB) of the six permanent plots in the Samboja Research Forest, East Kalimantan (December 2004-April 2009)
Family AGB (tons ha
-1) Increase
2004 2009 tons ha-1 %
Dipterocarpaceae 175.2 189.5 14.3 43.30
Fabaceae 22.1 26.7 4.7 14.05
Myrtaceae 20.1 23.1 3.0 9.06
Lauraceae 18.0 19.5 1.5 4.52
Sapotaceae 7.7 9.6 1.8 5.51
Crypteroniaceae 5.7 6.3 0.7 2.09
Caesalpiniaceae 5.1 5.5 0.4 1.18
Ebenaceae 4.7 5.9 1.3 3.86
hymelaeaceae 3.9 4.7 0.8 2.39
Myristicaceae 3.1 3.9 0.7 2.21
Euphorbiaceae 2.1 2.9 0.8 2.45
Anacardiaceae 1.9 2.3 0.4 1.21
Lecythidaceae 1.7 1.9 0.2 0.62
Ulmaceae 1.7 1.9 0.2 0.74
Moraceae 1.6 1.9 0.3 1.00
Flacourtiaceae 1.4 1.7 0.3 0.96
Burseraceae 1.3 1.5 0.2 0.72
heaceae 1.2 1.4 0.2 0.64
Chrysobalanaceae 1.1 1.1 0.0 0.00
Meliaceae 1.1 1.4 0.2 0.74
Remaining families 5.9 6.2 0.3 0.89
Total 286.3 319.4 33.1 100.00
recruitment and growth of some species. However, the increase of aboveground biomass over the 4.3 yr was not signiicantly diferent. No signiicant change was found in the biomass with time. Most of families showed smaller change (less than 1 tons ha-1) in the aboveground biomass during the 4.3 yr period (Table 2), suggesting that carbon uptake by these families was limited over the 4.3 yr period.
IV. CONCLUSION
he number of species, stand density, basal area and aboveground biomass of the woody plants ≥10 cm dbh increased over 4.3 yr. he changes in stand density and basal area in the Samboja Research Forest were greater than those found in several other tropical forests. hese increases were probably due to more species entered the plots and more recruited trees passing the minimum diameter limit used in this study in addition to the fast growth of some species growing in the plots.
he increases in species richness and density, however, did not cause any signiicant diferentiation in the diversity index and diameter distribution, respectively. his condition suggested that forest vegetation of the study site maintains its diversity composition and structural features over the period of study. Longer-term monitoring with regular measurements, however, is necessary to clarify these trends.
ACKNOWLEDGEMENT
We are grateful to the Center for Forest Conservation and Rehabilitation Research and Development (formerly Center for Forest and Nature Conservation Research and Development), Forestry Research and Development Agency of Indonesia for providing inancial support to conduct this research. hanks are also due to the Samboja Forestry Research Institute for providing us with the necessary research supports during our ieldworks and the herbarium staf for identiication of the collected plant materials. Our technicians and local ield crew from Samboja were thanked for assisting us in the ield measurements. Part of this study was presented at the International Annual Meeting of the Association for Tropical Biology and Conservation, 19-23 July 2010, Sanur, Bali (Indonesia).
REFERENCES
Adinugroho, W.C., D. Setiabudi, W. Gunawan, T. Atmoko and Noorcahyati. 2006. Potensi dan hambatan pengelolaan Kawasan Hutan dengan Tujuan Khusus (KHDTK) Penelitian Samboja. Prosiding Seminar Bersama Hasil-hasil Penelitian 3 UPT Badan Litbang Kehutanan Tahun 2006. (Unpublished report).
Felili, J.M. 1995. Growth, recruitment and mortality in the Gama gallery forest in Central Brazil over a six-year period (1986-1991). Journal of Tropical Ecology 11: 67–83.
Felili, J.M., A.V. Rezende, M.C. Silva Jr. and M.A. Silva. 2000. Changes in the loristic composition of Cerrado sensu stricto in Brazil over a nine-year period. Journal of Tropical Ecology 16: 579–590.
Gunawan, W., W.C. Adinugroho and Noorhidayah. 2007. Prospek pengembangan Rintis Wartono Kadri menjadi Unit Pendidikan Konservasi Alam dan Interpretasi Lingkungan (UPKA-ILS). Paper presented at the Seminar “Pemanfaatan Hasil Hutan Bukan Kayu dan Konservasi Biodiversitas Menuju Hutan Lestari”. (unpublished report).
Heriyanto, N.M. 2001. Komposisi dan penyebaran jenis tumbuhan di hutan bekas tebangan dan hutan primer, Maluku Tengah. Buletin Penelitian Hutan629: 31–42. Husch, B., T.W. Beers and J.A. Kershaw. 2003. Forest Mensuration (4th edition). John
Wiley & Sons, Inc., New Jersey. 443p.
Kartawinata, K., A. Rochadi and J. Partomihardjo. 1981. Composition and structure of a lowland dipterocarp forest at Wanariset Samboja, East Kalimantan (Indonesia). Malayan Forester44: 397–406.
Krisnawati, H. 2003. Struktur tegakan dan komposisi jenis hutan alam bekas tebangan di Kalimantan Tengah. Buletin Penelitian Hutan 639: 1–19.
Lieberman, D., M. Lieberman, R. Peralta and G.S. Hartshorn. 1985. Mortality patterns and stand turnover rates in a wet tropical forest in Costa Rica. Journal of Tropical Ecology 73: 915–924.
Ludwig, J.A. and J.F. Reynolds. 1988. Statistical Ecology: A primer on methods and computing. John Wiley & Sons, New York. 337p.
Magurran, A.E. 1988. Ecological Diversity and Its Measurement. Princeton University Press, New Jersey, 179p.
Manokaran, N. and M.N. Kochumen. 1987. Recruitment, growth and mortality of tree species in a lowland dipterocarp forest in Peninsular Malaysia. Journal of Tropical Ecology3: 315–330.
Odum, E.P. 1971. Fundamentals of Ecology (3rd edition). W.B. Saunders, Coy, Philadelphia. 574p.
Silva, J.N.M., J.O.P. de Carvalho, J.D.C.A. de Lopes, B.F. de Almeida, D.H.M. Costa, L.C. de Oliveira, J.K. Vanclay and J.P. Skovsgaard. 1995. Growth and yield of a tropical rain forest in the Brazilian Amazon 13 years ater logging. Forest Ecology and Management 71: 267–274.
Sist, P. and A. Saridan. 1998. Description of the primary lowland forest of Berau. In: J-G. Bertault and K. Kadir (Eds.). 1998. Silvicultural research in a lowland mixed dipterocarp forest of East Kalimantan, the Contribution of STREK project, CIRAD-forêt, FORDA, and PT. INHUTANI I. CIRAD-forêt Publication. Pp. 51–93.
Suselo, T.B. and S. Riswan. 1987. Compositional and structural pattern of lowland mixed dipterocarp forest in the Kutai National Park, East Kalimantan. In: A.J.G.H Kostermanns (Ed.). Proceedings of the 3rd International Round Table Conference on Dipterocarps.UNESCO, Jakarta, Indonesia. Pp. 459–470.
Swaine, M.D., J.B. Hall and I.J. Alexander. 1987. Tree populations dynamics at Kade, Ghana (1968-1982). Journal of Tropical Ecology 3: 359–366.
Whitmore, T.C. 1984. Tropical Rain Forest of the Far East (2nd edition). Clarendon Press, Oxford. 352p.
Yamakura, T., A. Hagihara, S. Sukardjo and A. Ogawa. 1986. Aboveground biomass of tropical rain forest stands in Indonesian Borneo. Vegetatio 68: 71–82.
Yassir, I. dan N. Juliati. 2003. Prospek pengembangan Rintis Wartono Kadri sebagai arboretum di Wanariset Samboja. Dipterokarpa 7: 12–23.
APPENDIX 1. List of species and families found in the six permanent plots of Samboja Research Forest (listed alphabetically)
No Species Family Year of Measurement
2004 2009
(1) (2) (3) (4) (5)
1 Actinodaphne malaccensis Lauraceae √
2 Aglaia sp. Meliaceae √ √
3 Alangium javanicum Alangiaceae √ √
4 Albizia minahasae Fabaceae √
5 Alstonia iwahigensis Apocynaceae √ √
6 Anisoptera costata Dipterocarpaceae √ √
7 Anthocephalus chinensis Rubiaceae √ √
8 Aquilaria microcarpa hymelaeaceae √ √
9 Archidendron microcarpum Fabaceae √ √
10 Artocarpus anisophyllus Moraceae √ √
11 Artocarpus dadah Moraceae √ √
12 Artocarpus niditus Moraceae √ √
13 Artocarpus sp. Moraceae √ √
14 Atuna racemosa Chrysobalanaceae √ √
15 Barringtonia macrostachya Lecythidaceae √ √
16 Beilschmiedia sp. Lauraceae √ √
17 Buerhavia paniculata Lauraceae √ √
18 Canarium littorale Burseraceae √ √
19 Canarium pilosum Burseraceae √ √
20 Chaetocarpus castanocarpus Euphorbiaceae √ √
21 Chionanthus sp. Olaceae √ √
22 Cotylelobium melanoxylon Dipterocarpaceae √ √
23 Cotylelobium sp. Dipterocarpaceae √ √
24 Cratoxylum sumatranum Hypericaceae √ √
25 Crypteronia griithii Crypteroniaceae √ √
26 Dacryodes costata Burseraceae √ √
27 Dacryodes rubiginosa Burseraceae √ √
28 Dacryodes rugosa Burseraceae √ √
29 Diallium indum Caesalpiniaceae √ √
30 Diallium sp. Caesalpiniaceae √ √
Appendix 1 (continued)
(1) (2) (3) (4) (5)
32 Diospyros borneensis Ebenaceae √ √
33 Diospyros confertifolia Ebenaceae √
34 Dipterocarpus confertus Dipterocarpaceae √ √
35 Dipterocarpus cornutus Dipterocarpaceae √ √
36 Dipterocarpus sp. Dipterocarpaceae √ √
37 Dracontomelon dao Anacardiaceae √ √
38 Drymicarpus luridus Anacardiaceae √ √
39 Dryobalanops sp. Dipterocarpaceae √ √
40 Drypetes crassipes Euphorbiaceae √ √
41 Durio griithii Malvaceae √ √
42 Durio oxleyanus Malvaceae √
43 Durio sp. Malvaceae √
44 Dyera costulata Apocynaceae √ √
45 Dysoxylum sp. Meliaceae √ √
46 Endiandra kingiana Lauraceae √ √
47 Eugenia stapiana Myrtaceae √ √
48 Eusideroxylon zwageri Lauraceae √ √
49 Garcinia nervosa Guttiferae √
50 Gironniera nervosa Ulmaceae √ √
51 Gluta aptera Anacardiaceae √ √
52 Gluta speciosa Anacardiaceae √ √
53 Gonystylus velutinus hymelaeaceae √ √
54 Gordonia borneensis heaceae √ √
55 Hopea mengerawan Dipterocarpaceae √ √
56 Hydnocarpus gracilis Flacourtiaceae √ √
57 Kibatalia pillosa Apocynaceae √ √
58 Knema conferta Myristicaceae √
59 Knema laterisia Myristicaceae √ √
60 Knema sp. Myristicaceae √ √
61 Kokoona relexa Celastraceae √ √
62 Koompassia malaccensis Fabaceae √ √
63 Lansium domesticum Meliaceae √ √
64 Licania splendens Chrysobalanaceae √ √
Appendix 1 (continued)
(1) (2) (3) (4) (5)
66 Macaranga hypoleuca Euphorbiaceae √ √
67 Macaranga lowii Euphorbiaceae √ √
68 Madhuca sericea Sapotaceae √ √
69 Madhuca pierrei Sapotaceae √ √
70 Magnolia borneensis Magnoliaceae √
71 Magnolia lasia Magnoliaceae √ √
72 Messua sp. Guttiferae √ √
73 Myristica iners Myristicaceae √ √
74 Myristica maxima Myristicaceae √ √
75 Neoscortechinia kingii Euphorbiaceae √ √
76 Nephelium sp. Sapindaceae √ √
77 Oncosperma horridum Palmae √ √
78 Palaquium pseudorostratum Sapotaceae √
79 Palaquium gutta Sapotaceae √
80 Parashorea sp. Dipterocarpaceae √
81 Parisia insignis Anacardiaceae √
82 Parkia speciosa Fabaceae √ √
83 Pellacalyx sp. Rhizophoraceae √ √
84 Pentace laxilora Tiliaceae √ √
85 Pertusadina euryncha Rubiaceae √ √
86 Pholidocarpus sp. Palmae √ √
87 Ptychopyxis javanica Euphorbiaceae √ √
88 Pimelodendron griitii Euphorbiaceae √ √
89 Pithecellobium rosulatum Fabaceae √ √
90 Polyalthia sp. Annonaceae √ √
91 Porterandia anisophylla Rubiaceae √
92 Prysmatomeris sp. Rubiaceae √ √
93 Pterospermum sp. Sterculiaceae √ √
94 Quercus sp. Fagaceae √ √
95 Rhodamnia cinerea Myrtaceae √ √
96 Sandaricum sp. Meliaceae √ √
97 Santiria griithii Burseraceae √ √
98 Santiria oblongifolia Burseraceae √ √
Appendix 1 (continued)
(1) (2) (3) (4) (5)
100 Schima wallichii heaceae √ √
101 Scorodocarpus borneensis Olacaceae √ √
102 Shorea bracteolata Dipterocarpaceae √ √
103 Shorea javanica Dipterocarpaceae √ √
104 Shorea johorensis Dipterocarpaceae √ √
105 Shorea laevis Dipterocarpaceae √ √
106 Shorea lamellata Dipterocarpaceae √ √
107 Shorea mujongensis Dipterocarpaceae √ √
108 Shorea ovalis Dipterocarpaceae √ √
109 Shorea parvifolia Dipterocarpaceae √ √
110 Shorea paucilora Dipterocarpaceae √ √
111 Shorea smithiana Dipterocarpaceae √ √
112 Shorea sp.1 Dipterocarpaceae √
113 Shorea sp.2 Dipterocarpaceae √ √
114 Shorea sp.3 Dipterocarpaceae √ √
115 Sindora wallichii Fabaceae √ √
116 Syzygium sp. Myrtaceae √ √
117 Tarenna rostata Rubiaceae √ √
118 Trigonostemon laevigatus Euphorbiaceae √
119 Tristaniopsis sp. Myrtaceae √ √
120 Vatica odorata Dipterocarpaceae √ √
121 Vitex sp. Lamiaceae √ √
122 Xanthophyllum griithii Polygalaceae √ √
123 Xerospermum noronhianum Sapindaceae √ √
124 Xylopia sp. Annonaceae √ √
125 Unidentiied species √ √
Total species 111 123