OECD Economic Surveys
Latvia
September 2017
OVERVIEW
This Overview is extracted from the 2017 Economic Survey of Latvia. The Survey is published on
the responsibility of the Economic and Development Review Committee (EDRC) of the OECD,
which is charged with the examination of the economic situation of member countries.
This document and any map included herein are without prejudice to the status of or sovereignty
over any territory, to the delimitation of international frontiers and boundaries and to the name
of any territory, city or area
OECD Economic Surveys: Latvia© OECD 2017
Executive summary
● The Latvian Economy has grown robustly but not enough for strong convergence in living standards
● Boosting growth requires better export performance
The Latvian Economy has grown robustly but not enough for strong convergence in living
standards
Latvia’s economy has grown robustly in recent years on the back of a strong track record in implementing structural reforms, despite a challenging international environment. Rising wages have supported household consumption. After a severe setback in 2008-09, catch-up with higher income OECD countries may have resumed. Government finances are solid and financial market confidence in Latvia is strong. Private sector indebtedness is now lower than in many OECD economies. Unemployment has fallen but remains high, adding to poverty. Many young Latvians emigrate. Informal economic activity is still widespread. Improving access to housing, health care, education and training would improve economic opportunities for low-income households and requires additional government spending.
Boosting growth requires better export performance
Export performance, including diversification of products and destinations, is improving, but Latvia’s exports still rely heavily on low value-added, natural resource intensive products, reflecting in part skills shortages and weak innovation. Few Latvian firms participate in global value chains, although those which do have much higher productivity, employment and wages. Weak credit recovery from insolvent firms holds back access to credit for firms with growth potential. Skill mismatch and widespread informality prevent firms from moving up the global value chains.
Better access to housing, jobs and health care would boost inclusive growth
High long-term unemployment, weak social safety nets and high labour taxes for workers on low pay contribute to widespread poverty. Unemployment is particularly high in Eastern regions of Latvia. Many low-income households are inadequately housed. Few Latvians live in rented housing, which reduces their mobility, and social housing is scarce, especially in the Riga area, where unemployment is low and good jobs more abundant. High out-of-pocket payments for health services limit access of low-income households to health services.
The gap in GDP per capita remains large
Gap vis-à-vis the upper half of OECD countries¹
1. Percentage gap with respect to the weighted average using population weights of the highest 17 OECD countries in terms of GDP per capita and GDP per hour worked (in constant 2010 PPPs). Source: OECD (2017), OECD National Accounts Statistics and Productivity Statistics (database).
1 2 http://dx.doi.org/10.1787/888933582265
-80
1995 1997 1999 2001 2003 2005 2007 2009 2011 2013 2015 %
GDP per capita GDP per hour worked
Export performance is improving
Four-quarter moving average, index 2010 = 100
Note: Export performance is measured as the ratio of actual export volume to the country’s export market.
Source: OECD (2017), OECD Economic Outlook: Statistics and Projections (database).
1 2 http://dx.doi.org/10.1787/888933582398
95
Share of population with disposable income below the poverty line,¹ 2015 or latest year
1. The poverty line is half of median household income. Household income is adjusted to take into account household size. 2. Unweighted average.
Source: OECD (2017), OECD Social and Welfare Statistics (database). 1 2 http://dx.doi.org/10.1787/888933582284
MAIN FINDINGS KEY RECOMMENDATIONS
Using fiscal policy to support structural reform priorities
High taxes on low wage incomes contribute to informality, high unemployment, poverty and the emigration of the young.
Reduce the labour tax wedge on low earnings. Raise more revenues from the taxation of real estate and energy. Broaden the base of business income taxation by removing tax exemptions.
The budgetary situation is strong and public debt is low. Continue to comply with the European Union’s fiscal rules and make full use of available fiscal space, including the flexibility mechanisms, to fund structural reforms. Informal activity is widespread, holding back tax revenues,
productivity and coverage of workers with social safety nets. Perceptions of weak governance and low trust in the government reduce willingness to pay tax.
Strengthen the budgetary independence of the Corruption Prevention and Combating Bureau (KNAB).
Make better use of information and communication technology for tax law enforcement.
Remove political influence in the appointment of judges.
Improving productivity and access to better economic opportunities for all
Underskilled workers and low-skill workers have high unemployment and poverty risks.
Provide more generous grants for students attending vocational schools who are from low-income families. Most university students receive no income support from
the government and there is no support targeted to students from low-income households.
Expand grants for university students and target them to students from low-income families.
Weak loan recovery in insolvency procedures holds back bank credit.
Strengthen the specialisation of judges.
Innovation activity is weak. The productivity gap vis-à-vis high income countries is large. Integration in global value-added chains and inward foreign direct investment are low.
Increase government funding of programmes with strong evaluation results.
Infrastructure investment spending is high but the quality of infrastructure still falls short of standards in high-income countries.
Apply the same cost-benefit tests to large national projects as are applied to EU-funded projects.
Improve access to health services, housing and jobs
Few households rent their homes. This reduces labour mobility and contributes to keeping unemployment high in some regions. There is little development of new housing for rent. Legal uncertainty and long legal procedures hold back the development of the private rented housing market. Housing conditions for low-income households are poor and low-cost housing falls short of demand, especially in the Riga metropolitan area.
Improve legal certainty in rental regulation and encourage out-of-court procedures.
Simplify the administrative process for obtaining a building permit.
Provide more funding for low-cost rented housing in areas of expanding employment.
Expand the mobility programme, which provides temporary support for relocation and transport.
Health outcomes are poor and access to care is limited especially among low-income households. Budget restrictions result in rationing of care at the end of each year. Efficiency in health care provision is also held back by insufficient granularity in health service data.
Reduce out-of-pocket payments especially for the low-income population.
Develop key service quality and performance indicators for health care providers at national, local and provider-level.
The metropolitan area of Riga is a key driver of growth and employment but lacks adequate governance.
Create a platform to co-ordinate policies of all municipalities where most residents commute to Riga.
High operating costs in the compulsory private pension system reduce net payouts, with no benefit to workers or the government.
Assessment and recommendations
● Income convergence may have resumed but growth needs to become more inclusive
● Fiscal policy to support pressing structural and social policy priorities
● Improving living standards requires boosting productivity and stronger integration in global value chains
● Improving access to housing and health care is key for more inclusive growth
Income convergence may have resumed but growth needs to become
more inclusive
Latvia’s economy has grown robustly in recent years (Figure 1), although it suffered in the global recession and faces a challenging environment as exports to Russia have fallen. Latvian exporters have gained market share. Rising wages have supported growth in household consumption. The fiscal position is solid, with a balanced government budget in 2016 and government debt near 40% of GDP. Private sector indebtedness has fallen to relatively low levels. Modest government and private debt and a solid financial sector underpin strong financial market confidence. The Riga metropolitan area is a key driver of economic growth, hosting the country’s nascent high-tech sectors, and contributes about 69% to national GDP.
Recent progress on structural reform priorities can lay the base for invigorating growth and well-being. Latvia stands out as the country which has taken most action on structural reform priorities identified in OECD’s Going for Growth (OECD, 2017a). The quality of education and training has improved and active labour market policies have been upgraded with EU funds. Administrative burdens to entrepreneurship have been reduced, the efficiency of the judiciary has been enhanced by consolidation of small district courts and efforts to boost tax revenue collection have born some fruit.
Despite these advances, the gap in income and productivity to high income OECD countries remains large. This gap also remains larger than in other Baltic countries or
Figure 1. Growth has resumed
1. Euro area countries which are OECD members.
2. Percentage gap with respect to the weighted average using population weights of the highest 17 OECD countries in terms of GDP per capita and GDP per hour worked (in constant 2010 PPPs).
Source:OECD (2017),OECD Economic Outlook: Statistics and Projections(database), OECD (2017),OECD National Accounts Statistics(database) andOECD Productivity Statistics(database).
1 2 http://dx.doi.org/10.1787/888933582303
-80
GDP per hour worked
B. Gap in GDP per capita and GDP per hour worked
vis-à-visthe upper half of OECD countries²
75
Index 2007 = 100
Central European countries. Productivity growth has slowed since the crisis, in Latvia as elsewhere (OECD 2016g). Diversification of export products and destinations have improved, still participation in global value chains remains concentrated on low-value-added activities. Unemployment has fallen but remains above 8%, and the incidence of long-run unemployment is still high, despite the short duration of unemployment benefit entitlements, which contributes to high poverty. Informal economic activity is still widespread, weighing on productivity, poverty and on tax revenues. Large emigration, mostly of young Latvians, contributes to skill shortages. As data from the Latvian Statistical Office show, a third of Latvian emigrants were between 20 and 30 years old in 2015. Geographic disparities in growth, employment and wellbeing are large.
Latvians are less satisfied with their lives than the OECD average (Figure 2, Panel A) and in most of the dimensions of the OECD’s Better Life Index, Latvia scores below the OECD average. An exception is educational attainment, as almost all Latvians are educated at least to upper secondary level. However, vocational education has not been sufficiently attractive and has therefore undergone substantial reforms recently. The areas of relative weakness highlighted by the Better Life Index point to little access to well-paid jobs, and problems in the health care system and the housing market. Poverty is among the highest in the OECD (Panel B). The availability of affordable quality housing is low, for instance, the share of households’ housing spending in total expenditure (26%) is high, and higher than in other countries with similar income level, such as Estonia. Fifteen per cent of dwellings lack basic facilities. Life expectancy at birth in Latvia is 74 years, six years below the OECD average. The gap in health status between rich and poor households is large (Panel C). Income inequality is also high (Figure 3).
A high incidence of poverty and unequal access to quality housing, jobs, education, health and transport services pose risks for social cohesion. Indeed trust in public institutions is generally low, which also damps willingness to pay tax. Weaknesses in effective law enforcement are also likely to have contributed. The government has introduced a broad range of reform initiatives to strengthen the judicial system. Social conflict in the form of strike has remained rare and the government has made efforts to consult social partners with important reform projects such as recent education reforms and the recent tax reform (see below).
Against this background, the main policy messages from the Survey are:
● Latvia has recovered strongly from the global crisis. Greater integration in higher value
added activities within global value-chains is key to build on this success and to continue improving living standards.
● Policies which encourage capital and labour to move to firms with high growth potential,
for example, through better allocation of credit and mobility of workers, would support this process.
● Inclusive growth would benefit from improving access to jobs, better upskilling opportunities,
improved healthcare and better transport, especially in rural areas.
Economic growth has been consumption-based while exports are still largely
low value-added
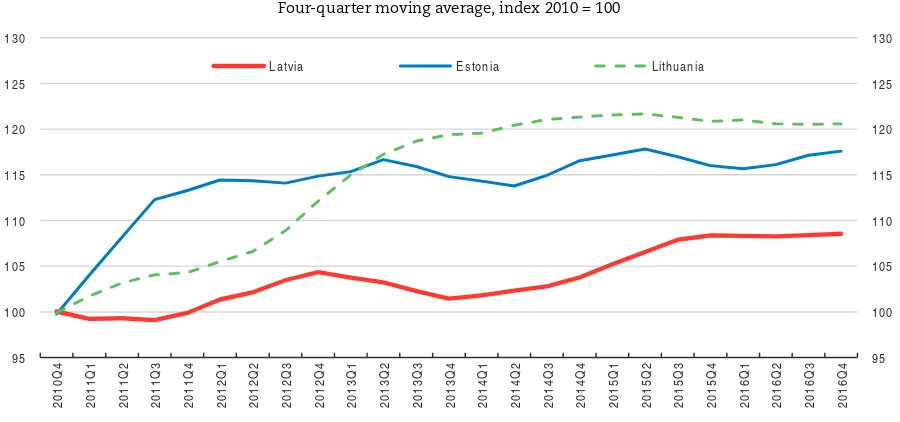
residential investment, but has recovered recently. Residential investment also fell because restrictions on residence permits for non-EU citizens were introduced in 2014. Exports to Russia were subdued reflecting the economic crisis there. As in other Baltic economies, exporters gained market shares (Figure 6). The unemployment rate has fallen but remains high (Figure 5, Panel B). Consumer price inflation remains low.
Latvian exports have diversified, contributing to gains in market shares. Latvia has increased exports to new markets to compensate for the drop in exports due to Russia’s economic downturn and its ban on EU food product imports. The share of exports going to Russia remains the third largest after Lithuania and Estonia (Figure 7). Machinery as well as information and communication technology (ICT) and travel service exports have gained
Figure 2. Housing, health and income are weak and poverty is high
1. Each well-being dimension is measured by one to four indicators from the OECD Better Life Index database. Normalised indicators are averaged with equal weights. Indicators are normalised to range between 1 (best) and 0 according to the following formula: (indicator value – minimum value)/(maximum value – minimum value). “Civic engagement and governance” includes two indicators: stakeholder engagement for developing regulations and voter turnout. The former indicator for Latvia is a population-weighted OECD average due to lack of data.
2. The poverty line is half of median household income. Household income is adjusted to take into account household size. 3. Unweighted average.
Source:OECD (2017),OECD Better Life Index – Edition 2016andOECD Social and Welfare Statistics(database).
1 2 http://dx.doi.org/10.1787/888933582322
0.0
Share of population with disposable income below the poverty line², 2015 or latest year
0
C. Share of population reporting good health, difference between rich and poor
15 years old and over, 2015 Civic engagement
ground (Figure 8). Nonetheless, Latvia’s goods exports still largely consists of raw materials and natural-resource-intensive products. Demand of these tends to grow little with rising incomes. In the medium-term the transit of exports from Russia is expected to continue declining but still contributes substantially to service export revenues.
Reflecting strong wage growth, Latvia’s relative unit labour costs have increased since 2010, more so than in the other Baltic countries (Figure 9), which have gained more export market share. However, wage growth may have been overstated as underreporting of wages to tax authorities diminished. Also, Latvian export market shares have improved markedly since 2014. The depreciation of the Euro and the appreciation of the Ruble reversed the trend in late 2016 but may only have a temporary impact. Since Latvia’s exports are concentrated on industries and activities with relatively small room for quality
Figure 3. Income inequality is high
Gini coefficient and gap of household disposable income between rich and poor, 2015 or latest year
1. It ranges from 0 (when everybody has identical incomes) to 1 (when all income goes to only one person). 2. The ratio of 10% of people with highest income to 10% of people with lowest income.
3. Unweighted average of the data shown.
Source:OECD (2017),OECD Social and Welfare Statistics(database).
1 2 http://dx.doi.org/10.1787/888933582341
0.0
upgrading and product differentiation, further loss of cost competitiveness can undermine Latvia’s export performance.
Wage growth is largely driven by skills shortages, in part on account of emigration, which remains high (Figure 10). Moreover, unemployment in the dynamic capital region is already very low, while mobility and skill barriers prevent the unemployed from other regions to take up jobs there. The minimum wage has risen.
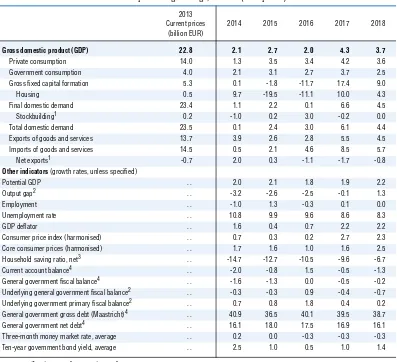
GDP growth is projected to strengthen in 2017 (Table 1). Disbursement of EU funds picks up, boosting investment strongly. Household consumption is projected to remain robust on the back of sustained real wage growth. Exports will strengthen thanks to the gradual recovery in the main trading partners. The current account balance will diminish as strong consumption and investment increase imports, and is projected to move into a small deficit. Unemployment is projected to fall only slowly due to high structural unemployment. Inflation will remain low, although the impact of low energy prices fades.
Table 1. Macroeconomic indicators and projections
Annual percentage change, volume (2010 prices)
2013 Current prices
(billion EUR)
2014 2015 2016 2017 2018
Gross domestic product (GDP) 22.8 2.1 2.7 2.0 4.3 3.7
Private consumption 14.0 1.3 3.5 3.4 4.2 3.6
Government consumption 4.0 2.1 3.1 2.7 3.7 2.5
Gross fixed capital formation 5.3 0.1 -1.8 -11.7 17.4 9.0
Housing 0.5 9.7 -19.5 -11.1 10.0 4.3
Final domestic demand 23.4 1.1 2.2 0.1 6.6 4.5
Stockbuilding1 0.2 -1.0 0.2 3.0 -0.2 0.0
Total domestic demand 23.5 0.1 2.4 3.0 6.1 4.4
Exports of goods and services 13.7 3.9 2.6 2.8 5.5 4.5
Imports of goods and services 14.5 0.5 2.1 4.6 8.5 5.7
Net exports1 -0.7 2.0 0.3 -1.1 -1.7 -0.8
Other indicators(growth rates, unless specified)
Potential GDP . . 2.0 2.1 1.8 1.9 2.2
Output gap2 . . -3.2 -2.6 -2.5 -0.1 1.3
Employment . . -1.0 1.3 -0.3 0.1 0.0
Unemployment rate . . 10.8 9.9 9.6 8.6 8.3
GDP deflator . . 1.6 0.4 0.7 2.2 2.2
Consumer price index (harmonised) . . 0.7 0.3 0.2 2.7 2.3
Core consumer prices (harmonised) . . 1.7 1.6 1.0 1.6 2.5
Household saving ratio, net3 . . -14.7 -12.7 -10.5 -9.6 -6.7
Current account balance4 . . -2.0 -0.8 1.5 -0.5 -1.3
General government fiscal balance4 . . -1.6 -1.3 0.0 -0.5 -0.2
Underlying general government fiscal balance2 . . -0.3 -0.3 0.9 -0.4 -0.7
Underlying government primary fiscal balance2 . . 0.7 0.8 1.8 0.4 0.2
General government gross debt (Maastricht)4 . . 40.9 36.5 40.1 39.5 38.7
General government net debt4 . . 16.1 18.0 17.5 16.9 16.1
Three-month money market rate, average . . 0.2 0.0 -0.3 -0.3 -0.3
Ten-year government bond yield, average . . 2.5 1.0 0.5 1.0 1.4
1. Contribution to changes in real GDP. 2. As a percentage of potential GDP.
3. As a percentage of household disposable income. 4. As a percentage of GDP.
As a small open economy, Latvia is exposed to developments in its main trading partners, the European Union and Russia. While exports to the United Kingdom grew in 2016, the decision of the UK to leave the European Union may affect export prospects in the medium term, as the UK is an important trading partner. It may also lower Latvian emigrants’ remittances, which amount to 0.8% of GDP. A further risk to the outlook is that financial market turbulence could reemerge in the euro area, which may also increase macroeconomic risks for Latvia. Such turbulence could tighten lending conditions throughout the euro area and reduce demand in Latvian export markets. Increased
Figure 4. Wages are growing, inflation remains slow
Year-on-year percentage change
1. Worker pay rate refers to average nominal labour compensation per employee. 2. Harmonised consumer price index (HICP).
Source:OECD (2017),OECD Economic Outlook: Statistics and Projections(database).
1 2 http://dx.doi.org/10.1787/888933582360
Figure 5. Real investment has recovered recently and unemployment has fallen but remains high
1. Euro area countries which are OECD members.
Source:OECD (2017),OECD Economic Outlook: Statistics and Projections(database).
1 2 http://dx.doi.org/10.1787/888933582379
-4
A. Real investment and private consumption
Index 2007 = 100
Investment Private consumption
B. Unemployment rate
% of labour force
Latvia Estonia
economic uncertainty may raise precautionary household saving, damping consumption, as limited social protection provides little insurance against income risks. Indeed, the Latvian economy has a track record of volatility in response to shocks, as documented in
the 2015Economic Survey of Latvia(OECD, 2015a). On the other hand, if Latvia implements
structural reforms that boost inclusive growth at a faster pace, exports would grow more strongly and resilience could improve. Stronger economic recovery in Russia could also boost exports beyond the projected level. Steps to deepen European integration, including steps to complete the banking union within the European Monetary Union, could boost confidence. The decision of the United Kingdom to leave the European Union could boost
Figure 6. Export performance is improving
Four-quarter moving average, index 2010 = 100
Note:Export performance is measured as the ratio of actual export volume to the country’s export market. Source:OECD (2017),OECD Economic Outlook: Statistics and Projections(database).
1 2 http://dx.doi.org/10.1787/888933582398
Figure 7. The shares of most of the largest export destinations have declined
% of total merchandise exports
Source:Central Statistical Bureau of Latvia.
1 2 http://dx.doi.org/10.1787/888933582417
95
GBR SWE DEU RUS EST LTU
% A. 2010
GBR SWE DEU RUS EST LTU
return migration to Latvia. Possible low-probability shocks which would completely alter the economic outlook if they materialise include the intensification of geopolitical risks related to Russia (Table 2).
High structural unemployment raises the risk of poverty
Big local differences in unemployment and vacancies contribute to high structural unemployment and poverty. Unemployment and poverty are much higher in the East of Figure 8. Exports are still concentrated in resource-intensive goods and transport services
1. Includes mechanical appliances; electrical equipment; transport vehicles; optical instruments and apparatus (inc. medical); clocks and watches; musical instruments.
2. Includes products of the chemical and allied industries; plastics and articles thereof; rubber and articles thereof; base metals and articles of base metals; and mineral products.
Source:OECD (2017),OECD Statistics on International Trade in Services(database) and Central Statistical Bureau of Latvia.
1 2 http://dx.doi.org/10.1787/888933582436
Figure 9. Relative unit labour costs have risen
OECD competitiveness indicator¹, four-quarter moving average, index 2010 =100
1. The competitiveness indicator is the ratio of own unit labour costs relative to those of trading partners. An increase corresponds to lower competitiveness.
Source:OECD (2017),OECD Economic Outlook: Statistics and Projections(database).
1 2 http://dx.doi.org/10.1787/888933582455
0
B. Composition of service exports
Other services % of total service exports
2010 2016
A. Composition of good exports
Other goods % of total merchandise exports
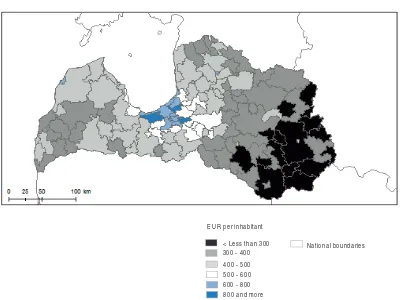
Latvia, particularly in the Latgale region, than in the Riga area (Pierriga and Riga, Figure 11). Seventy-two per cent of vacancies notified to the public employment service are in Riga. Forty-five per cent of the unemployed were unemployed for a year or longer in 2015, mostly in the Eastern rural areas. Unemployment benefits are reduced by a half after six months and expire after nine months. The large number of workers whose salaries are only partly declared to the tax authorities also reduces unemployment benefit entitlements in case of job loss. Income inequality is reflected in large local differences in personal income tax revenues (Figure 12).
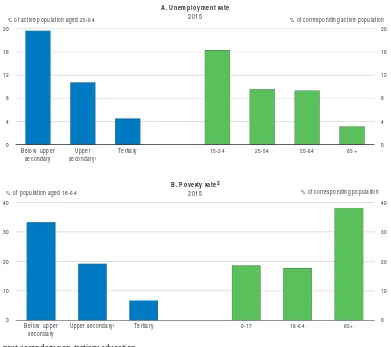
The unemployment rate is almost five times higher for workers with low education attainment than for those with high attainment (Figure 13, Panel A). Older workers who were educated in the Soviet era have faced rapid depreciation of their skills and struggle to keep up with new labour market demands. The unemployment rate of workers aged between 55 and 64 is close to 10%, among the highest in OECD countries. Apart from the long-term unemployed, workers with low educational attainment and Latvians aged 65 and over, mostly pensioners, face the highest risk of poverty (Panel B). The hourly earnings gap between men and women, which amounts to 17% of male hourly earnings, also contributes to inequality.
Credit growth is subdued despite very supportive monetary policy
As elsewhere in the euro area, expansionary monetary policy has resulted in extremely low interest rates. Financial sector confidence is strong, as spreads vis-à-vis interest rates on German government debt have remained close to zero. Private sector indebtedness has fallen below levels in many OECD countries (Figure 14). Non-financial
Figure 10. Emigration remains high
Source:Eurostat and Central Statistical Bureau of Latvia.
1 2 http://dx.doi.org/10.1787/888933582474
Table 2. Low-probability shocks which could affect the Latvian economy
Vulnerability Possible outcome
Intensification of geopolitical risks related to Russia. Geopolitical tension in Russia could jeopardise exports and investment. An immediate halt of the transit of Russian exports through Latvia would lower Latvian GDP by 3-4% according to estimates by the Bank of Latvia.
0.0
2001 2003 2005 2007 2009 2011 2013 2015
A. Emigration and immigration
Figure 11. Poverty is high in regions with high unemployment rates
1. Share of population with disposable income below 60% of median household income. Source:Central Statistical Bureau of Latvia.
1 2 http://dx.doi.org/10.1787/888933582493
Figure 12. Income tax revenues per inhabitant vary strongly
2015
Source:OECD calculations based on RDIM (2017), Regional development indicators (www.raim.gov.lv). 0 % of labour force
0
B. At-risk-of-poverty rate¹ Total population, 2015 %
< Less than 300
Figure 13. Low-skilled and older workers face the highest risks of unemployment and poverty
Unemployment and poverty rate by educational attainment and by age group
1. Includes post-secondary non-tertiary education.
2. Share of population with disposable income below 60% of median household income.
Source:OECD (2017),OECD Education Statistics(database),OECD Labour Force Statistics(database) and Central Statistical Bureau of Latvia. 1 2 http://dx.doi.org/10.1787/888933582512
Figure 14. Private debt is falling
Debt as % of GDP
1. Includes non-profit institutions serving households.
Source:OECD (2017),OECD Economic Outlook: Statistics and Projections(database) andOECD National Accounts Statistics(database).
1 2 http://dx.doi.org/10.1787/888933582531 0
Tertiary 15-24 25-54 55-64 65+
A. Unemployment rate
2015
% of active population aged 25-64
0
Upper secondary¹ Tertiary 0-17 18-64 65+
B. Poverty rate²
2015
% of population aged 18-64 % of corresponding population % of corresponding active population
0
2010 2011 2012 2013 2014 2015 %
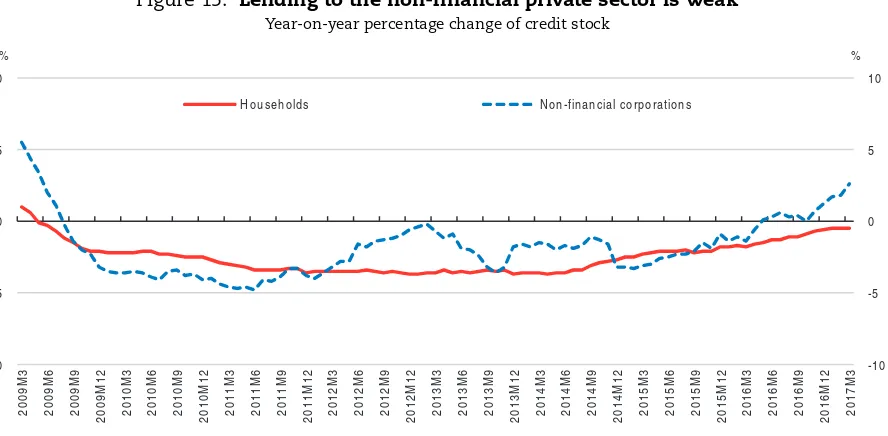
businesses deleveraged sharply in the aftermath of the crisis, as banks wrote off loans to non-viable firms and demand for loans was low. Nonetheless, lending to non-financial corporations has recovered only slowly while the decline of credit to households has levelled off (Figure 15). Bank lending surveys suggest that loan demand has increased, but banks have not eased their lending standards (Bank of Latvia, 2016a). Banks report that low equity, weak credit records of firms, a weak judiciary and informal economic activity prevent them from easing lending standards.
Although firms depend mainly on bank lending, alternative financing platforms are growing. Internet-based loan issuance has increased strongly, and is among the most developed in Europe, although the share in overall lending is still very small (KPMG, 2016). Including internet lending in prudential regulation, as planned, could strengthen financial intermediation and contain risks. Another welcome step is the creation of the Baltic Market through the merger of the stock exchanges of the three Baltic countries, which may help improve the capacity for Latvian firms to raise equity.
Latvia’s banking sector is overall healthy and supervision is sound. Capital and liquidity ratios are comfortably above required levels (Table 3). The ratio of non-performing loans has fallen below the EU average and coverage of loan loss risk with provisioning is high. Profitability is strong. The three largest banks, of which two are owned by Scandinavian banks, are directly supervised by the ECB. Latvia benefits from the Single Resolution Mechanism (SRM), which provides an EU-wide framework for orderly resolution of large banks. The smaller Latvian banks are supervised by Latvia’s Financial and Capital Market Commission (FCMC). Macro-prudential policies are implemented by the FCMC, which consults with the Bank of Latvia, and the Ministry of Finance. They form the Macroprudential Council, an advisory body. It can issue non-binding recommendations on the principle of “comply or explain”.
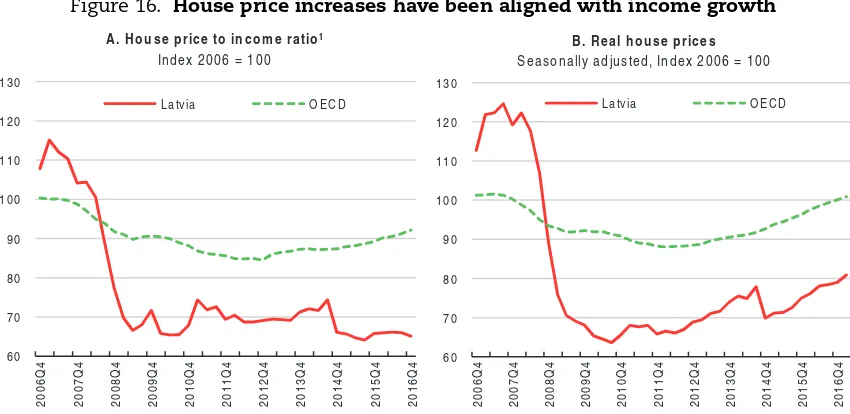
House prices in Latvia have been rising in recent years, but broadly in line with incomes (Figure 16). Housing demand has been bolstered by lower down-payments.
Figure 15. Lending to the non-financial private sector is weak
Year-on-year percentage change of credit stock
Note:Lending data are corrected to exclude one-off effects due to the withdrawal of credit institution's licences. Source:Bank of Latvia.
1 2 http://dx.doi.org/10.1787/888933582550
Lending to households is nonetheless moderate, suggesting low financial sector risks on this front. Low incomes of many Latvian households and tighter lending standards since the crisis have barred low-income households from purchasing new housing, while the private rented housing market is underdeveloped. Therefore, despite lower house prices, for low-and middle-income households quality housing is still difficult to afford (see below). A government programme providing loan guarantees for housing mortgages for families with children helps to some extent, but by increasing housing demand may also result in higher prices.
Table 3. The Latvian banking sector is robust
Selected prudential and performance indicators. Per cent, 2016 (latest available quarter)
Latvia EU average Minimum requirements
Total capital adequacy ratio 21 18 11
Common equity Tier 1 ratio 18 14 8
Leverage ratiob 9 31
Liquidity ratioc 61 30
NPL ratiod 4 5
NPL coverage ratioe 89 44
Loan to deposit ratio 71 122
Return on equityf 14 6
1. Proposed.
a) Sample average, end-June 2016, of major banks covering about 85% of the EU banking sector; see EBA (2016c). b) Tier 1 capital/Total risk unweighted assets (%).
c) Liquid assets/current liabilities (with maturity up to 30 days), where Liquid assets = vault cash + claims on central banks and other credit institutions + debt securities of central governments and other liquid debt securities; and current liabilities – claim liabilities and liabilities with residual maturity not exceeding 30 days.
d) Past due (> 90 days) loans to total loans.
e) Non performing loans coverage ratio (provisions for principal amount of loans/past due > 90 days loans). f) Annualised profit/loss for the reporting period to average equity (branches of foreign banks not included in the
calculation).
Source:Financial and Capital Market Commission, Latvia; European Banking Authority.
Figure 16. House price increases have been aligned with income growth
1. The nominal house price is divided by the nominal disposable income per head. Source:OECD (2017),OECD Analytical House Price Statistics(database).
1 2 http://dx.doi.org/10.1787/888933582569
60
A. House price to income ratio¹
Index 2006 = 100
Latvia OECD
B. Real house prices
Seasonally adjusted, Index 2006 = 100
Foreign deposits at Latvian banks, mostly related to business links with Russia, amount to around 43% of total deposits end-2016. They have decreased since 2015 following the introduction of stricter anti-money laundering and counter-terrorism financing rules (Figure 17). These rules will be tightened further in 2017. Increasing uncertainty over geopolitical risks and weakening of CIS economies could trigger further withdrawals of foreign deposits. They could also weaken banks’ profitability, as banks offering foreign deposits have claims in CIS countries, and eventually some of them might need to downscale their business. However, these banks are subject to more demanding capital and liquidity requirements, and stress tests by the Bank of Latvia suggest that they can withstand large withdrawals.
Fiscal policy to support pressing structural and social policy priorities
Latvia has a rigorous budgetary framework, underpinned by an independent fiscal council and transparent national fiscal rules defined in the Fiscal Discipline Law. The fiscal council performs regular monitoring of compliance with the requirements of the Fiscal Discipline Law and prepares an annual report which is submitted to the parliament together with the Medium-Term Budgetary Framework Draft Law. This institutional set-up should be an effective means of keeping public expenditure growth consistent with fiscal sustainability (Economic Survey of Latvia 2015, OECD, 2015a).
Latvia’s budget planning is subject to structural budget balance rules to comply with the European Union’s Stability and Growth Pact (SGP). The medium-term objective for the structural deficit consistent with the SGP is 1% of GDP. The government is making full use of allowed deviations on account of recent pension and healthcare reform, based on the SGP’s flexibility mechanism, until 2019. In addition, national rules limit the structural deficit to 0.5% of GDP. These are currently not binding because the national authorities have currently estimated a lower structural deficit. Rigorous commitment to fiscal rules has kept Latvia’s public debt near 40% of GDP, considerably lower than the limits set by the Fiscal Discipline Law (60%). Substantial reforms are ongoing to improve public sector efficiency (Table 4).
Figure 17. The share of foreign deposits is large
Source:Financial and Capital Market Commission.
1 2 http://dx.doi.org/10.1787/888933582588
30
The long-term outlook is robust, as expected increases of ageing-related spending are modest, reflecting past reforms which reduced the generosity of government-paid pensions. However, poverty among pensioners is high and may rise as pension benefit replacement rates are projected to fall.
The fiscal stance is expected to be moderately expansionary in the near term. The 2017 budget foresees additional spending of 0.3% of GDP to improve access to health care. The government has also improved access to social assistance for families with children and has raised benefits for the third and subsequent children. Government investment is also expected to expand with the disbursement of new EU funds. These are welcome measures.
There is a case for making full use of available fiscal space under SGP rules, including the flexibility mechanisms to fund structural reforms, also beyond 2019. This could support policies which boost economic growth in an inclusive way. Assuming low nominal GDP growth of 3.5% per year, a deficit of 1.5% of GDP would keep the debt-to-GDP ratio broadly unchanged until 2030. Assuming higher nominal GDP growth of 4.5% per year, a Table 4. Implementation of recommendations to improve public sector efficiency
Earlier OECD recommendations Actions taken
Carry out co-ordinated and regular assessment of productivity challenges as an input for regulatory reform.
The government is envisaging setting up the National Productivity Board in 2018 to improve co-ordinated and regular assessment of productivity challenges. The European Commission, the OECD, as well as representatives from Latvian public administration, parliament, academia and social partners have been consulted to set up the board in the most effective manner.
Restore the funding of the State Audit Office to at least pre-crisis levels. The grant to the State Audit Office has been increased in the 2017 Budget to EUR 5.9 million, still 11% lower than the 2008 level.
Reinforce regulatory impact assessments by reducing fast-tracking for the assessment of new regulation and establishing methods to select proposed regulations that require in-depth assessments.
Amendments to improve theex anteregulatory impact assessment framework were developed in 2016. Approval by the Cabinet of Ministers is expected in 2017. A conceptual report proposing an
ex postevaluation framework was approved in 2016. Two pilot projects are launched in 2017 to develop the evaluation methodology. Introduce regular reporting on long-term spending trends and the
adequacy of social programmes, such as pensions and healthcare.
Long -term social insurance budget projections are produced regularly and are used for political decision making, analysis and monitoring, ensuring the long term stability. The Ministry of Health has made estimates of health care funding for 2017-2023. The European Commission’s Ageing Report to be published in 2018 will include such projections.
Ensure that local governments are sufficiently resourced and autonomous by increasing their tax revenues, reducing the share of earmarked revenues, and improving the equalisation system.
A new financial equalisation law strengthening the autonomy of local governments was introduced in 2016.
Modernise human resource management by further developing results-oriented pay.
Legislation in 2016 aims at reducing pay gaps between the public and the private sector. A pilot project to develop a new remuneration system will be evaluated by September 2017. Additional pay for key experts was introduced. Law amendments will be developed in 2017 in order to introduce additional measures to link remuneration with performance indicators and to reduce the pay gap. A comprehensive public administration senior manager development program was introduced in 2016. In 2017 the topic of the senior managers’ development program is performance management.
Strengthen the transparency of public procurement by ensuring the independence of institutions in charge of combating corruption and by providing practical guidance on conflicts of interest.
sustained government deficit of 1.5% would allow government debt to fall below 40% (Figure 18). The current low-interest environment offers a near-term window of opportunity to invest in economic and social infrastructure which boosts inclusive growth without raising the debt-to-GDP ratio (OECD, 2016h). Current macroeconomic conditions are consistent with higher government spending, as inflation and lending growth remain
low. Moreover, a chapter on public sector efficiency in the 2015Economic Survey of Latvia
(OECD, 2015a) has not identified scope for substantial spending cuts, as government expenditure in Latvia is low. While social spending is not targeted to the poorest, it is low and largely consists of pension and unemployment benefits, which are universal entitlements.
The government plans to raise currently very-low level of means-tested social assistance benefits by 90%, to 20% of median income (94 euros per month for the first adult). On current plans municipalities would remain responsible for paying social assistance. The central government will support low income pensioners by increasing the minimum old-age pension commensurately. It will also raise pensions for pensioners with long insurance periods. Social assistance transfer spending is higher in poor municipalities while their tax revenues are lower. Therefore, higher social assistance payments may limit their capacity to fund other key social services for which they are responsible, such as childcare. Further progress in reducing informality is important to strengthen the effectiveness of the means-test, so as to ensure means-tested social assistance benefits are well-targeted to the poor.
A wide range of structural reform priorities is essential for boosting inclusive growth and these require more government funding. In particular out-of-pocket payments for health-care services should be reduced especially for the low-income population. Access to vocational education and training and to higher education as well as the funding of active labour market policies need to improve. Investment is also needed in road infrastructure.
Figure 18. Public debt can be kept low even with a higher deficit
General government debt as % of GDP, Maastricht definition
Note:GDP growth and government debt are assumed to follow the projections of Table 1 until 2018. Thereafter, nominal GDP is assumed to grow at 4.5% or 3.5%.
Source:Calculations based on OECD (2017),OECD Economic Outlook: Statistics and Projections(database).
1 2 http://dx.doi.org/10.1787/888933582607
0
Scenario 1 (High growth rate; 1.5% deficit) Scenario 2 (Low growth rate; 1.5% deficit)
Policies are needed to make more low-cost rented housing available in areas which provide good access to jobs. This is discussed in more detail below.
Tax reform could make growth more inclusive and raise more revenues
Parliament has approved a reform of personal and corporate income tax in the framework of a broad tax reform. It reduces the basic personal income tax rate from 23% to 20% for incomes up to 20 000 euros per year starting in 2018. It also raises the corporate tax rate from 15 to 20%. However, non-distributed corporate tax income will be fully tax-exempt, effectively turning the tax into a tax on distributed profits, as in neighbouring Estonia. Lower personal income taxes reduce the taxation of labour, which is welcome. However, in view of high poverty, targeting these tax reductions to low-wage workers may be preferable.
The corporate tax reform could encourage investment by boosting retained earnings, which is the main source of finance for business investment. However the current corporate tax rate is already low and accelerated depreciation allowances are generous. The reform could also reduce administrative costs to some extent (Staehr, 2014). In Estonia firms have responded to the tax system largely by accumulating cash rather than investing in fixed assets (Hazak 2009). There may perhaps have been some positive investment and productivity effects on individual firms (Masso et al., 2013), but no benefits to macroeconomic performance can be shown (Staehr, 2014).
The government estimates the tax reform package to have a cost of 0.6% of GDP in the budget when it is fully implemented by 2020, which would make it harder to address key spending priorities to improve access to health care and education. However revenue risks from the corporate income tax reform could be substantially bigger.
Steps to eliminate exemptions from business taxation could strengthen revenues and avoid unwanted disincentives for firms to grow. The micro enterprise tax system exempts small eligible firms from income tax and social security contributions. They pay a low turnover tax instead. The scheme encourages firms to remain small or to keep part of their activity in the informal sector to benefit from low taxation and harms inclusiveness. Young start-up firms financed with venture capital pay a low lump sum tax per worker, which is regressive. The employees in these start-up firms are not covered by unemployment or pension insurance. These tax breaks should be abolished. Any tax support for start-ups should be limited in time, to reduce disincentives to grow, and ensure full coverage with social security. There are also generous tax credits and exemptions for special economic zones, mostly in the port areas. However, these are subject to competition from similar arrangements in other countries of the region.
The government has taken steps to lower labour taxes on low-income earners and
raised excise and environmental taxes, as recommended in the 2014Economic Survey of
progressivity in the personal income tax system, which is welcome in view of high income inequality. But workers have to claim the basic allowance, and low-income workers may fail to do so. Besides, personal income tax reductions are less effective in reducing taxation of workers on the lowest salaries, as they typically pay no or little income tax. By contrast, social security contributions must be paid from the first euro. Therefore, reducing social security contributions for low wage workers would be particularly effective in promoting formal employment of these workers, and would increase the inclusiveness of the tax system. In Colombia, reducing payroll contributions also resulted in a substantial increase of formal jobs in the short-run (Bernal, Eslava and Meléndez, 2015; Medina and Morales, 2016). In Latvia’s notional defined contribution public pension system, pension payments are linked to contributions. Lower social security contributions should however not result in lower pension benefit entitlements, as pension income replacement rates are low. An
Table 5. Implementation of recommendations on the tax system
Earlier OECD recommendations Actions taken
Decrease labour tax for low-income earners. From 2016 a differential non-taxable minimum income allowance has been introduced with a higher tax-exempt level for low income (EUR 160 per month for lowest wages) The monthly allowance for dependents amount has been raised from EUR 165 to EUR 175.
Raise additional revenues by increasing property and environmentally related taxes. Increase energy tax rates, making them depend on their relative carbon content. Phase out environmentally harmful fuel subsidies.
In 2015 and 2016 the excise tax rates for alcohol, tobacco and several oil products were raised and the tax base was broadened. Excise tax rates will be raised gradually until 2018. Car and motorcycle taxes have been abolished in 2017 and replaced by the vehicle exploitation tax where rates are based on CO2emissions. The tax exemption for
electricity expenditure has been abolished. Tax rates for extraction of natural resources in several categories of minerals and soil were increased by 25-29%. Taxes for the disposal of municipal waste have been increased for hazardous waste and production waste. Tax rates on activities emitting CO2and on goods harmful to the environment
were increased.
Figure 19. Taxes on low labour incomes are high
% of total labour compensation, single person at 67% of average earnings without children, 2016
Note:Labour taxes include personal income tax and employee plus employer social security contributions and any payroll tax less cash transfers.
Source:OECD (2017), OECD Tax Statistics (database).
1 2 http://dx.doi.org/10.1787/888933582626
alternative option would be the introduction of an earned income tax credit for low-income households.
The tax reform foresees setting tax rates on capital income received by households (such as interest income) at 20%, at the same rate as other household income. This is welcome as capital income received by households (such as interest income) is currently taxed at lower rates than other household income. Low taxes on such income tend to favour high-income households, making the tax system less inclusive. Yet an inclusive tax system is important in view of high income inequality. There is scope to raise taxation of energy and real estate, including through approximating cadastral valuation to current market values. However given the high home ownership, even among low-income households, this could be accompanied by the introduction of a tax-exemption up to a suitable value ceiling. There is also scope to continue raising taxes on alcohol and tobacco further.
Encouraging firms and workers to fully declare their economic activity
Informal activities remain widespread. While it is difficult to capture the exact size of the informal sector, in 2015 it was estimated to amount to more than 20% of GDP in (Figure 20). The government has made considerable effort to improve tax collection by intensifying tax audits on individuals and firms operating in sectors where informal activity is widespread; introducing criminal sanctions against employers paying undeclared wages; strengthening controls, resources and co-ordination among relevant authorities (tax authorities, labour inspectors and customs); and raising fines and increasing personal liability of company board members. These steps helped increase tax revenues, which are estimated to have reached 31% of GDP in 2016, up from 29% in 2015 (Figure 21).
To provide essential social services and lower the tax burden on low income earners the government is aiming to raise tax revenue further. It is planning to make better use of ICT for tax law enforcement which is welcome. It plans to require electronic record keeping cash registers. The government also plans to combat tax evasion in electronic commerce and to enable electronic exchange of information between credit institutions and the tax authorities.
But more fundamental measures that strengthen the incentive for tax compliance by firms and workers are needed. Perceptions of weak governance undermine the willingness to pay tax. Surveys of company owners and managers shows that acceptance of informal activity is strongly related to their dissatisfaction with business legislation (Putnins and Sauka, 2016). In comparison with Estonia and Lithuania more Latvian businesses display lower trust in the government (Putnins and Sauka, 2016). Trust in public governance is also weak in the population at large (Figure 22). Greater trust in government helps improve tax morale (Daude et al., 2012). Torgler and Schneider (2007) show that better governance and more direct political participation possibilities for the population improve willingness to pay tax. Williams and Horodnic (2015) link the informal economy to low motivation to pay taxes and conclude that policies to reduce informality should focus on improving trust in government. This can be done by developing greater procedural justice, strengthening perceptions of impartial treatment of all citizens as well as broad and fair access to public services.
fighting corruption and avoid political interference with the work of the KNAB. However, scope for further improvement remains, for example, by raising the budgetary independence. The budget of the KNAB continues to be proposed by the Council of Ministers and is approved by parliament annually, weakening independence. Full independence is important so KNAB is perceived to be able to investigate corruption within these institutions. As is the case for competition authorities, budgetary independence should be reinforced by mechanisms reducing government discretion, such as fixed
Figure 20. The size of the informal economy is large
Estimated size of the informal economy and underreported corporate profits and wages, 2016
Note:The aggregate size of the informal economy is estimated from the firm-level information. Underreported corporate profits and wage payments by registered firms in the three Baltic countries are based on survey data.
Source:Putniņš, T. and A. Sauka (2017), “Shadow Economy Index for the Baltic Countries”,Stockholm School of Economics in Riga (SSE Riga). 1 2 http://dx.doi.org/10.1787/888933582645
Figure 21. Tax revenues are low
2015
Source:OECD (2017),OECD Economic Outlook: Statistics and Projections(database) andOECD National Accounts Statistics(database).
1 2 http://dx.doi.org/10.1787/888933582664
0
EST LTU LVA EST LTU LVA EST LTU LVA
The size of shadow economy Underreported corporate profits Underreported wages
(% of GDP) (% of actual profits) (% of actual wages)
multiannual budget allocations, the allocation of fixed revenue sources, for example fees or taxes, or a combination of these (OECD, 2016i).
Many judges are appointed by parliament, which may expose them to political influence. Stronger independence from political influence in the procedures to appoint judges could also improve perceptions of governance. It is welcome that legislation to strengthen the independence of judges is being considered by parliament. There is also scope to strengthen rules on the engagement of lobbyists in the legislative process (Council of Europe, 2016). Broadening access to key social services, notably health services, may also strengthen perceived fairness and thereby willingness to work in the formal economy (see below).
High operating costs reduce the pensions workers accrue in the second pillar
pension system
Since 2001, all young workers taking up employment in Latvia are enrolled in the compulsory, second pillar (private) pension scheme, which complements the first pillar (public) pension scheme. Six per cent of workers’ salaries flow into a privately managed plan chosen by each worker. But high operating costs imposed by private investment managers, particularly costs from excessive marketing activities, considerably reduce risk-adjusted returns. Operating costs of private pension funds amounted to close to 2% in 2015 (Figure 23), although they were somewhat lower (1.6 %) for funds in the compulsory second pillar system. The high costs significantly reduce the capital workers accumulate in the fund over their working lifetime. With current contributions and risk-adjusted returns today's workers will have to lower their living standards considerably when retiring.
Empirical evidence suggests that marketing activities of fund managers with the purpose of attracting contributors to their funds has no benefit for workers (Hastings et al., 2013). Such activities raise costs as well as suppliers’ market power because they attach
Figure 22. Trust in the government is low
2014
1. 2013 for Chile, Hungary and Iceland.
Note:Trust refers to the percentage of respondents who answered “yes” to the question “Do you have confidence in national government” in the World Gallup Poll, 2014.
Source:OECD (2015),Government at a Glance 2015.
1 2 http://dx.doi.org/10.1787/888933582683
workers to pension funds for reasons unrelated to performance, especially low-wage contributors. Berstein and Micco (2003) show that, in oligopolistic market structures, pension funds have incentives to engage in marketing that reduces social welfare but generates costs, to raise profit margins. Proposals currently under discussion in Latvia are to lower the cap on the general fee from currently 1% and stricter requirements for performance-related higher charges. These steps would be welcome. To reduce costs and boost net returns in second pillar pension systems, Australia and Sweden, for example, have introduced a low-cost default-choice fund (OECD, 2013a; Tapia and Yermo, 2008), in which contributors invest unless they take a deliberate decision to invest elsewhere. Costs in these funds are kept low with passive investment strategies and by avoiding marketing expenses. In Sweden, such funds have proven to offer higher returns than managed funds.
Improving living standards requires boosting productivity and stronger
integration in global value chains
Latvia enjoyed strong productivity growth until the early 2000s. However, as in many OECD countries, productivity growth has slowed significantly in the past decade (Figure 24). Reinvigorating the productivity of Latvian firms is key for Latvia to continue to improve living standards.
As a small open economy, Latvia needs to be integrated into the global economy to boost productivity. International trade and foreign direct investment (FDI) channel knowledge from advanced economies (Coe et al., 2009; Alfaro, 2016). Imports of intermediate goods boost productivity by enabling firms to diversify production and upgrade quality (Amiti and Koning, 2007). Integration in global value chains (GVCs) intensifies such knowledge transfer and use of imported inputs and enables Latvia to further diversify its exports and to tap into world demand through GVCs. Indeed, entry to export market boosts significantly the productivity, employment and wages of Latvian firms (Figure 25; Benkovskis et al., 2017). For example, starting to export boosts labour Figure 23. High operating costs depress the returns in the private pension system
% of assets under management, 2015
1. 2014 for Greece and New Zealand. 2013 for the United Kingdom. 2011 for Chile and Turkey. Source:OECD (2017),OECD Pensions Statistics(database).
1 2 http://dx.doi.org/10.1787/888933582702
productivity by more than 23% in the year of export entry. Employment and wages also increase by 21% and 8% respectively in the third year. These effects are particularly strong for firms that are likely to be participating in high value added activities within GVCs, such as exports of intermediate goods and knowledge intensive services (see Chapter 1).
Figure 24. Productivity growth has slowed
Average annual growth of labour productivity¹
1. Labour productivity growth is the change in gross value added per hour worked at constant prices. 2. Excludes real estate.
Source:OECD (2017),OECD Productivity Statistics(database).
1 2 http://dx.doi.org/10.1787/888933582721
Figure 25. Exporting raises productivity, employment and wages of Latvian firms
Differences in productivity, employment and wages between exporting and non-exporting firms after export entry
Note:The chart shows the differences in productivity, employment and wages between firms that started exporting and non-exporting firms. By comparing the export entrants with the subset of non-exporting firms that are initially as productive and large as the export entrants, these differences in performance can be interpreted as causal effect of export entry. See Box 2 of Chapter 1 for details. Source:Benkovskis et al. (2017), “Export and productivity in Global Value Chain: Evidences from Latvian and Estonian firms”,OECD Economics Department Working Paper, forthcoming.
1 2 http://dx.doi.org/10.1787/888933582740
0
1995-2005 2005-2016 1995-2005 2005-2016 1995-2005 2005-2016
Total Manufacturing Business sector services²
%
Second year Third year Year of export
entry
Second year Third year Year of export
entry
Second year Third year
labour productivity employment wages
Only few Latvian firms export (6%, or 28 % of firms with more than 10 employees, in 2014) and an even lower share of firms participate in GVCs. Participation in GVCs requires upfront investment such as developing capabilities to comply with quality standards (OECD, 2013b; Henson and Humphrey, 2010). This acts as entry barrier for small and low productive firms. Policies that remove barriers to the reallocation of resources would help firms with high growth potential to attract the capital and labour they need to expand. They thus allow more firms to participate in GVCs and boost productivity. Indeed, productivity in Latvia could be up to 25% higher if capital, labour and other inputs were reallocated to more productive firms (Benkovskis, 2015). This could set off a virtuous cycle of improving export and productivity performance, as higher productivity also boosts firms’ export performance.
The large scale of informal activities also holds back productivity, as informal firms limit their size and use backward production technologies to avoid detection (Dabla Norris et al., 2007). Informality hampers efficient resource allocation by giving informal firms a cost advantage (Perry et al., 2007). Informal activities tend to be concentrated in low-skill jobs with low wages and with no integration in global value chains such as construction. Informal sector jobs are estimated to be on average 30% less productive than formal jobs in Latvia (Putnins and Sauka, 2016).
Foreign trade and FDI are weak
Latvia’s exposure to trade is lower than its peers’ (Figure 26, Panel A). Latvia also makes little use of imported intermediate inputs (Figure 26, Panel B). FDI in Latvia is also lower than in Estonia (Panel C). Participation in GVCs lags behind other Baltic and Central European countries (Figure 27). In 2014, less than 40% of domestic value added was generated from GVC participation, less than in Estonia, Lithuania and Central European countries.
Figure 26. Latvia has room to boost productivity through trade and FDI
1. OECD estimates based on the 2011 Inter-Country Input-Output (ICIO) table and the OECD Bilateral Trade Database by Industry and End-Use (BTDIxE).
Source:OECD (2017),OECD Economic Outlook: Statistics and Projections(database),Statistics on Trade in Value Added(database) andOECD International Direct Investment Statistics(database).
1 2 http://dx.doi.org/10.1787/888933582987
0
LVA LTU EST CZE SVK
% of GDP
SVK LVA CZE EST
C. FDI inward stocks
2016
LTU LVA EST CZE SVK
%
B. The share of imported inputs embodied in exports¹
2014
A. Exports of goods and services
Almost one-third of Latvia’s employment is sustained by GVC participation (OECD, 2016b). However, the value-added per worker from GVC participation is low compared to advanced OECD economies (Figure 28). This is partly explained by knowledge intensity, as Latvia’s share of knowledge intensive services included in its exports is lower than that of Estonia or advanced OECD economies (Figure 29). In order to boost productivity and create more high-skilled jobs, Latvia needs to expand the scope of its participation in GVCs to more high value added activities such as new product development, manufacturing of technologically advanced components, as well as marketing, branding and after-sale services (OECD, 2013b). Facilitating broader access to such jobs to workers in low-income households will also make growth more socially inclusive.
Improving the supply of labour market relevant skills
The shortage of relevant skills holds back Latvian firms’ adoption of advanced technologies or management practices. The misallocation of skills, often represented by a large presence of workers over or under-skilled for their jobs, constrains productivity growth by making it difficult for productive firms to hire more skilled workers (Adalet McGowan and Andrews, 2015). Around 11% of Latvian workers report being underskilled and 20% are overskilled. The share of workers in Latvia reporting that their skills were below the level required for their job is among the highest in European OECD countries (Figure 30, Panel A). By contrast over-skilling is low in international comparison (Panel B).
Important reforms have improved the quality of vocational education and training (VET) (Table 6). The educational contents of VET have been upgraded. Education programmes which can be completed in separate modules have improved flexibility (OECD, 2015a, 2016c). Many VET students are likely to originate from low and middle-income families. In periods in which they are on workplace-placed training, they may receive a stipend from their employers. The stipend benefits from a tax-exemption (up to a ceiling).
Figure 27. Latvia’s participation in global value chains lags behind peers
The share of domestic value added embodied in foreign final demand
1. The data after 2011 are estimates based on the 2011 Inter-Country Input-Output (ICIO) table and the OECD Bilateral Trade Database by Industry and End-Use (BTDIxE).
Source:OECD calculations based on OECD/WTO (2016),Statistics on Trade in Value Added(database) and OECD (2016),OECD National Accounts Statistics(database).
1 2 http://dx.doi.org/10.1787/888933582759
10 20 30 40 50 60
10 20 30 40 50 60
2005 2006 2007 2008 2009 2010 2011 2012 2013 2014
% %
However, most students only receive 40-70 euros per month of means-tested income support, which is not sufficient as the sole income source for students (Baranovska et al., 2015). This makes it difficult for students from low income households to pursue VET. Also, students receiving support are no longer eligible for family allowances (Baranovska et al., 2015). Income support for VET students from low-income families should be scaled up to the level that allows students to focus on pursuing VET degrees and made compatible with
Figure 28. Latvia is drawing limited value-added from GVC participation
Value added embodied in foreign final demand per worker
Note:Value added embodied in foreign final demand per worker is computed by dividing the domestic value added captured from foreign final demand by the number of employment sustained by foreign final demand. Data are of 2011.
Source:OECD calculations based on OECD/WTO (2016),Statistics on Trade in Value Added(database) and OECD (2016),OECD National Accounts Statistics(database).
1 2 http://dx.doi.org/10.1787/888933583101
Figure 29. The knowledge intensity of exports is lower than in many advanced OECD economies
The share of value added from knowledge intensive services embodied in exports,¹ 2014
1. OECD estimates based on the 2011 Inter-Country Input-Output (ICIO) table and the OECD Bilateral Trade Database by Industry and End-Use (BTDIxE).
Source:OECD/WTO (2016),Statistics on Trade in Value Added(database)
1 2 http://dx.doi.org/10.1787/888933582778
0
LTU SVK CZE POL LVA HUN EST FIN DEU SWE
Figure 30. Under-skilling is frequent while over-skilling is rare in international comparison
2014
Source:CEDEFOP (2016), “Skills Panorama” (http://skillspanorama.cedefop.europa.eu).
1 2 http://dx.doi.org/10.1787/888933582797
Table 6. Implementation of recommendations on vocational education and training
Earlier OECD recommendations Actions taken
Proceed with the reform of vocational education and training, including the planned extension of work-based learning.
The network of vocational education and training (VET) schools was consolidated in 2015 and 18 schools were upgraded to VET Competence Centres (VECC). The regulation of Sectoral Expert Councils was adopted in 2016 to increase involvement of entrepreneurs in VET, particularly in workplace based learning. A project funded by the EU to expand the provision of workplace-based learning was launched in December 2016. Since 2017, VET students’ pay in workplace-based learning is exempt from personal income tax up to EUR 280. The second phase of curricula reform supported by EU structural funds started in December 2016. Starting from the 2017/2018 academic year, VECC and other VET schools will begin implementing the modular VET programmes developed in the first phase of the curricula reform.
0
A. The share of employees reporting lower skill level than required for their current jobs
the family allowance, which amounts to between 11 and 50 euros per month. The government envisages additional support for students at risk of early school leaving, funded by EU structural funds, which is welcome.
Substantial progress has been made to increase the effectiveness of active labour market policies (ALMPs) such as by profiling job seekers to determine programs according to their characteristics and by evaluation. Training programmes are designed by a committee involving social partners to respond to skill demands in the labour market. But participation in active labour market programmes (ALMPs) is low by international standards. Latvia spends only 0.2% of GDP on employment services and related ALMPs (Figure 31). Plans to improve access of the unemployed to the reformed modularised vocational education system are welcome.
Recent reforms of universities have strengthened internal and external quality assurance and have linked funding to the result of quality assessments (OECD, 2016c). The quality assessments will incorporate indicators of labour market performance of graduates. However, few students receive income support through grants. They are mainly based on merit. Household income only plays a role when merit is the same. Some universities also offer their own grants for students from low-income families. This hampers access of students from disadvantaged socio-economic backgrounds despite the availability of free study places (OECD, 2016c; World Bank, 2014). The purely merit-based system should be modified to include means-tested income support to improve access to higher education for students from disadvantaged socio-economic backgrounds who are able enough to get a free study place.
Immigration of skilled individuals from abroad can ease skill shortages, help attract foreign direct investment and facilitate knowledge transfer. Latvia’s immigration policy lacks strategic focus on foreign skilled workers (OECD, 2016a). Foreign workers from outside the EU
Figure 31. Expenditure on active labour market policies is low
Public expenditure as % of GDP, 2015¹
1. 2014 for Estonia and New Zealand. 2011 for the United Kingdom. 2. Unweighted average of the data shown.
Source:OECD (2017),OECD Employment and Labour Market Statistics(database).
1 2 http://dx.doi.org/10.1787/888933582816