www.elsevier.com/locate/jinsphys
Metabolic response of Platynota stultana pupae to controlled
atmospheres and its relation to insect mortality response
Shijun Zhou
a, Richard S. Criddle
b, Elizabeth J. Mitcham
a,*aDepartment of Pomology, University of California, One Shields Ave., Davis, CA 95616-8683, USA
bDepartment of Molecular and Cellular Biology, University of California, Davis, CA 95616, USA
Received 26 October 1999; accepted 29 February 2000
Abstract
The metabolic responses of Platynota stultana pupae to reduced O2, elevated CO2, and their combinations were investigated
using microcalorimetry, and mortality of pupae under elevated CO2 atmospheres was correlated with metabolic responses. The
metabolic heat rate decreased slightly with decreasing O2concentration until a critical O2concentration (Pc) below which the heat
rate decreased rapidly. The Pcincreased with temperature. The percentage decreases of metabolic heat rate were comparable to the
percentage decreases of O2consumption rate (RO2) at 10, 8, 6, and 4% O2, but were smaller at 2 and 1% O2. The metabolic heat
rate decreased rapidly at 20% CO2relative to 0% CO2, with little to no further decrease between 20 and 79% CO2. The percentage
decreases of RO2under 20 and 79% CO2at 20°C were comparable to the percentage decreases of metabolic heat rates. The additive
effects of subatmospheric O2and elevated CO2levels on reducing metabolic heat rate were generally fully realized at combinations
of #5% CO2 and $4% O2, but became increasingly overlapped as the O2 concentration decreased and the CO2 concentration
increased. The high susceptibility of pupae to elevated CO2at high temperature was correlated with high metabolic heat rate. The
metabolic responses of pupae to reduced O2concentrations included metabolic arrest and anaerobic metabolism. The net effect of
elevated CO2on the pupal respiratory metabolism was similar to that of reduced O2; however, mechanisms other than the decrease
of metabolism were also contributing to the toxicity of CO2.2000 Elsevier Science Ltd. All rights reserved.
Keywords: Carbon dioxide; Metabolic heat rate; Microcalorimetry; Oxygen; Respiration rate
1. Introduction
Controlled atmospheres (CA) with elevated CO2,
reduced O2, or their combinations can be used to control
insects (Carpenter and Potter, 1994; Mitcham et al., 1997b). Above 20%, CO2 can cause significant insect
mortality in proportion to CO2 concentration. Reducing
O2 to less than 3% can be insecticidal, and efficacy
increases as O2 is reduced to lower concentrations. The
combined effects of elevated CO2 and reduced O2 are
less clear; some studies have shown additive effects while others have not (Fleurat-Lessard, 1990; Soder-strom et al., 1991). Temperature greatly affects the effi-cacy of CA; higher effieffi-cacy is usually achieved at higher temperatures (Banks and Annis, 1990; Carpenter and Potter, 1994). There have been few physiological or
bio-* Corresponding author. Fax:+1-530-752-8502.
E-mail address: [email protected] (E.J. Mitcham).
0022-1910/00/$ - see front matter2000 Elsevier Science Ltd. All rights reserved. PII: S 0 0 2 2 - 1 9 1 0 ( 0 0 ) 0 0 0 6 0 - 3
chemical explanations for these mortality responses. Lack of such knowledge has rendered the development of CA treatments costly and time consuming (Carpenter et al., 1993). If we can understand the physiological and biochemical responses of insects to CA and can relate such responses to mortality, then we might be able to develop physiological or biochemical models to deter-mine effective treatments instead of relying on empirical mortality tests.
Hypotheses have been proposed as to how invert-ebrates and higher animals respond to low O2
environ-ments (Herreid, 1980; Hochachka, 1986; Weyel and Wegener, 1996). An organism is described as a meta-bolic regulator if its O2 consumption is independent of
ambient O2concentrations and as a metabolic conformer
if its O2consumption is dependent upon ambient O2
con-centrations. No species is a perfect regulator over the entire range of O2 tensions; it becomes a conformer
when the ambient O2 concentration is below a critical
Pc varies with many factors, including the organism’s
metabolic demand. The Pcdecreases at lower metabolic
demand. It has been proposed that as a metabolic regu-lator, an organism regulates O2consumption at reduced
O2tensions by behavioral and/or physiological
compen-sations which guarantee that the O2 concentration in the
tissue does not decrease. The physiological compen-sation could include respiratory compencompen-sation such as increasing ventilation, circulatory compensation such as increasing the rate of blood perfusion, or the use of res-piratory pigments (Herreid, 1980).
However, as a metabolic conformer at below Pc, an
organism experiences hypoxia (insufficient supply of O2
to tissues). It has been proposed that animals mainly use two strategies to cope with hypoxia: anaerobic metab-olism and metabolic arrest (Hochachka, 1986; Weyel and Wegener, 1996). Anaerobic metabolism can tempor-arily compensate for energy insufficiency of oxidative phosphorylation. However, this strategy would require very high rates of glycolysis and thus lead to rapid exhaustion of carbohydrate reserves while toxic end pro-ducts accumulate. Metabolic arrest, that is, reducing ATP turnover (demand) and thus reducing metabolic rate, is thought to be a better strategy. It lessens the pressure on the organism to initiate anaerobic metab-olism. However, because reduced ATP turnover also means reduced energy use for ion transport across the membrane, the effectiveness of this strategy requires low membrane permeability.
These drawbacks of the two strategies, especially that of metabolic arrest, have been thought to be the cause of hypoxic/anoxic toxicity (Hochachka, 1986). Accord-ing to Hochachka (1986), reduced O2consumption leads
to a decreased rate of ATP production. As a result of energy insufficiency, the membrane ion pumps fail, lead-ing to K+ efflux, Na+ influx, and membrane depolariz-ation. The voltage-dependent Ca2+gates are then opened,
causing Ca2+ influx. The high concentration of Ca2+ in
cytosol activates phospholipases A1, A2, and C, leading to increased membrane phospholipid hydrolysis. The cell and mitochondrial membranes become more permeable, causing cell damage or death.
Do these general hypotheses apply to insects? If so, can some aspects of these hypotheses explain the effects of elevated CO2? It has been proposed that the effects
of hypercarbia on insects probably do not exclude the effects of hypoxia (Fleurat-Lessard, 1990) because high CO2can prevent insects from using O2(Navarro, 1975).
However, this latter point is controversial because others have observed that the O2consumption rate of insects is
not reduced by elevated CO2levels with 21% O2present
(Edwards and Batten, 1973). As to the combined effects of elevated CO2 and reduced O2, it appears that the
influence of the proportion of CO2 becomes more
important as the O2 content is increased above 1% and
the contribution to mortality by CO2action increases as
the low O2 effect becomes marginal (Banks and
Annis, 1990).
Our objectives were to address these questions by studying the metabolic responses of Platynota stultana
pupae (an important pest on many horticultural
commodities) to various levels of reduced O2, elevated
CO2, and their combinations. Specifically, metabolic
heat rates, indicative of the overall metabolic rates of an organism (Loike et al., 1981; Criddle et al., 1988), and respiration rates were measured under various atmos-pheres. In addition, mortality tests were performed under some atmospheres and the mortality responses were cor-related with metabolic responses.
2. Materials and methods
2.1. Experimental insects
Platynota stultana was reared on a lima bean-based
diet in an incubator at 27±0.5°C, 85% RH with a photop-eriod of 16:8(L:D) h (Yokoyama et al., 1987). The 1–2 d old female pupae were selected for experiments because there was little variability in metabolic rate within this age group.
2.2. Calorimetry measurements
Rates of metabolic heat production were measured using differential scanning calorimeters with isothermal and temperature scanning capabilities (model 7707, Hart Scientific Inc., Provo, UT). The isothermal operating mode was used to measure metabolic heat rates at a given temperature. Each calorimeter has three measuring cells and one reference cell, allowing three samples to be measured simultaneously in one machine. Samples were placed in ampoules with an internal volume of 1.05 ml. The heat rates were measured continuously until they were stabilized to constant rates indicating that the samples and chamber had attained a steady state (approximately 45 min). The constant heat rates were
corrected with baselines measured using empty
ampoules. The corrected heat rates were the metabolic heat rates of the samples.
2.3. Controlled atmosphere set-up in the ampoules
Appropriate amounts of air, CO2, N2, and O2 were
side. Open ampoules containing pupae were placed on sticky tapes in the middle of the bag, with lids beside. The open side of the bag was folded and sealed by clamping two thin and narrow plates on the folded area. The outlet of the bag was clamped temporarily to inflate the bag with the mixed gases. Then the clamp on the outlet was released and the gas in the bag was pushed out. This process was repeated 4–5 times until the gas concentration in the bag reached the correct level, which was confirmed by drawing samples from the bag and analyzing them by gas chromatography. The ampoules in the bag were then sealed with their lids through the bag. The sealed ampoules were then taken out of the bag and placed into calorimeter cells for metabolic heat rate measurement.
2.4. Metabolic response of pupae to controlled atmospheres
The number of pupae per ampoule varied with the test temperature (10 at 10°C, 4 at 20°C, and 2 at 30°C) to allow the total measured heat rates at different tempera-tures to be close to each other. The metabolic heat rates under air were first measured. The ampoules were then opened and an appropriate atmosphere was added to the ampoules as described above. The metabolic heat rates under CA were then measured. After measurements the pupae were dried in an 80°C vacuum oven for at least 24 hours to obtain their dry weights. The percentage decrease of metabolic heat rate under an atmosphere was calculated.
2.5. Respiration measurement
The O2 consumption rate (RO2) and CO2 production
rate (RCO2) of pupae under various O2 concentrations
were obtained by measuring the volume of O2 (VO2)
consumed and the volume of CO2 produced (VCO2) at
a given time in a closed syringe. Thirty pupae were weighed and placed in a 20 ml syringe without its needle. The syringe, along with the plunger and a small rubber septum, were placed in a plastic bag that was connected to a constant flow of a desired gas mixture as described above. When the correct concentration of the gas in the bag was established, the plunger was pushed into the syringe, leaving 18 ml of volume. Then the rub-ber septum was put on the tip of the syringe (where a needle is usually mounted) to seal it. These operations were performed through the plastic bag while it was sealed and the gas was flowing through it. Immediately after the sealed syringe was taken out of the bag, three 1-ml gas samples were taken from the syringe through the rubber septum and analyzed simultaneously for O2
and CO2 using an infra-red gas analyzer (model
PIR-2000R, Horiba Instruments, Irvine, CA). The syringe, now having a volume of 15 ml, was placed in a
tempera-ture controlled room. The gas concentrations in the syr-inge were analyzed again after 2 hours. The VO2 and VCO2 were calculated from the change between the
initial and final O2 and CO2 concentrations. The pupae
were then dried in an 80°C vacuum oven for at least 24 hours to obtain pupal dry weight. The RO2s under
vari-ous CO2 concentrations were also measured as
described above.
2.6. Mortality test
The mortality of pupae was tested under 20, 40, and 79% CO2 at .90% RH (all added to 21% O2, balance
N2) at 10, 20, and 30°C. Using flow boards, constant
flow of gas mixtures at a rate of 150 ml/min passed through a 1 liter treatment jar where test pupae were placed. The gas concentrations inside jars were sampled daily during treatment and analyzed by gas chromato-graphy.
Controlled atmosphere treatments were conducted in controlled temperature rooms maintained at 10, 20, and 30°C. Thirty pupae were placed in a cup with a mesh top. The cup was placed in a jar through which an atmos-phere was passed. The range of treatment times for each atmosphere at each temperature was determined by pre-liminary tests, and corresponded with treatment times during which 10 to 100% mortality was expected. After treatments the pupae were transferred to an incubator at 27°C and 80–90% RH. Adult eclosion or lack thereof was observed after 2 weeks to determine mortality. All treatments were replicated at least 3 times.
2.7. Statistical analysis
The data for the percentage decrease of metabolic heat rate, respiration rates, and respiration quotient (RQ) were analyzed by ANOVA (GLM, SAS Institute, 1989). Means for significant effects were separated by t-test (LSD). Response surfaces were fitted for the percentage decrease of metabolic heat rates under the combinations of reduced O2and elevated CO2. A separate probit curve
for each treatment level was fitted with mortalities as the dependent variables and treatment duration as the independent covariates (PROC PROBIT, SAS Institute, 1989). The fitted probit curves were used to calculate LT99 values.
3. Results
3.1. Temperature
The metabolic heat rate under air (21% O2/0.03%
CO2) was 1.2, 3.7, and 7.5µW/mg at 10, 20, and 30°C,
respectively. The Q10between 10 and 20°C was
3.2. Reduced O2
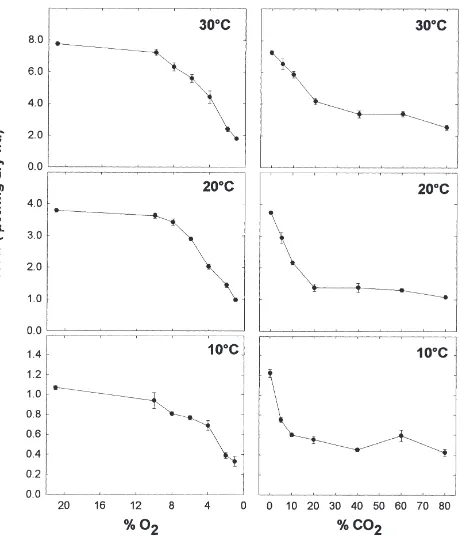
The metabolic heat rate decreased with decreasing O2
concentration (Fig. 1). At all three temperatures, the decrease was slight until a critical O2 concentration
below which the decrease became rapid. The critical O2
concentrations were higher at higher temperatures, being 6% O2 at 10°C, 8% O2 at 20°C, and 10% O2 at 30°C
(Fig. 2(A)). Temperature had slight but significant effects on the heat rate decreases (Fig. 2(A)). The per-centage decreases were slightly higher at higher tem-peratures at 6, 4, 2, and 1% O2. But at 10 and 8% O2
the percentage decreases at 10°C were higher than at 20 or 30°C. ANOVA results for reduced O2concentrations
were highly significant (P,0.0001) for O2
concen-tration, temperature and O2 concentration×temperature.
The O2 consumption rate (RO2) at 20°C decreased
slightly with decreasing O2 concentration down to 8%
O2, and then decreased rapidly (Fig. 3). The percentage
decreases of RO2 at 20°C, which were 11, 15, 25, 41,
77, and 83 at 10, 8, 6, 4, 2, and 1% O2, respectively,
were comparable to the percentage decreases of meta-bolic heat rate under various O2 concentrations at 20°C
except at 2 and 1% O2, where the percentage decreases
of RO2were about 10% higher (Fig. 2(A)). The
percent-age decreases of CO2 production rate (RCO2), which
were 9, 19, 21, 33, 58, and 70 at 10, 8, 6, 4, 2, and 1% O2, respectively, were comparable to those of metabolic
Fig. 1. Metabolic heat rate (µW/mg dry wt.) of 1–2 d old Platynota
stultana female pupae under various O2concentrations(with 0% CO2)
and various CO2concentrations (with 21% O2) at 10, 20 and 30°C.
Vertical bars represent standard errors.
Fig. 2. The percentage decrease of metabolic heat rate of 1–2 d old
Platynota stultana female pupae under various O2concentrations (with
0% CO2) (A) and various CO2concentrations (+21% O2) (B) at 10,
20 and 30°C. Vertical bars represent standard errors.
Fig. 3. O2 consumption rate (RO2) (µl·h21·g21 dry wt.), CO2
pro-duction rate (RCO2) (µl·h21·g21dry wt.), and respiratory quotient (RQ)
of 1–2 d old Platynota stultana female pupae under various O2
concentrations(with 0% CO2) at 20°C. Vertical bars represent
heat rate under all O2 concentrations (Fig. 2(A)). The
respiratory quotient (RQ) showed no significant change between 21 and 4% O2, with values between 0.65 and
0.80. However, the RQ increased significantly to about 1.3 when O2 concentration was reduced to 2 and 1%
(Fig. 3). ANOVA results for various O2 concentrations
were highly significant (P,0.0001) for RO2, RCO2,
and RQ.
3.3. Elevated CO2
The metabolic heat rate decreased rapidly between 0 and 20% CO2 (Fig. 1), with a 60% decrease at 10 and
20°C and a 40% decrease at 30°C under 20% CO2(Fig.
2(B)). Further decrease of metabolic heat rate between 20 and 79% CO2 was slight. At 10°C, there was no
further decrease of metabolic heat rate between 20 and 79% CO2. At 20°C, the metabolic heat rate further
decreased under 60 and 79% CO2, with a 72% decrease
at 79% CO2. At 30°C, the metabolic heat rate continued
to decrease from 20 to 79% CO2, but at a much slower
rate than that from 0 to 20% CO2. The percentage
decreases of metabolic heat rate at a certain CO2
concen-tration were generally lower at 30°C than at 10 and 20°C, which were mostly similar except at the two ends of the CO2 spectrum (Fig. 2(B)). ANOVA results for
elevated CO2 concentrations were highly significant
(P,0.0001) for CO2concentration, temperature and CO2
concentration×temperature.
The RO2at 20°C (660µl•h21•g21) decreased by 62%
at 20% CO2 (250µl•h21•g21) and by 73% at 79% CO2
(185µl•h21•g21). The percentage decreases of RO 2were
comparable to the percentage decreases of metabolic heat rate under the same CO2concentrations (Fig. 2(B)).
3.4. Combinations of elevated CO2 and reduced O2
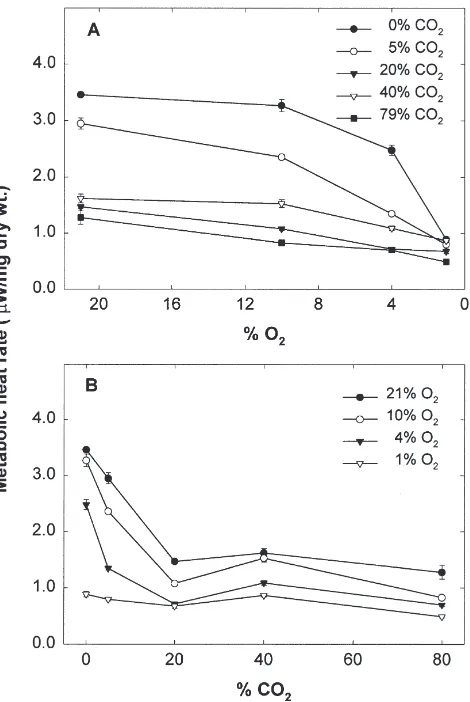
Reducing O2 concentration at 20°C decreased
meta-bolic heat rate further at all CO2 concentrations (Fig.
4(A) and Table 1). However, the effects of reduced O2
were smaller at higher CO2 concentrations (Table 2).
The effects of elevated CO2 on metabolic heat rates
varied with O2and CO2concentrations (Fig. 4(B), Table
1). At 4% O2 or higher, metabolic heat rate decreased
rapidly between 0 and 20% CO2 and there was little
further decrease between 20 and 79% CO2. At 1% O2,
only 20 and 79% CO2 decreased the metabolic heat rate
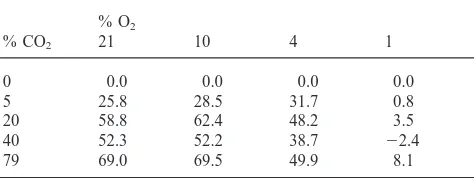
further. The additional percentage decreases in metabolic heat rate contributed by elevated CO2 were generally
smaller at lower O2 concentrations (Table 3). At 10%
O2, all CO2concentrations showed their full effects, with
the additional percentage decreases similar to those at 21% O2. At 1% O2, however, there was little additional
effect of CO2 (Table 3).
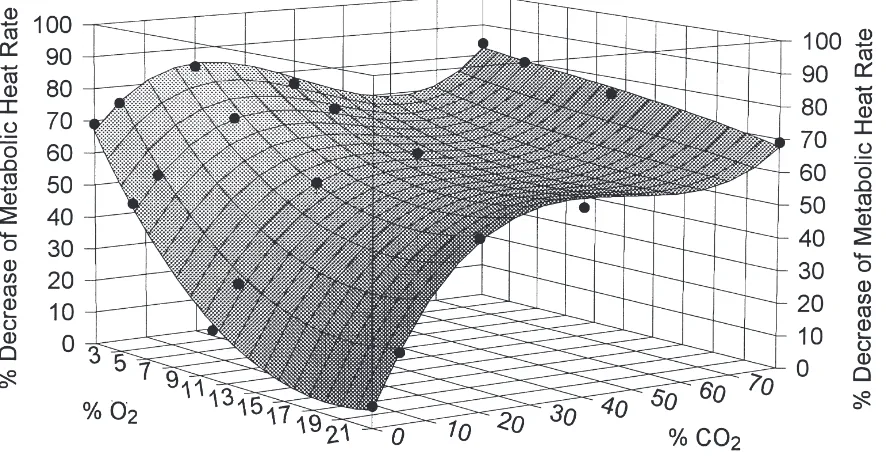
The response surface of the percentage decrease of metabolic heat rate fitted with a polynomial of term 3
Fig. 4. Metabolic heat rate (µW/mg dry wt.) of 1–2 d old Platynota
stultana female pupae under combinations of reduced O2and elevated
CO2at 20°C; (A) effects of reducing O2concentration at various CO2
concentrations; (B) effects of increasing CO2concentration at various
O2concentrations. Vertical bars represent standard errors.
showed that the full additive effects on reducing metab-olism mostly occurred at combinations of#5% CO2and $4% O2 (Fig. 5). The combined effects of reduced O2
and elevated CO2became increasingly overlapped as the
O2 concentration decreased and the CO2 concentration
increased.
3.5. Mortality responses to elevated CO2
Temperature had a dominant impact on the mortality responses; the higher the temperature, the more suscep-tible the pupae (Fig. 6, Table 4). However, the effect of temperature varied with CO2 concentration. At 20%
CO2, lowering temperature from 20 to 10°C increased
LT99greatly (Table 4). At 79% CO2, however, lowering
temperature from 20 to 10°C did not change LT99
sig-nificantly. CO2concentrations affected mortality, but the
specific effects were dependent on temperature. Forty and 79% CO2were more effective than 20% CO2at all
Table 1
Pecentage decrease of metabolic heat rate of 1–2d old Platynota stultana female pupae under combinations of CO2and O2at 20°Ca
% CO2
% O2 0 5 20 40 79
21 0.0 d, E 25.8 d, D 58.8 d, B 52.3 d, C 69.0 d, A
10 5.7 c, E 34.2 c, D 68.1 c, B 57.9 c, C 75.2 c, A
4 29.6 b, D 61.3 b, C 77.8 b, A 68.3 b, B 79.5 b, A
1 76.6 a, C 77.4 a, C 80.1 a, B 74.2 a, D 84.7 a, A
aWithin each column, mean differences are indicated by lower case letters (t-test). Within each row, mean differences are indicated by upper
case letters.
Table 2
The additional percentage decrease of metabolic heat rate caused by reduced O2when 1–2d old Platynota stultana female pupae were under various
concentrations of CO2at 20°C
% CO2
% O2 0 5 20 40 79
21 0.0 0.0 0.0 0.0 0.0
10 5.7 8.4 9.3 5.6 6.2
4 29.6 35.5 19.0 16.0 10.5
1 76.6 51.6 21.3 21.9 15.7
Table 3
The additional percentage decrease of metabolic heat rate caused by elevated CO2 when 1–2d old Platynota stultana female pupae were
under various concentrations of O2at 20°C
% O2
% CO2 21 10 4 1
0 0.0 0.0 0.0 0.0
5 25.8 28.5 31.7 0.8
20 58.8 62.4 48.2 3.5
40 52.3 52.2 38.7 22.4
79 69.0 69.5 49.9 8.1
effective than 40% CO2at 20 and 30°C. Increasing CO2
concentration from 20 to 79% CO2 greatly improved
efficacy at 10°C, but not at 20°C.
An atmosphere of 40% CO2+21% O2 at 20°C caused
high mortality at short treatment durations, e.g., above 40% mortality with only 3 hours of exposure (Fig. 6). This atmosphere also caused the pupal body fluid to leak out immediately during exposure. This body fluid leak-age phenomenon did not occur under 20 and 79% CO2
(+21% O2), 0 to 21% O2, or even 40% CO2+1% O2.
4. Discussion
4.1. Reduced O2 concentrations
The O2consumption rate of Platynota stultana pupae
decreased slightly with decreasing O2concentration until
a critical concentration point (Pc) below which the
decrease became rapid. This O2 consumption pattern is
typical of that of invertebrates in response to decreasing environmental O2 concentrations (Herreid, 1980). The
pupae regulated their O2 consumption between 21 and
8% O2at 20°C, probably by increasing ventilation. The
pupae were metabolic regulators at this O2 range.
How-ever, the pupae became metabolic conformers at below 8% O2when increased ventilation could not compensate
for O2 insufficiency. It is interesting to note that the
pupae’s Pcwas lower at a lower temperature (6% O2at
10°C) and higher at a higher temperature (10% O2 at
30°C). This is in accordance with the generalization that
Pcis higher at higher metabolic demand (Herreid, 1980).
The metabolic heat rates of the pupae, which indicate metabolic demand, were much lower at lower tempera-tures.
When the pupae could not compensate for the O2
insufficiency in their tissues at below Pc, they started to
experience hypoxia. Of the two strategies, metabolic arrest and anaerobic metabolism, that an organism uses to cope with hypoxia (Herreid, 1980; Hochachka, 1986; Weyel and Wegener, 1996), it seemed that metabolic arrest was the main strategy used by Platynota stultana pupae. With the decreasing O2consumption at below Pc,
the pupal total metabolism, as indicated by metabolic heat rates, decreased accordingly; the percentage decreases of metabolic heat rate were comparable to the percentage decreases of O2 consumption rates at 10, 8,
6, and 4% O2. The RQ at these O2 concentrations, with
a range of 0.65 to 0.80, did not differ significantly with each other and with that at 21% O2, suggesting that the
Fig. 5. The response surface of the percentage decrease of metabolic heat rate under combinations of reduced O2 and elevated CO2 at 20°C,
fitted with a polynomial of term 3, z=a+bx+cy+dx2+ey2+fxy+gx3+hy3+ixy2+jx2y, with z denoting percentage decrease, x denoting percentage O 2, and y denoting percentage CO2. a=74.9022, b=28.2590, c=1.8208, d=0.2561, e=20.0614, f=0.1412, g=20.0010, h=0.0005, i=20.0006, j=20.0029. r2=0.9941, DF adj r2=0.9875, FitStdErr=2.4656, Fstat=186.8371.
Fig. 6. Percentage mortalities of 1–2 d old Platynota stultana female pupae under 20, 40, and 79% CO2 (+21% O2) at 10, 20, and 30°C.
Means represent 3 to 4 replications.
and that the pupae did not initiate anaerobic metabolism. When O2concentration was reduced to 2 or 1%, the
per-centage decrease of metabolic heat rate was less than the percentage decrease of O2 consumption, suggesting that
the metabolic arrest could not match the decrease of oxi-dative phosphorylation. Anaerobic metabolism must be initiated to compensate for the shortage of energy. This was confirmed by the increased RQ (1.3) at 2 or 1% O2.
This O2 concentration at which anaerobic metabolism
was initiated can be denoted as Pa (called anaerobic
compensation point in plant literature).
That insects use metabolic arrest to cope with hypoxia
Table 4
Probit LT99s (95% fiducial limits) in days for 1–2 d old Platynota stultana female pupae under 20, 40, and 79% CO2+21% O2at 10, 20,
and 30°Ca
% CO2 30°C 20°C 10°C
20 2.4 (2.1–3.7) 5.3 (4.9–5.8) 15.8 (13.1–21.5) 40 1.5 (1.3–1.7) 5.9 (4.5–9.9) 7.6 (7.0–8.3) 79 1.6 (1.5–1.7) 4.3 (3.8–5.5) 4.5 (4.0–5.3)
a Pearson’s X2s were small (p
.0.10) except as follows: p,0.001 for 30°C+20% CO2, and 20°C+40% CO2; and p,0.05 for 10°C+20%
CO2and 20°C+80% CO2; only 20°C+40% CO2showed a lack of fit
due to high mortality at short treatment times.
and anoxia was also observed on Locusta migratoria and
Manduca sexta adults by Wegener and Moratzky (1995).
The metabolic heat rates of L. migratoria and M. sexta did not change between 21 and 2% O2 at 20°C, but
decreased by 30–40% at 1% O2, 60–75% at 0.5% O2,
and 95–96% at 0% O2. The initiation of anaerobic
metabolism by insects at very low O2tensions was also
observed by Navarro and Friedlander (1975), who found that the lactate levels in Ephestia cautella pupae (6 mg/100 ml hemolymph) did not change when the O2
concentration was reduced from 20 to 3% at 26°C, but rose suddenly at below 3% and reached 288 mg/100 ml hemolymph at 1% O2.
From the above analysis we make the following hypothesis about the metabolic response of P. stultana pupae to reduced O2concentrations. When O2tension is
close to normal levels by accelerated ventilation. This O2range does not affect the insects except that high
ven-tilation may cause water loss at high temperature and low humidity. However, at O2 tensions below Pc when
sufficient O2 cannot be supplied to the tissues and thus
ATP generation is reduced, the insects lower their metabolism; that is, they reduce metabolic demands. At the O2 range between Pc and Pa, the reduced oxidative
respiration is probably sufficient to satisfy the reduced energy demand and thus anaerobic metabolism is not necessary. This O2 range would probably not threaten
the insects’ survival. At O2 tensions below Pa, the
reduced oxidative respiration is not sufficient to satisfy the reduced energy demand. Anaerobic metabolism must be initiated to supplement the energy demand. Both the accumulated anaerobic end products and the very low metabolism impose stress on the insects (Hochachka, 1986). This O2range (below Pa) appears to be the
insec-ticidal range.
Recent reviews of the use of controlled atmospheres for the control of insect pests (Banks and Annis, 1990; Mitcham et al., 1997b; Carpenter and Potter, 1994) have concluded that the O2level needs to be below 3% to be
effective; and in most cases, it needs to be below 1% for rapid kill. These O2 levels (below 3%) seem to
coincide with Pa, the O2level at which anaerobic
metab-olism is initiated. It appears that empirical data support our proposition about the relationship between Pa and
the toxic O2 level.
It is important to point out that this relationship should not imply that anaerobic metabolism is the sole cause of hypoxic toxicity. The very low energy supply is prob-ably the main cause of hypoxia toxicity, as proposed by Hochachka (1986). The low energy supply under hypoxia/anoxia has been confirmed by ATP measure-ments. The ATP concentration of the whole tissues of
Ephestia cautella pupae decreased by 30% after
exposure to 1% O2 for 24 hours at 26°C (Friedlander
and Navarro, 1979). The contents of ATP in the flight muscle of L. migratoria adults dropped to 1% of normal during 2 hours of anoxia; the ADP contents was also decreased to levels below normal while AMP accumu-lated 20 fold (Weyel and Wegener, 1996).
4.2. Elevated CO2 concentrations
Our data clearly showed that elevated CO2
concen-trations prevented insects from using O2even with 21%
O2 present. The O2 consumption rate of Platynota stul-tana pupae decreased by 62% in 20% CO2+21% O2and
by 73% in 79% CO2+21% O2 at 20°C. Similar
obser-vations have been made with other insect species. The O2consumption by Ephestia cautella pupae was
signifi-cantly reduced by hypercarbia (Navarro, 1975). In crick-ets it was indicated that high CO2pushed respiration into
anaerobic pathways (fermentative metabolism) even
with 20% O2 present (Kerr et al., 1993). The rate of
respiration of Tribolium confusum adults, as measured by CO2 output, was severely depressed during initial
hours of exposure to elevated CO2 concentrations
(Aliniazee, 1971). However, there seem to be exceptions to this generalization. Edwards and Batten (1973) observed that the O2consumption rate of house flies did
not decrease in 33% CO2+21% O2 compared with that
in air. But this observation is in contradiction Edwards (1968) that high CO2inhibited in vitro succinic
dehydro-genase in the gut tissues of Heliothis zea larvae, which suggests that O2 consumption should be depressed by
high CO2because the main metabolic pathway of
oxidat-ive respiration is inhibited.
Because elevated CO2prevents insects from using O2,
it appears that the net effect of elevated CO2 on the
insect respiratory metabolism is similar to that of reduced O2. Both reduce oxidative phosphorylation even
though the target sites of the two types of atmospheres may be different; reduced O2 limits a substrate (O2) of
respiratory metabolism, whereas elevated CO2 inhibits
respiratory enzymes such as succinic dehydrogenase (Edwards, 1968). Reduced oxidative phosphorylation leads to reduced ATP generation. This has been demon-strated by Friedlander and Navarro (1979), who found that high CO2 causes a decrease in ATP levels and the
energy charge in insect tissues. It is likely that insects use the same strategies to cope with energy shortages caused by hypercarbia as those used to cope with energy shortages caused by hypoxia: metabolic arrest and/or anaerobic metabolism (Hochachka, 1986; Weyel and Wegener, 1996). That the strategy of metabolic arrest is used by insects in response to hypercarbia is supported by our observation that the total metabolism of Platynota
stultana pupae decreased at elevated CO2concentrations
and that the percentage decrease of metabolism, as indi-cated by metabolic heat rate, was comparable to the per-centage decrease of O2consumption rate at various CO2
levels. The insects probably reduce or cease most growth-related biosynthetic activity and limit their energy use to survival needs such as maintaining mem-brane potentials. That high CO2 reduces NADPH
pro-duction (Friedlander et al., 1984) and inhibits the biosynthesis of glutathione (Friedlander and Navarro, 1984) seems to support this notion. Although it was not clear from our data that the pupae initiated anaerobic metabolism under elevated CO2, this effect has been
shown by other researchers. Kerr et al. (1993) suggested that in crickets high CO2 atmospheres induced
anaero-biosis even with 20% O2 present. Navarro and
Fried-lander (1975) observed that lactate rose in Ephestia
caut-ella pupae exposed to 80% CO2+20% O2.
The metabolism of Platynota stultana pupae
decreased rapidly as the environmental CO2
concen-tration was elevated from 20 to 79%. Since respiratory enzymes are inhibited by CO2 (Edwards, 1968), this
quantitative response seemed to indicate that the capacity of respiratory enzymes was increasingly inhibited by increasing concentrations of CO2, but after
a point more CO2did not further inhibit the capacity. It
is interesting to note that empirical mortality data have shown that toxic levels of CO2are generally above 20%
(Banks and Annis, 1990; Mitcham et al., 1997a; Carp-enter and Potter, 1994).
4.3. Temperature
The normal metabolic rate of Platynota stultana pupae tripled from 10°C to 20°C and doubled again from 20°C to 30°C, reflecting the huge impact of temperature on insect metabolism. Temperature also has a slight but sig-nificant effect on the metabolic response of insects to both reduced O2and elevated CO2, but the effect seemed
to differ between reduced O2and elevated CO2. The
per-centage decrease of metabolism by a given low O2
con-centration was higher at higher temperatures, whereas the percentage decrease of metabolism by a certain elev-ated CO2 concentration was lower at higher
tempera-tures. However, it is interesting to note that the response patterns with varying O2or CO2concentrations at
differ-ent temperatures were similar.
4.4. Relationship between metabolic response and mortality response to elevated CO2
Three trends have been observed regarding the mor-tality response of Platynota stultana pupae to elevated CO2: (1) the pupae were more susceptible to CO2
treat-ment at higher temperatures; (2) the effects of tempera-ture varied with individual CO2 concentration; and (3)
CO2 concentration (above 20%) affected mortality, but
the specific effects were temperature dependent. The higher susceptibility at higher temperatures seemed to correlate with higher metabolism. However, it is interest-ing to note that the metabolic response to elevated CO2,
as indicated by the percentage decrease of metabolism, was only slightly different at 10, 20 and 30°C. In fact, the percentage decreases at 30°C were less than the per-centage decreases at 20 and 10°C. It appeared that it is not the relative percentage decrease of metabolism but the absolute decrease of metabolism that was related to susceptibility. To illustrate, if we accept that metabolism can be represented by the unit of metabolic heat rate, then the absolute decrease of metabolism by 20% CO2
was 2.2µW/mg at 20°C (a 60% decrease of the normal metabolism of 3.7 µW/mg). The absolute decreases of metabolism were 3.1 at 30°C and 0.7 at 10°C. It is likely that it is the absolute decrease of metabolism that causes energy shortage, which would have to be compensated from the same ATP pool. Because the absolute decrease
of metabolism is much lower at 10°C than at 20 or 30°C, it would take longer to use up the ATP pool at 10°C than at 20 or 30°C. Therefore, it seems that the insect susceptibility is related to the absolute decrease of metabolism. However, this correlation cannot explain the observation that the efficacy of 79% CO2 differed
little at 10 and 20°C.
The efficacy of 40 and 79% CO2was higher than that
of 20% CO2 at all three temperatures. But there was no
difference between 40 and 79% at 20 and 30°C, while 79% was more effective than 40% at 10°C. Similar find-ings have been obtained with other insect species. The LT95s for codling moth eggs at 25°C were 3.6, 1.3, 1.4,
and 1.6 d at 20, 40, 60, and 80% CO2in air (Soderstrom
et al., 1991), suggesting that the efficacy was not enhanced above 40% CO2. The mortality of New
Zea-land thrips adults did not increase when CO2
concen-tration was increased from 40 to 60% at 24°C (Carpenter et al., 1998). Recent reviews have concluded that there was no enhancement of insect mortality above 40–60% CO2 (Banks and Annis, 1990; Carpenter and Potter,
1994). Our data show that this conclusion is mostly applicable to temperatures such as 20 and 30°C. At 10°C, increasing CO2 concentration from 40 to 79%
increased mortality of Platynota stultana pupae. The increased efficacy of CO2concentrations above 40–60%
at low temperatures was also observed at 0°C on Pacific spider mites (Zhou and Mitcham, 1998). The metabolism of Platynota stultana pupae decreased rapidly from 0 to 20% CO2, but further decreases were slight between 20
and 79% CO2. The minor enhancement of mortality
between 40 and 79% CO2at 20 or 30°C could be related
to the slight further decrease of metabolism. However, the higher efficacy of 40% CO2, compared with that of
20% CO2, was not correlated with a similar percentage
decrease of metabolic rate. In addition, although the efficacy of CO2 increased greatly from 20 to 79% CO2
at 10°C, the percentage decrease of metabolism showed no difference at this concentration range. It seems that mechanisms other than the decrease of metabolism were contributing to the toxicity of CO2. For example, 40%
CO2 at 20°C caused Platynota stultana pupae’s body
fluid to leak out, suggesting that the insects’ membrane systems were affected. Because CO2 can increase
intra-cellular Ca2+by decreasing pH (Lea and Ashley, 1978),
it is likely that although the metabolism cannot be further reduced by CO2 concentration above 40%,
elev-ating CO2 concentration can further decrease pH and
thus cause intracellular Ca2+ to rise more and faster,
leading to cell damage or death (Hochachka, 1986). The greater efficacy of higher concentrations of CO2 at low
temperatures could be related to the higher solubility of CO2 in tissues at low temperatures (Yacoe, 1986).
under extended exposure to reduced O2or elevated CO2
concentrations. It is interesting to note that the percent-age decreases of metabolism are comparable between 2% O2and 20 or 40% CO2and between 1% O2and 79%
CO2. If other modes of action in addition to the decrease
of metabolism are contributing to CO2 toxicity, then the
elevated CO2 concentrations should be more effective
than their comparable reduced O2 concentrations.
4.5. Combinations of elevated CO2 and reduced O2
Empirical studies on the additive effects of combi-nations of elevated CO2 and reduced O2 on insect
mor-tality have yielded mixed results. Some observed
addi-tive effects (Calderon and Navarro, 1979;
Krishnamurthy et al., 1986) while others did not (Soderstrom et al., 1991; Mitcham et al., 1997a). How-ever, it seems that these different results are probably, in most part, attributable to the different ranges of gases used; additive effects were mostly observed at milder gas combinations such as 5–15% CO2+2% O2, while
absence of additive effects was mostly observed at more severe gas combinations, such as .40% CO2+0 to 0.5%
O2. These mixed results in mortality are probably related
to metabolic responses. The additive effects of combi-nations of elevated CO2and reduced O2on the decrease
of metabolism of Platynota stultana pupae were almost fully realized at combinations of #5% CO2 and $4%
O2. However, the combined effects became increasingly
overlapped as O2concentration decreased and CO2
con-centration increased.
Assuming that the decrease of metabolism is the main mode of toxicity, the observations that the additional decreases of metabolism contributed by reduced O2were
smaller at higher CO2 concentrations and that the
additional decreases of metabolism contributed by elev-ated CO2 were smaller at lower O2 concentrations
sug-gest that reducing O2 concentrations at high
concen-trations of CO2, such as 40–79%, would not enhance
mortality nor would elevating CO2 concentrations at ,1% O2concentrations. This information should reduce
the amount of empirical testing required for development of insecticidal controlled atmosphere treatments.
Acknowledgements
We thank Veronique Bikoba, James Shannon, and William Biasi for their technical assistance in the research. We thank John Church and Lisa Neven for consultations and Alan Carpenter and Adel Kader for reviewing the manuscript. This project was supported by USDA NRI grant # 58-5352-8-011.
References
Aliniazee, M.T., 1971. Effect of carbon dioxide gas on respiration of the confused flour beetle. Journal of Economic Entomology 64, 1304–1305.
Banks, H.J., Annis, P.C., 1990. Comparative advantages of high CO2
and low O2types of controlled atmospheres for grain storage. In:
Calderon, M., Barkai-Golan, R. (Eds.), Food Preservation by Modi-fied Atmospheres. CRC Press, Boca Raton, pp. 93–122.
Calderon, M., Navarro, S., 1979. Increased toxicity of low oxygen atmospheres supplemented with carbon dioxide on Tribolium
cas-taneum adults. Entomologia Experimentalis et Applicata 25, 39–44.
Carpenter, A., Potter, M., 1994. Controlled atmospheres. In: Sharp, J.L., Hallman, G.J. (Eds.), Quarantine Treatments for Pests of Food Plants. Westview Press, Boulder, pp. 171–198.
Carpenter, A., Kerr, S., Lill, R., Irving, D., Corrigan, V., Cheah, L.H., 1993. Recent developments in the use of controlled atmospheres for postharvest disinfestation. In: Proceedings of Australasian Post-harvest Conference, Gatton, Queensland, Australia, September, pp. 395–401.
Carpenter, A., Wright, S., Lash, P., 1998. Response of adult New Zea-land flower thrips (Thysanoptera: Thripidae) to high carbon dioxide and low oxygen atmospheres at various temperatures. Bulletin of Entomological Research 86, 217–221.
Criddle, R.S., Breidenbach, R.W., Lewis, E.A., Eatough, D.J., Hansen, L.D., 1988. Effects of temperature and oxygen depletion on meta-bolic rates of tomato and carrot cell cultures and cuttings measured by calorimetry. Plant Cell and Environment 11, 695–701. Edwards, L.J., 1968. Carbon dioxide anaesthesia and succinic
dehydro-genase in the corn earworm, Heliothis zea. Journal of Insect Physi-ology 14, 1045–1048.
Edwards, L.J., Batten, R.W. II, 1973. Oxygen consumption in carbon dioxide anesthetized house flies, Musca domestica Linn. (Diptera: Muscidae). Comparative Biochemistry and Physiology 44A, 1163–1167.
Fleurat-Lessard, F., 1990. Effect of modified atmospheres on insects and mites infesting stored products. In: Calderon, M., Barkai-Golan, R. (Eds.), Food Preservation by Modified Atmospheres. CRC Press, Boca Raton, pp. 21–38.
Friedlander, A., Navarro, S., 1979. The effect of controlled atmos-pheres on carbohydrate metabolism in the tissue of Ephestia
caut-ella (Walker) pupae. Insect Biochemistry 9, 79–83.
Friedlander, A., Navarro, S., 1984. The glutathione status of Ephestia
cautella (Walker) pupae exposed to carbon dioxide. Comparative
Biochemistry and Physiology 79C, 217–218.
Friedlander, A., Navarro, S., Silhacek, D.L., 1984. The effect of carbon dioxide on NADPH production in Ephestia cautella (Wlk.) pupae. Comparative Biochemistry and Physiology 77B, 839–842. Herreid, C.F., 1980. Hypoxia in invertebrates. Comparative
Biochem-istry and Physiology 67A, 311–320.
Hochachka, P.W., 1986. Defense strategies against hypoxia and hypo-thermia. Science 231, 234–241.
Kerr, S.B., Carpenter, A., Cheah, L.H., 1993. Mode of action of novel disinfestation techniques. AgriTech 93, 112.
Krishnamurthy, T.S., Spratt, E.C., Bell, C.H., 1986. The toxicity of carbon dioxide to adult beetles in low oxygen atmospheres. Journal of Stored Products Research 22, 145–151.
Lea, T.J., Ashley, C.C., 1978. Increase in free Ca2+in muscle after
exposure to CO2. Nature 275, 236–238.
Loike, J.D., Silverstein, S.C., Sturtevant, J.M., 1981. Application of differential scanning microcalorimetry to the study of cellular pro-cesses: Heat production and glucose oxidation of murine macro-phages. In:. Proceedings of the National Academy of Sciences of the USA, 78., pp. 5958–5962.
Mitcham, E.J., Zhou, S., Kader, A.A., 1997b. Potential of CA for post-harvest insect control in fresh horticultural perishables: an update of summary tables compiled by Ke and Kader, 1992. In: Proceed-ings of the Seventh International Controlled Atmosphere Research Conference, July 13-18, University of California, Davis, California, USA, 1, pp. 78–90.
Navarro, S., 1975. Studies on the effect of alterations in pressure and compositions of atmospheric gases on the tropical warehouse moth,
Ephestia cautella (Walker), as a model for stored products insects.
Ph.D. Thesis, Hebrew University of Jerusalem, Israel.
Navarro, S., Friedlander, A., 1975. The effect of carbon dioxide anes-thesia on the lactate and pyruvate levels in the hemolymph of
Ephestia cautella (Wlk.) pupae. Comparative Biochemisty and
Physiology 50B, 187–189.
SAS Institute, 1989. SAS/STAT User’s Guide, version 6, 4th ed. SAS Institute, Cary, NC.
Soderstrom, E.L., Brandl, D.G., Mackey, B., 1991. Responses of Cydia
pomonella (L.) (Lepidoptera: Tortricidae) adults and eggs to
oxy-gen deficient or carbon dioxide enriched atmospheres. Journal of Stored Products Research 27, 95–101.
Wegener, G., Moratzky, T., 1995. Hypoxia and anoxia in insects: microcalorimetric studies on two species (Locusta migratoria and
Manduca sexta) showing different degrees of anoxia tolerance.
Thermochimica Acta 251, 209–218.
Weyel, W., Wegener, G., 1996. Adenine nucleotide metabolism during anoxia and postanoxic recovery in insects. Experientia 52, 474– 480.
Yacoe, M.E., 1986. Effects of temperature, pH, and CO2tension on the
metabolism of isolated hepatic mitochondria of the desert uiguana,
Dipsosaurus dorsalis. Physiological Zoology 59, 263–272.
Yokoyama, V.Y., Miller, G.T., Harvey, J.M., 1987. Development of oriental fruit moth (Lepidoptera: Tortricidae) on a laboratory diet. Journal of Economic Entomology 80, 272–276.