Journal of Insect Physiology 47 (2001) 213–224
www.elsevier.com/locate/jinsphys
Carbon dioxide release in
Coptotermes formosanus
Shiraki and
Reticulitermes flavipes
(Kollar): effects of caste, mass, and
movement
Thomas G. Shelton
*, Arthur G. Appel
Department of Entomology and Plant Pathology, 301 Funchess Hall, Auburn University, Auburn, AL 36849-5413, USA
Received 11 October 1999; accepted 20 June 2000
Abstract
Movement and carbon dioxide (CO2) release of individual Formosan,Coptotermes formosanusShiraki and Eastern,Reticulitermes
flavipes (Kollar) subterranean termites were recorded simultaneously in real time. Worker, soldier, and pre-alate (nymph) caste termites were recorded over 1-h periods at ambient temperature and normoxia in dry, CO2-free air. No evidence of discontinuous gas exchange cycles (DGCs) was observed in 344 recordings. Intensity of movement was constant in video tape recordings of termites under respirometry conditions. Duration of movement did not have a significant effect on residuals of V˙CO2regressed on
mass. Thus, movement did not effect V˙CO2 for these two species. Overall CO2 release values were calculated for all recordings resulting in mean V˙CO2 (ml CO2 g
21 h21), and compared among caste, colony, and species with a nested ANOVA. There was significant interaction (P=0.0161) only for species. Mean CO2release was significantly greater forR. flavipes(0.507 ml CO2g
21
h21) than C. formosanus (0.310 ml CO 2 g
21 h21). Mass scaling of termite V˙
CO2 was investigated by regressing log10V˙CO2 on
log10mass. The overall model combining species gave a mass scaling coefficient of 0.861(±0.0791), which approximates a previously published value for the arthropods as a whole (0.825).2001 Elsevier Science Ltd. All rights reserved.
Keywords:Termites; Respiration; Mass scaling; Movement; CO2release patterns
1. Introduction
Subterranean termites (family Rhinotermitidae) nest underground and forage for cellulosic material at and below the soil surface. The Formosan subterranean ter-mite, Coptotermes formosanus Shiraki, and the Eastern subterranean termite, Reticulitermes flavipes (Kollar), are non-mound-building subterranean termites found in many areas of the Southeastern United States (Kofoid, 1934). Their cryptic nature makes in situ behavioral observations impractical. The same is true for estimates of physiological parameters such as CO2 release
pat-terns, and quantitative measurements of respiration (CO2
release and O2consumption). CO2release patterns ofC.
formosanus and R. flavipes have not previously been
described.
* Corresponding author. Tel.:+1-334-844-2570; fax:+ 1-334-844-5005.
E-mail address:[email protected] (T.G. Shelton).
0022-1910/01/$ - see front matter2001 Elsevier Science Ltd. All rights reserved. PII: S 0 0 2 2 - 1 9 1 0 ( 0 0 ) 0 0 1 1 1 - 6
The discontinuous gas exchange cycle (DGC) is the uncoupling of O2 uptake and CO2 release in tracheate
arthropods (Lighton, 1994). The DGC is a specialized subset of cyclic CO2 release gas exchange patterns in
insects (Lighton, 1994) and can be separated into open (O), resulting in a burst (B) of CO2release, closed (C),
T.G. Shelton, A.G. Appel / Journal of Insect Physiology 47 (2001) 213–224
selective force behind the evolution of the DGC by tra-cheate arthropods (Levy and Schneiderman, 1966; Ligh-ton 1994, 1998). The DGC decreases respiratory water loss by reducing the amount of time spiracles remain open, and one hypothesis is that reduction of water loss is the main selective pressure driving evolution of the DGC (Levy and Schneiderman, 1966; Kestler, 1985; Lighton, 1998). The second hypothesis (Lighton 1994, 1996) assumes that hypercapnic/hypoxic conditions in subterranean burrows has led to the use of the DGC in ants and other insects, and also by convergence in two genera of the Solifugae (Hadley, 1970; Anderson and Ultsch, 1987; Lighton and Garrigan, 1995; Lighton and Fielden, 1996). Hadley and Quinlan (1993) found that in Romalea spp. grasshoppers, water stress resulted in loss of the DGC. The first hypothesis is supported by the work of Williams et al. (1997) withDrosophila mel-anogaster Meigen, in which strains selected for des-iccation resistance exhibited cyclic CO2 release, but not
classical DGC. Because subterranean termites live in hypercapnic and hypoxic, as well as humid, environ-ments (Anderson and Ultsch, 1987), it might be expected that C. formosanus and R. flavipes would exhibit the DGC according to the second hypothesis above.
Little is known about strategies of energy use in ter-mites. Energy use by ectothermic animals for body maintenance is measured as a standard metabolic rate (SMR), defined as the metabolic rate of an individual that is post-absorptive, quiescent, and unstressed at its thermal preferendum (Withers, 1992). The SMR is often measured as O2 consumption or in units of energy (J,
cal, or µW). Whole-colony O2 consumption and CO2
release were examined in several nearctic termites by Wheeler et al. (1996). However, because subcolonies of termites were used (6–150 pseudergates; Wheeler et al., 1996) rather than individuals, no information on the SMR could be derived. Not only was the large number of termites a problem, but movement was not quantified and has certainly confounded their data. Similar prob-lems are found in the recent studies of respiratory quo-tient (RQ) in termites (Nunes et al., 1997). To determine gas exchange rates accurately, methods of CO2 or O2
measurement of unstressed and quiescent individuals at their thermo- and hygropreferendum is necessary.
Allometric mass scaling (the scale at which mass affects physiological rates) of respiratory parameters such as rate of CO2release (V˙CO2) are important in
exam-ining relationships with other animals. Lighton and Fielden (1995) compiled data from numerous studies on mass scalingV˙O2relationships in arthropods. Their
over-all regression of log10V˙O2on log10mass for the compiled
data resulted in a mass scaling coefficient of 0.825. This estimates the relationship between mass of arthropods (in g) and the metabolic rate (inµW) based onV˙O2. Since
O2consumption is directly related to the release of CO2
through the RQ(=V˙CO2/V˙O2; Withers, 1992), assuming no
change with activity, caste, or age, the mass scaling coef-ficient of the regression of V˙CO2on mass is an estimate
of the consumption of O2 by these arthropods as well.
The coefficient (or slope) is equivalent between the log10
relationships of V˙CO2 and V˙O2 with mass, so only the
intercepts differ as RQ differs from 1.0.
The purpose of this study was to examine the CO2
release patterns ofC. formosanusandR. flavipes individ-uals. Real-time movement and CO2 release data were
obtained simultaneously using flow-through respirome-try (see Lighton, 1991a). CO2 release data were used to
test the hypothesis that C. formosanus and R. flavipes
exhibit DGCs, and whether the DGC varies by species, caste or colony. Due to the mobile nature of these ter-mites, the influence of movement on V˙CO2 was
investi-gated. Specifically, data were used to test the hypothesis that movement altered the magnitude ofV˙CO2ofC.
for-mosanusorR. flavipes. There are no data indicating that colony differences (for either species) affect metabolic rate. Since caste members within colonies perform dif-ferent roles for their colonies, they may also differ in metabolic rates (or costs to the colony). In the light of these questions, we also tested the hypotheses that
V˙CO2varies with caste, colony, or species. Mass scaling
ofV˙CO2is reported for each caste, species, and the
over-all scaling for these termites combined.
2. Materials and methods
2.1. Termites
Three colonies ofC. formosanus were obtained from aggregation traps (Tamashiro et al., 1973) in Ft. Lauder-dale, Broward County, Florida, USA. Reticulitermes flavipes were collected from infested wood (Colony A) obtained from a residential area 6.5 km from the Auburn University campus, Auburn, Lee County, Alabama, USA. Colonies B and C were collected from aggregation traps (Tamashiro et al., 1973) on the campus of Auburn University. Colony B termites were obtained from a building perimeter, while Colony C termites were obtained from a wooded area on campus. Colonies B and C were separated by more than 1 km. Pre-reproductive (nymph) caste termites were not available from Colony C, so nymphs from a fourth colony (D) were collected from infested wood at a residence|2 km from the
Aub-urn University campus.
For both species, individuals from each colony were placed into plastic boxes (16 cm×27 cm×6 cm), with sand, and pine wood pieces (2.5 cm×10 cm×5 cm), moistened with 100 ml distilled H2O. Boxes were
main-tained in unlit incubators (|70% RH) at either 28±1°C
215 T.G. Shelton, A.G. Appel / Journal of Insect Physiology 47 (2001) 213–224
that survives best at lower temperatures (22°C) (Smythe and Williams, 1972). Although reared at optimal tem-peratures, these termites are found in nature at a variety of temperatures: C. formosanus ranges from Hawaii to Japan, and the R. flavipes range extends from southern Florida to southern Canada (Kofoid, 1934). Experiments were conducted at ambient laboratory temperatures, well within the temperatures that both termite species encoun-ter in nature.
2.2. Respirometry
Individual workers (undifferentiated pseudergates), soldiers, or nymphs (wing-pad-bearing pre-repro-ductives, when available) were weighed to the nearest 0.01 mg on a digital balance. Body mass, ambient tem-perature, and barometric pressure were recorded prior to placing an individual termite in the respirometry chamber. All respirometry studies were performed at ambient temperature (23.6±0.08°C; x¯±S.E.).
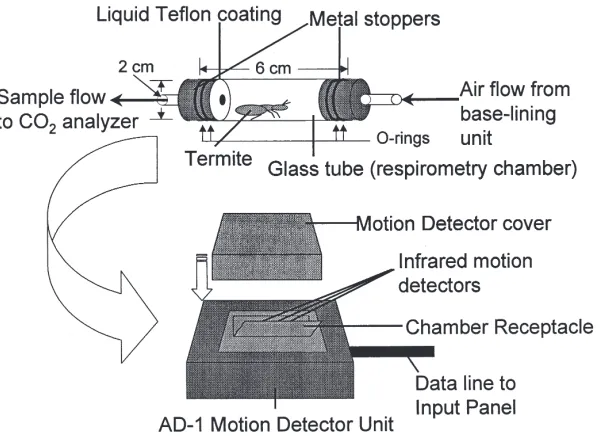
The respirometry chamber consisted of a glass tube (1.8 cm i.d.×6 cm; 15.3 cm3volume) sealed at both ends
with metal stoppers modified to allow air flow through the chamber (Fig. 1). Vacuum grease was used to seal the rubber O-rings on the metal stoppers to the glass tube respirometry chamber. A thin layer of Teflon emul-sion (E. I. Du Pont de Nemours & Co., Wilmington, DE) was applied to the interior surface of the metal stoppers to prevent termites from climbing onto the stoppers, thus keeping the termites in the view field of the movement detector (Fig. 1). This relatively large respirometer was used to minimize escape behaviors due to close con-finement.
Individual termites were sealed within the
respirome-Fig. 1. Schematic of the respirometry chamber used in these experiments. The chamber contained an individual termite and was positioned within the AD-1 motion detector as indicated.
try chamber which was placed in a Sable Systems AD-1 infrared movement detector (Sable Systems, Henderson, NV). The respirometry system was plumbed as follows: compressed air was forced at|431 kPa through a What-man Purge-gas Generator (WhatWhat-man, Inc., Haverhill, MA) that scrubbed the air of CO2 and H2O, and into a
large (170 l) mixing tank. Air flowed into a second, smaller (25 l) pressure manifold, from which air was drawn into the computer-controlled base-lining unit of a Sable Systems TR-3 respirometry system (Sable Sys-tems, Henderson, NV), with tubing to and from the respirometry chamber held in the AD-1 motion detector. Air from the chamber containing the experimental ani-mal was drawn at 50 ml min21
into a CO2analyzer
(Li-6262; Li-Cor Inc., Lincoln, NE; in absolute mode), and through a mass-flow controller (Sierra Instruments, Inc., Monterey, CA) with a vacuum pump (Gast Mfg. Corp., Benton Harbor, MI).
The system equilibrated for 5 min prior to base-lining and recording. At the start of each recording, the base-lining unit was set to automatically by-pass the chamber containing the termite and record an initial base-line measurement. The air was diverted back into the respiro-metry chamber containing the termite, equilibrated for 5 min, and 1 h of CO2 release and movement recorded.
After 1 h, a final baseline reading was taken as described above. For each species,V˙CO2and movement of a
mini-mum of nine individuals of each caste from each colony were recorded individually. All recordings were recorded and analyzed using Datacan V (version 5.2; Sable Systems, Henderson, NV). Datacan V software was used to convert CO2 release data to standard
tem-perature and pressure prior to analysis.
T.G. Shelton, A.G. Appel / Journal of Insect Physiology 47 (2001) 213–224
reduced the volume of the respirometry chamber from 15.3 to 0.5 cm3 (by using a smaller chamber) and
increased the flow rate from 50 to 100 ml min21
(see Williams et al., 1997). This design increased resolution (by reducing the time for CO2turnover within the
respir-ometry chamber) about 60-fold, but also increased per-iods of activity. We used soldiers and workers (five each) of both termite species (colony 2 for C. formos-anus and colony C for R. flavipes). We also examined the effects of low temperature (15°C) during extended (3 h) recordings to determine if reduced temperature could induce the DGC in workers and soldiers (six each) of both species.
2.3. Analysis of CO2 release patterns
The pattern of CO2 release (ml h 21
) over time was examined for each recording. All traces were examined for evidence of DGC events. Periods when CO2 release
dropped to about 0, along with peaks of CO2 at defined
intervals (see Lighton, 1994), were our criteria for the presence of the DGC.
2.4. Observation of movement under respirometry chamber conditions
To determine type and intensity of activity of termites held within respirometry chambers, individuals (six workers and six soldiers of each species) were recorded on video. Animals were placed into 15.3 cm3
respirome-try chambers (see above), through which dry, CO2-free
air was drawn at 50 ml min21
. Chambers were incubated at 24±1°C, and illuminated with a red 4-W light bulb at 14 cm from the chamber. Behavior of each termite was recorded for 1.5 h using a compact VHS (VHS-C, JVC model GR-AX70, Victor company of Japan, Yokohama, Japan) video camera. Videotapes were examined and transcribed to record behaviors and speed of movement of each termite. Termite speeds were compared using a Mann–Whitney test for each caste by species (Minitab, 1994).
2.5. Analysis of movement effects
CO2 release data were converted to ml CO2h 21, and
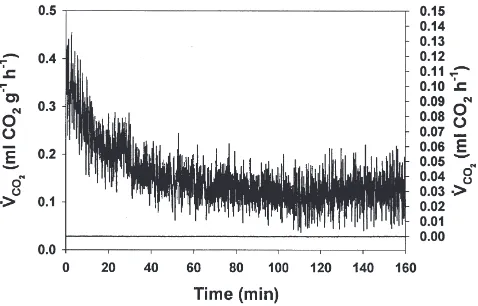
offset (by 28 s) to adjust for the time lag between the activity detector and CO2 analyzer so that the CO2data
corresponded directly to movement. Examination of 3-h recordings demonstrated t3-hat t3-here is a calmdown per-iod of about 40 min before CO2 release reaches a steady
state (Fig. 2). To quantify the presence of a calmdown period, linear regression of log10-transformed CO2
release (in ml CO2 h
21) data (on time in min) over the
0–45 min interval of each recording was performed. Per-centages of those recordings with a significant negative slope of CO2release over this interval appear in Table 1.
Fig. 2. CO2release data recorded from a singleR. flavipesworker (mass=0.00279 g; upper trace; lefty-axis). CO2release data recorded from an empty chamber (lower trace; right y-axis). In both traces, chamber volume is 15.3 ml and flow rate is 50 ml min21.
To avoid overestimation ofV˙CO2 values, only the mean
CO2 release rates (ml CO2 g
21 h21) of the last 15 min
(i.e. 45–60 min) of each recording were used to estimate CO2 release rate, and in all V˙CO2 comparisons below.
Activity scores were calculated as a proportion: num-ber of seconds of movement divided by total numnum-ber of seconds in the final 15 min section of each recording (as %). Each species was analyzed separately. The effect of movement on V˙CO2 was examined using linear
regression. Residuals of the mass scaling relationship (see below) were regressed on activity scores. Using residuals of the mass scaling relationship, the effects of mass onV˙CO2were removed, resulting in a relationship
betweenV˙CO2and duration of activity. Pairedt-tests were
also used to compare activity between the first 45-min and the last 15-min intervals (Minitab, 1994). This analysis tested the hypothesis that the calmdown period is a function of movement duration.
2.6. Analysis of V˙CO
2values
Mass-specificV˙CO2values for all individuals (µl CO2
g21 h21) were analyzed with a nested analysis of
vari-ance (ANOVA; SAS Institute, 1985) to test for signifi-cance of main effects (caste, colony, species) and all rel-evant interactions. Comparisons between castes within species were compared via contrasts (SAS Institute, 1985). Values are reported as x¯±S.E.
2.7. Analysis of mass scaling effects
For mass scaling effects, log10V˙CO2(ml CO2h
21) data
were regressed on log10mass (g). Outliers over 2
217 T.G. Shelton, A.G. Appel / Journal of Insect Physiology 47 (2001) 213–224
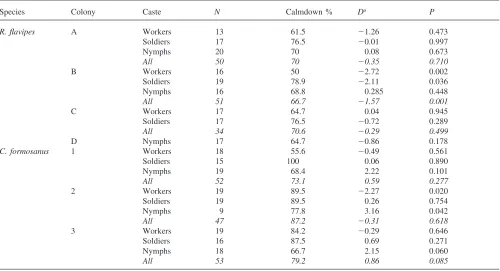
Table 1
Percentage of recordings showing a calmdown period in CO2release over 0–45 min. Pairedt-test results [Difference (D) andP-values] of 0–45 min activity percentages vs. 45–60 min
Species Colony Caste N Calmdown % Da P
R. flavipes A Workers 13 61.5 21.26 0.473
Soldiers 17 76.5 20.01 0.997
Nymphs 20 70 0.08 0.673
All 50 70 20.35 0.710
B Workers 16 50 22.72 0.002
Soldiers 19 78.9 22.11 0.036
Nymphs 16 68.8 0.285 0.448
All 51 66.7 21.57 0.001
C Workers 17 64.7 0.04 0.945
Soldiers 17 76.5 20.72 0.289
All 34 70.6 20.29 0.499
D Nymphs 17 64.7 20.86 0.178
C. formosanus 1 Workers 18 55.6 20.49 0.561
Soldiers 15 100 0.06 0.890
Nymphs 19 68.4 2.22 0.101
All 52 73.1 0.59 0.277
2 Workers 19 89.5 22.27 0.020
Soldiers 19 89.5 0.26 0.754
Nymphs 9 77.8 3.16 0.042
All 47 87.2 20.31 0.618
3 Workers 19 84.2 20.29 0.646
Soldiers 16 87.5 0.69 0.271
Nymphs 18 66.7 2.15 0.060
All 53 79.2 0.86 0.085
aD=x¯ activity score0
−452x¯ activity score45−60
also examined with analysis of covariance (ANCOVA; SAS Institute, 1985) to determine the significance of species on the combined regression. To compare with Lighton and Fielden’s (1995) mass scaling of metabolic rates of the arthropods as a whole, we converted V˙CO2
(ml CO2h
21) to metabolic rate (µW) using their
assump-tions: Q10of 2.5 and RQ of 0.72 (Lighton and Fielden,
1995; Lighton, 1991a). Data were analyzed with ANCOVA to estimate the relationship between log10µW
and log10mass for C. formosanus and R. flavipes, and
to compare this relationship with the same relationship for other arthropods (Lighton and Fielden, 1995).
3. Results
3.1. CO2 release patterns
There was no evidence of the DGC (as a specialized class of cyclic CO2release) in any of the 344 recordings
examined, regardless of caste, colony or species. An illustration of a typical recording is shown in Fig. 2. The 20 traces using 60-fold greater resolution likewise did not show evidence of DGC events (Fig. 3). CO2release
never dropped to near base-line levels in any of the traces, and showed no evidence of DGC periods (B, F, or C). CO2release patterns of both workers and soldiers
Fig. 3. Increased resolution CO2release sample trace recorded from anR. flavipesworker (mass=0.00330 g). Chamber volume is 0.5 ml and flow rate is 100 ml min21.
of both species at 15°C, and in 3 h recordings at ambient temperatures, showed no indication of DGC phases.
3.2. Direct observations of movement
T.G. Shelton, A.G. Appel / Journal of Insect Physiology 47 (2001) 213–224
R. flavipes workers: 9.2±0.65 (range 7.5–12) cm min21
; soldiers: 7.0±0.57 (range 5.45–8.6) cm min21
] over the course of the recordings. Both workers and soldiers of
C. formosanus moved at a faster rate than R. flavipes
(workers: W=21.5, P=0.0094; soldiers: W=21.0,
P=0.0043). Termites did pause briefly (range 0:05–5:49 min duration), moving only antennae, but resumed movement in all cases. Thus intensity of movement dur-ing these video recorddur-ings was constant. No abdominal pumping was observed in either caste of either species.
3.3. Effects of movement on CO2 release
There was no relationship between V˙CO2 and activity
for either species when residuals of the mass scaling relationship were regressed on activity score (C. formos-anus: df=1,143; F=1.46; r2=0.01; P=0.229; R. flavipes:
df=1,141; F=1.48, r2=0.01, P=0.226). Percentages of
recordings showing a significantly negative interaction between time and V˙CO
2 over the first 45-min interval
ranged from 50 (R. flavipes colony B workers) to 100% (C. formosanus colony 1 soldiers; Table 1). Durations of movement during the 0–45-min and 45–60-min per-iods were not significantly different for all but one col-ony, in which the activity duration was greater during the 45–60-min interval (Table 1).
3.4. Caste, colony, and species effects on CO2 release
Nested ANOVA of theV˙CO2data resulted in only one
significant main effect. Colony and caste main effects were not significant, but species (df=1, 4.60; F=13.76;
P=0.0161) were significantly different.Coptotermes for-mosanus (all castes combined) V˙CO2 (0.310±0.011 ml
CO2 g
21 h21) was significantly lower than R. flavipes
(0.507±0.014 ml CO2 g
21 h21). Interactions were not
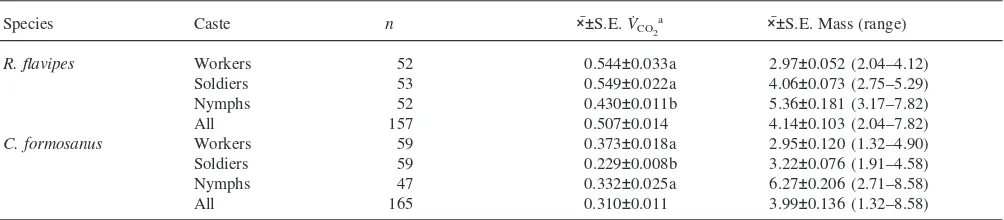
significant. V˙CO2 ranged from 0.229±0.008 ml CO2 g 21
h21 for C. formosanus soldiers to 0.549±0.022 ml CO 2
g21h21forR. flavipessoldiers (Table 2). Contrast
com-parisons of caste by species revealed thatC. formosanus
soldiers released CO2at a significantly lower rate thanC. formosanus workers and nymphs (Table 2). R. flavipes
Table 2
Mean±S.E. ofV˙CO
2(ml CO2g
21h21) and mass (in mg) of all castes by species ofR. flavipesandC. formosanus
Species Caste n ׯ±S.E.V˙CO2
a ׯ±S.E. Mass (range)
R. flavipes Workers 52 0.544±0.033a 2.97±0.052 (2.04–4.12)
Soldiers 53 0.549±0.022a 4.06±0.073 (2.75–5.29)
Nymphs 52 0.430±0.011b 5.36±0.181 (3.17–7.82)
All 157 0.507±0.014 4.14±0.103 (2.04–7.82)
C. formosanus Workers 59 0.373±0.018a 2.95±0.120 (1.32–4.90)
Soldiers 59 0.229±0.008b 3.22±0.076 (1.91–4.58)
Nymphs 47 0.332±0.025a 6.27±0.206 (2.71–8.58)
All 165 0.310±0.011 3.99±0.136 (1.32–8.58)
aMeans followed by the same letter (within species) are not significantly different at thea=0.05 level, as determined by contrasts.
nymphs released CO2 at a significantly lower rate than R. flavipes workers and soldiers (Table 2).
3.5. Mass loss and termite condition after respirometry
Because they are soft bodied, termites are one of the few insects for which dehydration is readily observable. Dehydrated animals have a sunken, flattened abdomen. Termites removed from the respirometer were not noticeably dehydrated. Mean mass lost for each species during the trials, which is assumed to be water loss, was 6.55±0.40% for C. formosanus and 9.56±0.66% for R. flavipes.
3.6. Mass scaling of V˙CO2in C. formosanus and R.
flavipes
Regressions of log10V˙CO2on log10mass for each caste
within species resulted in four significant (P,0.008)
mass scaling effect models, workers [21.64(±0.345) M0.537(±0.135) (df=1, 58; F=15.82; r2=0.22; P=0.0002)],
and soldiers of C. formosanus [21.29(±0.412) M0.738(±0.165) (df=1, 55; F=20.07; r2=0.27; P=0.0001)],
soldiers [20.643(±0.735) M0.848(±0.307) (df=1, 52; F=7.64; r2=0.13; P=0.0079)] and nymphs
[21.17(±0.220) M0.650(±0.096) (df=1, 51; F=45.63; r2=0.48; P=0.0001)] of R. flavipes (M is body mass in
g). For individual caste models, no mass range was more than 5.87 mg (Table 3). Regressions using each species with combined castes resulted in significant models (P=0.0001 for both species), with mass ranges of 7.26 and 5.78 mg forC. formosanusandR. flavipes, respect-ively (Table 3). The overall model for combined species was also significant (P=0.0001), resulting in a mass sca-ling coefficient of 0.832(±0.069) (Table 3). The regression of log10V˙CO2on log10mass combining castes
for each species resulted in mass scaling coefficients of 0.759(±0.070) and 0.715 (±0.098) forC. formosanusand
219
T.G.
Shelton,
A.G.
Appel
/
Journal
of
Insect
Physiology
47
(2001)
213–224
Table 3
Results of log10V˙CO2(ml CO2h
21; from steady-state section only) regression on log
10mass for each species (castes combined), caste within species, and both species combined
Mass (mg)
Species Caste n ׯ±S.E. (Range) Slope±S.E. Intercept±S.E. Pa r2
R. flavipes Worker 47 2.98±0.05 (2.04–4.12) 0.486±0.580 21.61±1.47 0.4065 0.0150
Soldier 52 4.06±0.07 (2.75–5.29) 0.848±0.307 20.643±0.735 0.0079 0.1303
Nymph 51 5.37±0.18 (3.17–7.82) 0.650±0.0962 21.17±0.220 0.0001 0.4771
All 150 4.16±0.10 (2.04–7.82) 0.715±0.098 21.00±0.235 0.0001 0.2615
C. formosanus Worker 58 2.95±0.12 (1.32–4.90) 0.537±0.135 21.64±0.345 0.0002 0.2173
Soldier 55 3.24±0.08 (1.91–4.58) 0.738±0.165 21.29±0.412 0.0001 0.2710
Nymph 45 6.22±0.21 (2.71–8.58) 20.186±0.154 23.14±0.343 0.2347 0.0319
All 158 3.99±0.14 (1.32–8.58) 0.759±0.0703 21.13±0.172 0.0001 0.4230
Both species All 308 4.07±0.09 (1.32–8.58) 0.832±0.0686 20.837±0.166 0.0001 0.3207
a P-values are reported for ANOVA test of H
T.G. Shelton, A.G. Appel / Journal of Insect Physiology 47 (2001) 213–224
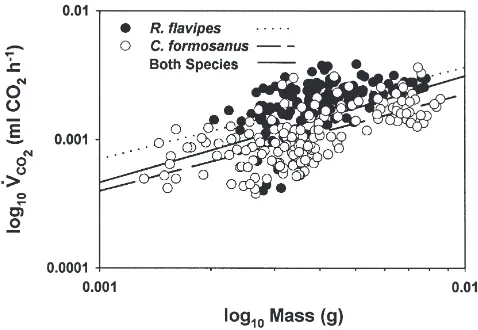
Fig. 4. Plot ofV˙CO2data (from steady state trace sections only) for
all castes ofR. flavipesandC. formosanus(combining castes). Individ-ual regression models are drawn for each species as well as both spec-ies combined.
(df=1; F,0.13; P=0.7236). ANCOVA comparison of
our data to those of Lighton and Fielden (1995) demon-strated no significant difference (df=1; F=0.19;
P=0.6616) between metabolic rate and termite body mass model and that of the arthropods as a whole. MR53.157(60.192)M0.861(±0.079) (1)
Eq. (1) models the relationship between the metabolic rate (MR) of R. flavipes and C. formosanus and body mass (M), where MR is metabolic rate in µW at 25°C (Q10=2.5) assuming an RQ of 0.72 (Lighton and Fielden,
1995), and Mis mass in grams.
4. Discussion
Our data demonstrate the lack of DGC by any caste of either C. formosanus or R. flavipes. Acyclic CO2
release by the termites in this study may be a result of their individual confinement in a dry, CO2-free
environ-ment; however, these same experimental conditions have been used to positively identify the DGC in other social (Lighton 1988a, 1990; Lighton and Wehner, 1993; Ligh-ton et al., 1993b; Vogt and Appel, 2000) and solitary arthropods (Lighton, 1988b; Lighton, 1991b; Lighton et al., 1993a; Duncan and Lighton, 1997; Appel, pers. commun.). Direct behavioral observations showed that
C. formosanus and R. flavipes do not reach a state of rest, instead they move at a nearly continuous steady pace, pausing only for short periods of time. Thus, movement by these animals varies in duration rather than intensity in respirometry conditions. Active ventilation, i.e. pumping of the abdomen, was not observed in the video recordings.
The hypotheses proposed for DGC evolution by arthropods have been, first, to reduce respiratory water loss, and second, to adapt to hypercapnic/hypoxic
environments (Levy and Schneiderman, 1966; Lighton, 1998). The subterranean nests of C. formosanus andR. flavipesare maintained at relatively high humidities (16– 67%; Sponsler and Appel, 1990), as are the foraging tun-nels. Grube and Rudolph (1999a,b) have shown that R. santonensis De Feytaud exhibit social humidity control in their subterranean environments. Cuticular per-meabilities of these termites range from 15.22 to 42.53
µg cm22h21 mmHg21 forC. formosanus, and 27.83 to
34.57 µg cm22 h21 mmHg21 for R. flavipes (Sponsler
and Appel, 1990). These values are similar to other arthropods living in mesic environments (Hadley, 1994), although the value forC. formosanussoldiers (15.22µg cm22
h21
mmHg21
) is closer to that expected of a xerically adapted arthropod (Sponsler and Appel, 1990). Because these termite species live and forage in high humidity environments, there is probably little selective advantage to the DGC for limiting respiratory water loss. The second hypothesized driving force for DGC evol-ution is increased tracheal exchange in hypercapnic/hypoxic conditions (Lighton 1994, 1998). Anderson and Ultsch (1987) found that subterranean ter-mites live and forage in hypercapnic (6–8% CO2)/hypoxic (12–14% O2) environments. Therefore,
these insects might be expected to exhibit DGC CO2
release patterns. However, our data clearly show that these species do not exhibit DGC at ambient tempera-tures and cannot be induced to DGC at low temperature or after extended equilibration periods. Lighton (1994) discussed the requirements necessary for an arthropod to be capable of DGC or cyclic CO2 release. Of these
requirements, foremost is the ability to open and close spiracles in a controlled manner. It is not known if C.
formosanus and R. flavipes workers and nymphs are
morphologically capable of spiracular control of venti-lation.
A number of possibilities exist that may explain the lack of DGC in C. formosanus and R. flavipes. The worker, soldier and nymph castes of subterranean ter-mites are weakly sclerotized, and are not terminally dif-ferentiated (i.e. not adults). This low level of sclerotiz-ation may allow for cutaneous CO2 release which might
mask the presence of DGC. A high rate of CO2 release
from the cuticle should show smaller respiratory CO2
221 T.G. Shelton, A.G. Appel / Journal of Insect Physiology 47 (2001) 213–224
Coptotermes formosanus andR. flavipes moved almost
continuously in the respirometry chamber. Acyclic CO2
release observed here may be the result of nearly con-tinuous activity, as in autoventilation (Kestler 1971, 1991). However, DGC ventilation patterns have been measured in ants exhibiting low levels of activity (Lighton and Feener, 1989; Lighton 1988a, 1990; Ligh-ton and Wehner, 1993).
The presence of DGC patterns can vary with circadian patterns and physiological conditions. Hadley and Quin-lan (1993) found that Romalea guttata Serville grass-hoppers did not exhibit DGC events during a normal diurnal activity cycle, but only exhibited DGC when the animals were engaged in nocturnal ‘roosting’ behavior. The authors also noted that DGC cycling deteriorated in dehydrated R. guttata (Hadley and Quinlan, 1993). Sponsler and Appel (1990) estimated that 50% water loss in these two species resulted in death. While water loss values for our data (6–9%) do not approach a fatal value, it is not known what, if any, effect sublethal dehy-dration has on gas exchange strategies for these termites. The recordings of bothC. formosanusandR. flavipesin this study were conducted between 08:00 and 19:00 hr, and do not address the possibility for periodicity of DGC events.
Direct observation of termite behavior in the respiro-metry chamber demonstrated that intensity of movement does not change, leaving only duration of movement to have a potential influence on V˙CO2 in these species. No
interaction was found between the residuals of the mass scaling relationship ofV˙CO2and the activity scores from
steady state sections of the recordings in either species. This result suggests that duration of activity does not influence V˙CO2 in C. formosanus and R. flavipes when
the effects of mass are removed from the analysis. There were no differences in V˙CO2 between colonies
of both C. formosanusand R. flavipes. As a result, col-ony data (within species) were combined for mass sca-ling modesca-ling and V˙CO2 results in Table 2. Lack of a
colony effect in our V˙CO2 comparisons allows future
authors to avoid the complications of using multiple col-onies of C. formosanusand R. flavipes in comparisons involving V˙CO2. This is not surprising, as basic
physio-logical parameters should vary on a species, rather than a colony, basis. There was a significant difference in CO2 release between the two species; R. flavipes
pro-duced CO2at a rate about 1.5-times greater thanC. for-mosanus. The differences in metabolic rate allow for cal-culation of possible differences in energy expenditure between these species.
Both of these termites are xylophagous (Kofoid, 1934), and have a nearly infinite food source (Waller and LaFage, 1987), particularly where fallen timber is plentiful. To better understand energy use by termites, differences between solitary and social insects must be considered. For solitary animals, each individual has to
budget its time and energy into a variety of activities, including defense, reproduction, nest construction, and foraging. A solitary animal that is more efficient (i.e. using less energy to perform the same amount of work) than another in terms of energy use has a great advan-tage: it can spend less time foraging (and feeding) than its competitor. This allows the efficient animal more time to spend on the other activities described above and potentially reduces the risk of predation (Krebs and Dav-ies, 1993).
Activity of eusocial animals must be examined on a colony rather than an individual basis (Krebs and Dav-ies, 1993; Sudd and Franks, 1987). In termites, most major activities are allocated among the different castes. Castes include reproductives, soldiers (defense), and workers who perform all other duties (nest and tunnel construction, foraging and food transfer, egg care, waste removal; Kofoid, 1934). The advantage that worker ter-mites have over solitary animals is the tremendous num-ber of individuals in a given colony (Sudd and Franks, 1987). While there are a variety of tasks to be completed, there are a number of termites that can complete the tasks simultaneously (Kofoid, 1934; see Sudd and Franks, 1987).
Social animals, such as termites, can benefit from being more individually energy efficient (i.e. use less energy for basic maintenance) by allocating more energy into other tasks, such as reproduction, soldier production, and nest construction, than less efficient competitors. Termites that live either in (drywood termites) or near (subterranean termites) their food source (Kofoid, 1934) can forage almost continually (Stuart, 1967; Thorne, 1982). Because food is not a limiting factor (Waller and LaFage, 1987), there appears to be a continuous flow of energy into the colony. If total energy budgets and conversion efficiencies for all species in a comparison are the same, then excess energy should be available to the species with the lower metabolic rate; the only ques-tion is how this surplus energy is used.
Comparisons between C. formosanus and R. flavipes
have been reported in a number of studies.Coptotermes formosanus are far more numerous (per colony; Grace, 1992), maintain much greater soldier proportions (10– 20% forC. formosanus, 8–10% forR. flavipes; Haverty, 1977), have larger foraging areas [per colony; 3571 m2
for C. formosanus (Su and Scheffrahn, 1988) and 1091 m2forR. flavipes(a ratio of 3.27:1; Grace et al., 1989)],
and interestingly have greater foraging rates (per termite; a ratio of 1.65:1, Delaplane and LaFage, 1990; see also Smythe and Carter, 1970; Grace, 1992) thanR. flavipes. These are not predictions based on their lower metabolic rates, but known values for the two species. Our data show thatC. formosanushas a lower metabolic rate than
R. flavipes. Using our data and Lighton and Fielden’s (1995) assumptions (Q10=2.5, RQ=0.72), the mean
T.G. Shelton, A.G. Appel / Journal of Insect Physiology 47 (2001) 213–224
17.62±0.48 µW for R. flavipes (a ratio of 1.70:1). Our behavioral data show that C. formosanus moves faster than R. flavipes (1.78:1 ratio) under respirometry con-ditions. The differences in the metabolic rates forC. for-mosanusandR. flavipessuggest thatC. formosanusmay be a more energy efficient species, and may be able to convert more energy in the colony into increases in defense, reproduction, etc., as outlined above.
Mean metabolic rates for these two species differ by
|7µW. A number of possibilities may explain this
dif-ference in metabolic rate. Although movement was tracked during these experiments, perhaps R. flavipes
individuals were more stressed (Kestler, 1991) and did not increase movement, but increased V˙CO2. However,
the direct behavioral observations contradict this idea, as termites continued to move even after steady state for
V˙CO2was reached. Potential differences between species
in terms of metabolically active tissue may also affect
V˙CO2. Workers of both genera are morphologically
simi-lar, while soldier caste individuals of C. formosanus
have a defensive secretion reservoir not found inR. flav-ipessoldiers (Quennedey and Deligne, 1975). This reser-voir increases the proportion of non-metabolizing tissue in soldiers of C. formosanus, but not for workers, nor any caste ofR. flavipes. MeanV˙CO2values forC. formos-anussoldiers are lowest of all castes and species exam-ined (Table 2). Lipid content, tracheal system and/or ali-mentary canal sizes may differ between these species, which could also alter the proportion of metabolically active tissue between these species, thus affectingV˙CO2.
Models relatingV˙CO2and termite body mass explained
between 22.8 and 42.6% of the variation inV˙CO2(Table
3). Mass ranges among castes were small and never exceeded an order of magnitude (Table 3). Small mass ranges resulted in limited predictions and probably the lack of significant mass scaling coefficients for most regressions (Table 3). The relatively narrow mass ranges may also help to explain the lack of a significant caste by species interaction forV˙CO2values. For both species,
individuals of all castes occur over a nearly continuous mass range (Table 3). If the castes within a species scale
V˙CO2with mass equivalently, then when the mass effect
is removed (i.e. conversion ofV˙CO2to ml CO2g
21h21),
there should be no differences among them. This would also indicate that ratios of actively respiring tissue among castes within species were relatively equivalent. Our data suggest that for C. formosanus soldiers (defensive secretion reservoirs) and R. flavipes nymphs (fat tissue for flight and initial nest construction metabolism), there is a reduction in actively respiring tissue ratios compared with the other castes in each spec-ies.
Lighton and Fielden (1995) presented an equation illustrating the mass scaling of a number of arthropods. Their consensus mass scaling coefficient for the arthro-pods (not including the Ixodida) was 0.825±0.034. In the
combined species plot of log10V˙CO2on log10mass (Fig.
4), the overall coefficient of mass scaling forC. formos-anusand R. flavipesis 0.832±0.0686.
Some social insects may pose problems for the deter-mination of the SMR as defined by Withers (1992); one of these problems is movement. Our data indicate that movement of various castes of C. formosanus and R. flavipesdoes not influence CO2 release. Mass scaling of V˙CO2for these species does not significantly differ from
that of other arthropods (Lighton and Fielden, 1995). It is expected that mass scaling of metabolic rate during periods of inactivity of C. formosanus and R. flavipes
would have a lower intercept, but the same slope as our model.
Our data indicate that near-continuous movement in these species is the ‘normal’ state of affairs. Speakman et al. (1993) discuss the consideration of the realistic behavior of animals in relation to measuring metabolic rates. They suggest that methods for measuring meta-bolic rates should reflect the ‘normal’ activity level of the animals studied. Our data have shown that even dur-ing steady state CO2release, these animals do not cease
their movement. While this may be the ‘normal’ state of affairs for these species, the metabolic rates reported here can only be considered active metabolic rate (AMR). However, AMR may approximate SMR for species that do not normally cease movement (Speakman et al., 1993).
Our data indicate that body mass scaling of subter-ranean termite metabolic rates can be represented by a model that is not significantly different from that of arthropods as a whole. Additional work is needed in defining the SMR for these termites, as well as investi-gations into the presence of the DGC within the other major families of the Isoptera.
Acknowledgements
We thank Lane M. Smith II and Mark West for stat-istical advice. We are grateful to Brian T. Forschler, Nannan Liu, Mary T. Mendonc¸a, Faith M. Oi, J.T. Vogt, Barbara Joos, and three anonymous reviewers for helpful comments and suggestions on early versions of this manuscript. We also thank Marla J. Tanley for expert technical assistance during this study. The help of Nan-Yao Su and Paul M. Ban in providing C. formosanus
for this study is greatly appreciated.
References
Anderson, J.F., Ultsch, G.R., 1987. Respiratory gas concentrations in the microhabitats of some Florida arthropods. Comparative Bio-chemistry and Physiology 88A, 585–588.
223 T.G. Shelton, A.G. Appel / Journal of Insect Physiology 47 (2001) 213–224
Delaplane, K.S., LaFage, J.P., 1990. Wood excavations of three species of subterranean termites. Entomologia Experimentalis et Applicata 54, 81–87.
Duncan, F.D., Lighton, J.R.B., 1997. Discontinuous ventilation and energetics of locomotion in the desert-dwelling female mutillid wasp Dasymutilla gloriosa. Physiological Entomology 22, 310– 315.
Glantz, S.A., Slinker, B.K., 1990. Primer of Applied Regression and Analysis of Variance. McGraw-Hill, New York.
Grace, J.K., 1992. Termite distribution, colony size, and potential for damage. In: Robinson, W.H. (Ed.), Proceedings of the National Conference on Urban Entomology, College Park, MD, pp. 67–76. Grace, J.K., Abdallay, A., Farr, K.R., 1989. Eastern subterranean ter-mite (Isoptera: Rhinotermitidae) foraging territories and popu-lations in Toronto. Canadian Entomologist 121, 551–556. Grube, S., Rudolph, D., 1999a. Water supply during building activities
in the subterranean termiteReticulitermes santonensisDe Feytaud (Isoptera Rhinotermitidae). Insectes Sociaux 46, 192–193. Grube, S., Rudolph, D., 1999b. The labial gland reservoirs (water sacs)
inReticulitermes santonensis (Isoptera: Rhinotermitidae): studies of the functional aspects during microclimatic moisture regulation and individual water balance. Sociobiology 33, 307–323. Hadley, N.F., 1970. Micrometeorology and energy exchange in two
desert arthropods. Ecology 51, 434–444.
Hadley, N.F., 1994. Water Relations of Terrestrial Arthropods. Aca-demic Press, San Diego, CA.
Hadley, N.F., Quinlan, M.C., 1993. Discontinuous carbon dioxide release in the Eastern lubber grasshopperRomalea guttataand its effect on respiratory transpiration. Journal of Experimental Biology 177, 169–180.
Haverty, M.I., 1977. The proportion of soldiers in termite colonies: a list and bibliography (Isoptera). Sociobiology 2, 199–216. Kestler, P., 1971. Die diskontinuierliche Ventilation bei Periplaneta
americana L. und anderen Insekten. Thesis, Julius-Maximilians-Universita¨t, Wu¨rzburg.
Kestler, P., 1985. Respiration and respiratory water loss. In: Hoffman, K.H. (Ed.), Environmental Physiology and Biochemistry of Insects. Springer-Verlag, Berlin, pp. 137–183.
Kestler, P., 1991. Cyclic CO2release as a physiological stress indicator in insects. Comparative Biochemistry and Physiology 100C, 207–211.
Kofoid, C.A., 1934. Termites and Termite Control. University of Cali-fornia Press, Berkeley, CA.
Krebs, J.R., Davies, N.B., 1993. An Introduction to Behavioral Ecol-ogy. Blackwell Scientific Publications, Oxford, 482pp.
Levy, R.I., Schneiderman, H.A., 1966. Discontinuous respiration in insects—II. the direct measurement and significance of changes in tracheal gas composition during the life cycle of silkworm pupae. Journal of Insect Physiology 12, 83–104.
Lighton, J.R.B., 1988a. Discontinuous CO2emission in a small insect, the Formicine ant Camponotus vicinus. Journal of Experimental Biology 134, 363–376.
Lighton, J.R.B., 1988b. Simultaneous measurement of oxygen uptake and carbon dioxide emission during discontinuous ventilation in the tok-tok beetle, Psammodes striatus. Journal of Insect Physi-ology 34, 361–367.
Lighton, J.R.B., Feener, D.H., 1989. A comparison of energetics and ventilation of desert ants during voluntary and forced locomotion. Nature 342, 174–175.
Lighton, J.R.B., 1990. Slow discontinuous ventilation in the Namib dune-sea ant Camponotus detritus (Hymenoptera Formicidae). Journal of Experimental Biology 151, 71–82.
Lighton, J.R.B., 1991a. Insects: measurements. In: Payne, P.A. (Ed.), Concise Encyclopedia of Biological and Biomedical Measurement Systems. Pergamon Press, Oxford, pp. 201–208.
Lighton, J.R.B., 1991b. Ventilation in Namib desert tenebrionid
beetles: mass scaling and evidence of a novel quantized flutter-phase. Journal of Experimental Biology 159, 249–268.
Lighton, J.R.B., 1994. Discontinuous ventilation in terrestrial insects. Physiological Zoology 67, 142–162.
Lighton, J.R.B., 1996. Discontinuous gas exchange in insects. Annual Review of Entomology 41, 309–324.
Lighton, J.R.B., 1998. Notes from underground: towards ultimate hypotheses of cyclic, discontinuous gas-exchange in tracheate arthropods. American Zoologist 38, 483–491.
Lighton, J.R.B., Wehner, R., 1993. Ventilation and respiratory metab-olism in the thermophilic desert ant, Cataglyphis bicolor
(Hymenoptera Formicidae). Journal of Comparative Physiology B 163, 11–17.
Lighton, J.R.B., Fielden, L.J., Rechav, Y., 1993a. Discontinuous venti-lation in a non-insect, the tick Amblyomma marmoreum (Acari, Ixodidae): characterization and metabolic modulation. Journal of Experimental Biology 180, 229–245.
Lighton, J.R.B., Fukushi, T., Wehner, R., 1993b. Ventilation in Catag-lyphis bicolor: regulation of carbon dioxide release from the tho-racic and abdominal spiracles. Journal of Insect Physiology 39, 687–699.
Lighton, J.R.B., Fielden, L.J., 1995. Mass scaling of standard metab-olism in ticks: a valid case of low metabolic rates in sit-and-wait strategists. Physiological Zoology 68, 43–62.
Lighton, J.R.B., Fielden, L.J., 1996. Gas exchange in wind spiders (Arachnida, Solphugidae): independent evolution of convergent control strategies in solphugids and insects. Journal of Insect Physi-ology 42, 347–357.
Lighton, J.R.B., Garrigan, D., 1995. Ant breathing: testing regulation and mechanism hypotheses with hypoxia. Journal of Experimental Biology 198, 1613–1620.
Minitab, INC., 1994. Minitab Reference Manual: Release 10 for Win-dows. Minitab Publications, State College, PA.
Nunes, L., Bignell, D.E., Lo, N., Eggleton, P., 1997. On the respiratory quotient (RQ) of termite (Insecta: Isoptera). Journal of Insect Physi-ology 43, 749–758.
Quennedey, A., Deligne, J., 1975. L’arme frontale des soldats de ter-mites. I. Rhinotermitidae. Insectes Sociaux 22, 243–267. SAS Institute, INC., 1985. SAS User’s Guide: Statistics. SAS Institute,
Inc, Cary, NC.
Schneiderman, H.A., 1960. Discontinuous respiration in insects: role of the spiracles. Biological Bulletin of Woods Hole Institute 119, 494–528.
Schneiderman, H.A., Williams, C.M., 1955. An experimental analysis of the discontinuous respiration of the Cecropia silkworm. Biologi-cal Bulletin of Woods Hole Institute 109, 123–143.
Smythe, R.V., Carter, F.L., 1970. Feeding responses to sound wood by
Coptotermes formosanus,Reticulitermes flavipes, andR. virginicus
(Isoptera: Rhinotermitidae). Annals of the Entomological Society of America 63, 841–847.
Smythe, R.V., Williams, L.H., 1972. Feeding and survival of two sub-terranean termite species at constant temperatures. Annals of the Entomological Society of America 65, 226–229.
Speakman, J.R., McDevitt, R.M., Cole, K.R., 1993. Measurement of basal metabolic rates: don’t lose sight of reality in the quest for comparability. Physiological Zoology 66, 1045–1049.
Sponsler, R.C., Appel, A.G., 1990. Aspects of water relations of the Formosan and Eastern subterranean termites (Isoptera: Rhinotermitidae). Environmental Entomology 19, 15–20. Stuart, A.M., 1967. Alarm, defense, and construction behavior
relation-ships in termites (Isoptera). Science 156, 1123–1125.
Su, N.-Y., Scheffrahn, R.H., 1988. Foraging population and territory of the Formosan subterranean termite (Isoptera: Rhinotermitidae) in an urban environment. Sociobiology 14, 353–359.
Sudd, J.H., Franks, N.R., 1987. The Behavioral Ecology of Ants. Chapman and Hall, New York, 206pp.
T.G. Shelton, A.G. Appel / Journal of Insect Physiology 47 (2001) 213–224
observe, trap, and prepare large numbers of subterranean termites for laboratory and field experiments. Environmental Entomology 2, 721–722.
Thorne, B.L., 1982. Termite–termite interactions: workers as an agon-istic caste. Psyche 89, 133–150.
Thorne, B.L., Carpenter, J.M., 1992. Phylogeny of the Dictyoptera. Systematic Entomology 17, 253–268.
Vogt, J.T., Appel, A.G., 2000. Discontinuous gas exchange in the fire ant, Solenopsis invicta Buren: caste differences and temperature effects. Journal of Insect Physiology 46, 403–416.
Waller, D.A., LaFage, J.P., 1987. Nutritional ecology of termites. In: Slansky, F. Jr., Rodriguez, J.G. (Eds.), Nutritional Ecology of Insects, Mites, Spiders, and Related Invertebrates. Wiley-Inter-science, New York, pp. 497–532.
Wasserthal, L.T., 1996. Interaction of circulation and tracheal venti-lation in holometabolous insects. Advances in Insect Physiology 26, 297–351.
Wheeler, G.S., Tokoro, M., Scheffrahn, R.H., Su, N.-Y., 1996. Com-parative respiration and methane production in nearctic termites. Journal of Insect Physiology 42, 799–806.
Williams, A.E., Rose, M.R., Bradley, T.J., 1997. CO2release patterns inDrosophila melanogaster: the effect of selection for desiccation resistance. Journal of Experimental Biology 200, 615–624. Withers, P.C., 1992. Comparative Animal Physiology. Saunders