M Anul Haq a * , Dr. Kamal Jain a , Dr K.P.R. Menon b a
Department of Civil Engineering, Indian Institute of Technology Roorkee, Roorkee, 247667, India b
Head Data Dissemination, NRSC Balanagar, Hyderabad *[email protected]
! "" # $ %&# ' " ! ' ( '
) * + #+ ! "" , ' - !' ' ! !' " ' !
. #
Land surface temperature (LST) is important factor in global climate change studies, for estimating radiation into heat balance studies and as a control for climate change models. The knowledge of surface temperature is important to a range of issues and themes in earth sciences, climate change and human interactions with environment. In this investigation an attempt has been made to estimate surface temperature from ASTER and Landsat Thermal Band data for the Gangotri Glacier. ASTER and Landsat Calibration had been performed to convert digital numbers to exoatmospheric radiance using published post5launch gains and offsets. The exoatmospheric radiance is then converted to surface radiance by applying the Emissivity Normalization method, assuming the emissivity of the Investigation area is constant (0.97, the emissivity of glacier ice). The surface temperature is then extracted from the surface radiance. Based on images from Oct 1990, 2001 and 2010 mean temperatures of 15.763, 15.893 and 17.154 respectively, are inferred. The extracted temperature data were compared to observed temperatures and showed a good correlation, with differences of 152oc.The variability of these retrieved Land surface Temperatures has been investigated with respect snout point, ELA and highest point of Gangotri Glacier determined from the Landsat visible bands and ASTER DEM. The emissivity per pixel is retrieved directly from satellite data and has been estimated as narrow band emissivity at the satellite sensor channel in order to minimize the errors in the land surface temperature estimation of study area.
/0 +
Land surface temperature can provide important information about the surface physical properties and climate which plays a role in many environmental processes (Dousset & Gourmelon 2003; Weng, Lu & Schubring 2004). Many studies have estimated the relative warmth of cities by measuring the air temperature, using land based observation stations. Some studies used measurements of temperature using temperature sensors mounted on car, along various routes (Yamashita 1996). This method can be both expensive and time consuming and lead to problems in spatial interpolation. Remote sensing might be a better alternative to the aforesaid methods. The advantages of using remotely sensed data are the availability of high resolution, consistent and repetitive coverage and capability of measurements of earth surface conditions (Owen, Carlson & Gillies 1998). In remote sensing, Thermal infrared (TIR) sensors can obtain quantitative information of surface temperature across the LU/LC categories.
Himalayan region glaciers are distributed in different climatic zones. The mean daily air temperature is low in the month of January and rises during the pre5 monsoon period (February to May), with maximum average daily temperatures during late May and early June, while during the post monsoon (October to January) season, mean daily air temperature decreases. The Himalaya cause changes in the air masses crossing the region, resulting in a special microclimate in the region. The southern plains possess sub5tropical climate with the middle hills having a temperate climate and an alpine climate in the high mountain ranges.
Surface temperature is one of the most important parameters for estimating the effect of climatic change on glaciers. Unfortunately, estimating surface temperature using traditional weather5station based meteorological observations is not a feasible solution for Snout, ELA and Max altitude of Glacier.
Therefore,through remote sensing studies, a synoptic
In this paper, an attempt has been made to estimate the surface temperature of the Baspa Basin from Landsat TM5 thermal band data (Band6, wavelength from 10.31 to 12.36 Em, having 120 m resolution. The extracted surface temperature data was compared with retrieved surface temperatures by National Center for Environmental Prediction (NCEP).
10 $ + + +
In the present Investigation, the main Investigation area is Gangotri glacier and whole Investigation area
covers 6 Districts of Uttarakhand are Haridwar,
Dehradun, Uttarkashi, Rudraprayag, Tehri Garhwal and Pauri and 1District of Uttar Pradesh that is
Saharanpur.The complete Gangotri glacier system
along with its tributaries covers an area of 210.60 sq km (ETM+2000). The area and length of the main trunk of the glacier is 62.112sq km and 29.85 km respectively. The average width of the glacier is
1.85 km. The glacier, lies between 79o4’ 46.13” E5
79o16’ 9.45” E and 30o43’ 47.00” N530o55’
51.05” N (ETM+2000). It has varying elevation of 4,015–6,145 meters above sea level (Haq et. al., 2011).
Landsat5 TM data was used in this Investigation.The
multi data sets were acquired on Oct 21 1990 and
Nov 13 2010. They consist of Band 6, Thermal
Infrared data, and were obtained from the Global Visualization Viewer (Glovis) in GeoTiff format.
Band/Satellite
Table1. Landsat AND ASTER data used in current investigation.
&0 + *
The strong absorption by snow in the infrared region allows the calculation of the surface temperature of snow from satellite thermal channels. The infrared radiance measured from a satellite can be converted to surface radiance by applying the Emissivity Normalization method. The surface radiance is then converted to surface temperature. The methodology followed is schematically shown in Figure 3. Both thermal bands of 1990 and 2010 were processed using ENVI 4.7.
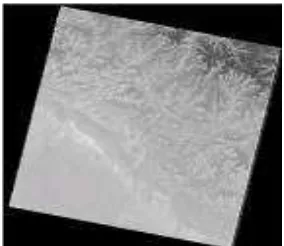
Figure 1. Landsat TM5, 1990 Band 6
Figure 3. Methodology used in current investigation
&0/ (" ' ( ! 2 '
Initially we perform Landsat Calibration to convert Landsat TM and ASTER, and digital numbers to spectral radiance or exoatmospheric reflectance (reflectance above the atmosphere) using published post5launch gains and offsets. The spectral radiance (Lג) is calculated using the following equation:
Where: QCAL is the calibrated and quantized scaled radiance in units of digital numbers
LMINλ is the spectral radiance at QCAL = 0 LMAXλ is the spectral radiance at QCAL = QCALMAX
LMINλ and LMAXλ are derived from values published in Chander, Markham, and Helder (2009). The resulting radiance (Lλ) is in units of watts per square meter per steradian per micrometer (W/ (m2*sr*Qm)).
The exoatmospheric reflectance (ρp) is calculated using the following equation:
Where:
Lλ is the spectral radiance
is the Earth5Sun distance in astronomical units
ESUNλ is the mean solar exoatmospheric irradiance.
ENVI uses the ESUNλ values from the
for Landsat 7 ETM+.
ENVI uses the ESUNλ values from Chander and
Markham (2003) for Landsat TM 4 and 5. θs is the solar zenith angle in degrees.
&01 ! ' " '
Thermal image data must be converted to radiance before performing the atmospheric correction; Thermal Atmospheric Correction requires for approximation and it removes the atmospheric effect contributions from thermal infrared radiance data. Following the approach of (Johnson et. al. 1998) determines the wavelength that most often exhibits
the maximum brightness temperature. This
wavelength is then used as the reference wavelength. Only spectra that have their brightest temperature at this wavelength are used to calculate the atmospheric compensation. At this point, for each wavelength, the reference blackbody radiance values are plotted against measured radiances. A line is fitted to the highest points in these plotted data and the fit is weighted to assign more weight to regions with denser sampling. The compensation for this band is then applied as the slope and offset derived from the linear regression of these data with their computed blackbody radiances at the reference wavelength.
&0& 3 ' ' "" 3 '4 ( '
5 "" 3 '4 ! 6 ' 7
The radiation emitted from a surface in the thermal infrared wavelengths is a function of both the surface temperature and emissivity. The emissivity relates to the composition of the surface and is often used for surface constituent mapping.
ASTER BAND 12
We use Emissivity Normalization technique to
separate the emissivity and temperature
information in radiance data measured with thermal infrared sensors. Emissivity Normalization assume a fixed emissivity value and produce emissivity and temperature outputs. It calculates the temperature for every pixel and band in the data using a fixed emissivity value. The highest temperature for each pixel is used to calculate the emissivity values using the Planck function.
$ " !'" ( + " "" "
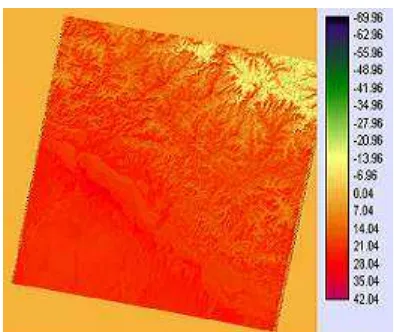
The resulting surface temperatures for the two scenes are presented in Figures. The mean temperatures estimated for the whole study area are 15.763 0C in Oct and 17.154 0C in Nov 2010.
In both images, comparatively very small area shows temperature less than 523(dark green and Black) are the peaks, in accumulation area the estimated temperature was around 55.00 0 C to 5 230C, where as in ablation area the temp was 5 5.000Cto 00 C. At snout the measured temperature is 0.1990C for both images. The remaining portion of the study area shows temperature between 10C to 32.720C in Oct 1990 and 10C to 42.040C in Nov 2010.
Whole Study area covers Gangotri glacier as well as Six Districts of Uttarakhand are Haridwar, Dehradun, Uttarkashi, Rudraprayag, Tehri Garhwal and Pauri and one District of Uttar Pradesh that is Saharanpur. Table 3 shows the derived land surface temperature of complete scenes.
Feature Coordnates Elevation Temp in 1990 Temp in 2001 Temp in 2010
Snout 30.92,79.07 4082 0.1999 0.1998 0.1999
ELA 30.82,79.12 4649 55.910 55.715 55.408
Max Altitude 30.73,79.27 6351 523.77 522.81 521.58
Table2. Feature wise Surface Temperature of Gangotri Glacier
! "
Climate change has a significant impact on glaciers, which are very sensitive to changes in atmospheric conditions. Long term temperature observations over the glaciated terrains of the Himalaya can therefore provide a detailed understanding of climate change in the region. The main aim of this investigation was to examine a methodology for the estimation of Land surface temperatures from satellite data. The resulting estimated land surface temperatures were compared to NCEP modeled Surface temperature and the results showed a good correlation. The derived Land surface temperatures were compared with daily average mean surface temperatures modeled by the NCEP. The NCEP modeled temperature was found to be cooler than the extracted surface temperature, which is a realistic expectation. The results show that the satellite derived temperatures values are in the acceptable range. The present results show that satellite data can provide regionally representative values for surface temperatures, which is not possible from ground observations given the scarcity of data. The derived surface temperature values are found to be in good agreement with the field measured values, indicating that the methodology can be adopted for the Investigation over Himalayan region.
, "
Anul Haq and Kamal Jain.2011. Change Detection of Himalayan Glacier Surface Using Satellite Imagery. In Regional Conference on Geomatics for G governance from 13 – 14 September, 2011.
Johnson, B. R. and S. J. Young, "In5Scene Atmospheric Compensation: Application to SEBASS Data Collected at the ARM Site," Technical Report, Space and Environment Technology Center, The Aerospace Corporation, May 1998.
Chander, G., B. Markham, and D. Helder, 2009.
Summary of current radiometric calibration
coefficients for Landsat MSS, TM, ETM+, and EO51 ALI sensors. Remote Sensing of the Environment, Vol. 113, pp. 8935903.
Landsat 7 Science Data Users Handbook, updated October 2007. NASA Goddard Space Flight Center.
. Accessed February 2009.
Hook, S. J., A. R. Gabell, A. A. Green, and P. S. Kealy, 1992. A comparison of techniques for extracting emissivity information from thermal infrared data for geologic studies. Remote Sensing of Environment, Vol. 42, pp. 1235135.

