Investigation of Optical Flow Techniques for Extracting Non-Rigid Sea Surface Currents
Emad. Ghalenoeia, *, Mohammad. Ali. Sharifia, Mahdi. Hasanloua
a Surveying and Geomatics Engineering Dept., College of Engineering, University of Tehran, Tehran, Iran (emadghalenoei, sharifi, hasanlou)@ut.ac.ir
KEY WORDS: Non-Rigid, Sea surface currents, Sea surface temperature, Eddies, Optical flow, Smoothness
ABSTRACT:
This paper is about performance evaluation of two optical flow (OF) methods for extracting sea surface curved motions like eddies. By incorporating a simple matrix and its rotation in programming procedure, curved motion can be obtained. These two OF methods are Horn/Schunk and Lucas/Kanade. The Horn/Schunk method depends on a smoothness parameter (α) and when it changes, smoothness and reality change too. The Lucas/Kanade method is more complex than previous one. It depends on two parameters, smoothness parameter (Sigma) and window size (Win). Different values for Win and Sigma change smoothness and reality of the flows. Sea surface currents are extracted from two sequential sea surface temperature (SST) images by using OF methods. By using these methods and selecting the appropriate parameters like smoothness (for Horn/Schunk) and window size and smoothness (for Lucas/Kanade) extracting real flows or smooth flows are possible and investigated in this paper.
1. INTRODUCTION
Critical issues in extracting and monitoring sea surface currents (SSC) are curved motions. These curved motions happen in coasts and other places in sea and depend on some physical characterizes like upwelling. Optical flow (OF) techniques work precisely when motions are rigid directions (like jet currents), but if they move like eddies and have rotating scheme, optical flow techniques may extract the wrong currents.
There are many applications in using optical flows (Barron et al., 1994). Sometimes extracted flows should be dense and sometimes they should not be dense and only be accurate. Accuracy relates to reality and density or smoothness relates to appearance. On the other hands, tracing sea surface currents is possible by tracking pattern of sea temperature in successive images. Recently, this technique is widely used by researcher for purpose of sea current extraction.
This paper tries to evaluate the performance of two OF techniques by incorporating variety of parameters and settings. Two sequential sea surface temperature images extracted from MODIS sensor used as input of these OF techniques.
2. OPTICAL FLOW TECHNIQUES
The purpose of using optical flow is approximate calculation of movement in two dimensions. This technique has many usages in different fields (Barron et al., 1994). Conditions and assumptions in OF cause to extract these movements from sequential images. The relation and equation of changing brightness in every point of image and it specifies movement of brightness patterns; is made by these assumptions.
If brightness in image coordinate (x,y) at time t is shown with I(x,y,t) and is assumed this pattern is constant, then we have:
�� �� =
(1)
2.1 Horn/Schunck
The Horn/Schunck method of estimating OF is a global method which introduces a global constraint of smoothness to solve the aperture problem. Here, Horn/Schunck method is used for extracting optical flow. Calculation of first order partial derivatives makes this algorithm so complex. Also computing Laplace equations have heavy calculations in each iteration too. There is a smoothness term in solution of OF in this method that is suitable for extracting SSCs. Equation of flow that is represented by E, is like a global energy functional which is the sought to be minimized.
E=∬[ I u + I v + It 2+ α2 ‖∇u‖2+ ‖∇v‖2 ] dx dy (2)
Where Ix, Iy and It are the derivatives of image intensity values along x, y and time dimensions respectively, u and v are OF vector and the parameter α is regularization constant. Larger values of α lead to a smoother flow (Horn and Schunck, 1981).
2.1.1 Properties
Advantages of the Horn/Schunck algorithm include that it yields a high density of flow vectors, i.e. the flow information missing in inner parts of homogeneous objects is filled in from the motion boundaries. On the negative side, it is more sensitive to noise than local methods (Horn and Schunck, 1981).
2.2 Lucas/ Kanade
In computer vision, Lucas/Kanade assumes that the flow is essentially constant in a local neighbourhood of the pixel under consideration, and provides flows for all the pixels in that neighborhood, by the least square criterion.
assumes displacement of the image contents between two nearby instants (successive images) is small and approximately constant within a neighbourhood of the any given points. The least squares approach implicitly assumes that the errors in the image data have a Gaussian distribution with zero mean (Lucas and Kanade, 1981). The Lucas/Kanade method can be used only when the image flow between the two images is small enough for the differential equation of the OF to hold, which is often less than the pixel spacing (Lucas and Kanade, 1981).
3. STUDY AREA AND DATA SETS
This section introduces the study area and also data sets that heavily modified by anthropogenic activities, mainly as a result of changes in the water flow and degradation of the water quality in the ecosystems (Zonn et al., 2010). Changes in the regional environment have influenced regional economies, particularly obvious in the impacts on fish stocks. Some reports focus on the root causes for the most important drivers of environmental change in the region: habitat and community modification (Zonn et al., 2010).
3.2 Sea Surface Temperature
Brightness and digital number of point in images is SST, then OF can track temperature patterns. This method leads us to recognition of movements of surface temperature. That means by tracing surface temperature catching surface current is possible.
For extracting SSC from SST images, It needs one or more pair/successive images. The SST images calculated from MODIS sensor that is boarded on Terra and Aqua satellites. Aqua is ascending orbit satellite and is known to afternoon satellite. Terra is descending orbit satellite and is known to morning satellite. The revisit cycle of these satellites is 12 hours (Ghalenoei, 2014). Time distance of an image without cloud covering from Aqua to Terra or inverse is almost 6 hours. Then finding these images with minimum time distance are very
After getting SST images, preparing successive images as input of OF algorithms is necessary. In this regards, the two images with minimum time distance are a pair images. In other word, if the SST images are sequential due to time, first and second images are first pair images and second and third images are second pair images and so on. Here two SST images make one pair image (Ghalenoei, 2014).
(a) (b)
Figure 1. SST, Aqua. (a) 2 August 2010, 9:35. (b) 2 August 2010, 23:10
4. EXPRIMENT AND RESULTS programing, it can be made as following:
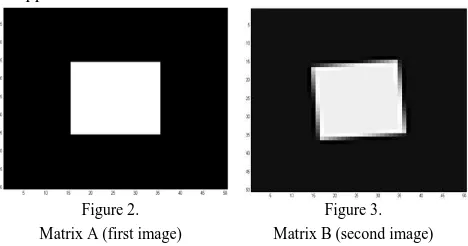
A=zeros(50,50); A(16:35,16:35)=1;
In this matrix all of pixels are 0 except 16th to 35th of rows and columns that are 1. Rotating matrix A by 5 degree in a counter clockwise direction around its center point is possible by using imrotate function (Fig 3).
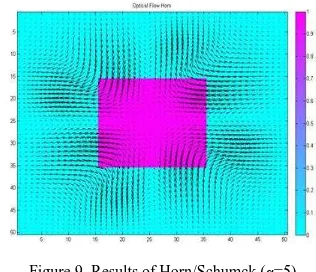
Rotated matrix (matrix B) is like an eddy on sea surface that OF wants to extracted it. First, Horn/Schunck method is used and is analysed its smoothness parameter (α) when it changes from 0.1 to upper values. flows can show rotating but when it’s more than 1.0, the flows mistake to extracting its rotating center because of it wants to make more smooth flows and doesn’t pay attention to the purpose that it must be a rotational motion (Figure 4-9) .
Figure 5. Results of Horn/Schumck (α=0.5)
Figure 6. Results of Horn/Schumck (α=1)
Figure 7. Results of Horn and Schumck (α=2)
Figure 8. Results of Horn/Schumck (α=3)
Figure 9. Results of Horn/Schumck (α=5)
4.3 Results of Lucas/Kanade method
This method depends on two parameters; Win and Sigma are respectively window radius (for integration) and amount of smoothness. Intuitively, a small integration window would be preferable in order not to "smooth out" the details contained in the images. But if Win is constant, smoothness of results can be changed by Sigma (a parameter that controls amount of smoothness). Results show investigation of Win parameter for values 2 and 5 and for each value (2 or 5) Sigma parameter is changed to see difference of them (Figures 10-21).
Figure 10. Results of Lucas/Kanade (Win=2, Sigma=0.1)
Figure 11. Results of Lucas/Kanade (Win=2, Sigma=0.5)
Figure 13. Results of Lucas/Kanade (Win=2, Sigma=2)
Figure 14. Results of Lucas/Kanade (Win=2, Sigma=3)
Figure 15. Results of Lucas/Kanade (Win=2, Sigma=5)
Figure 16. Results of Lucas/Kanade (Win=5, Sigma=0.1)
Figure 17. Results of Lucas and Kanade (Win=5, Sigma=0.5)
Figure 18. Results of Lucas/Kanade (Win=5, Sigma=1)
Figure 19. Results of Lucas/Kanade (Win=5, Sigma=2)
Figure 20. Results of Lucas/Kanade (Win=5, Sigma=3)
Figure 21. Results of Lucas/Kanade (Win=5, Sigma=5)
Whatever Win parameter is larger, the flows are more smooth and better for extracting rotating scheme (like sea surface eddies) but should pay attention to Sigma, use of less value for Sigma (like 0.5 or 1) and large value for Win (like 5) results appropriate schemes for monitoring the eddies. Thereupon figure 17 and its parameters have the best performance for extracting rotational movements.
4.4 Extracting SSCs from SST
the Caspian Sea. A small place is selected and flows are shown in the figures.
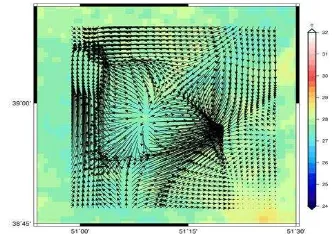
Figure 22. Results of Horn/Schunck plotted on SST (α=0.1)
Figure 23. Results of Horn/Schunck plotted on SST (α=1)
Figure 24. Results of Horn/Schunck plotted on SST (α=3)
Figure 25. Results of Lucas/Kanade plotted on SST (Win=2,Sigma=0.1)
Figure 26. Results of Lucas/Kanade plotted on SST (Win=5, Sigma=1)
Figure 27. Results of Lucas/Kanade plotted on SST (Win=5, Sigma=3)
For smoothness condition in α=3 (Fig 24), some of curved motions are ignored relative to α=0.1 (Fig 22) but the flows in Figure 24 are more continuous and smooth. The results of Lucas/Kanade are more smooth when Win increases and by decreasing Sigma (Sigma=1) it can obtain real flows (Fig 26), but in Figure 27 when Sigma increases (Sigma=3), the reality decreases and the extracted flows are more smooth. It suggests for sea surface currents that are like jet currents and when they move like curved lines it’s better to decrease Sigma.
Each vector for example in figure 23 has different direction with its match (Figure 24) and when α increases, the norm of vectors increase too regards to size of vectors. Using arccos function for calculating angular differences can provide a map that shows the most disturbances for extracted directions.
�= cos− ⃗⃗ . ⃗⃗⃗
∥ ∥ . ∥ ∥ (3)
Where, A and B are respectively first and second vectors. ∥ ∥ and ∥ ∥ are respectively norm of A and B.
Figure 28. Angular differences between Fig 23 and 24 (in degree)
Figure 29. Angular differences between Fig 26 and 27(in degree)
5. CONCLUSION
small window size in Lucas/Kanade method is preferable but it’s less smooth relation to great size. The norms of vectors increase when α (in Horn/Schunck) and Sigma (in Lucas/Kanade) get great values. Reality and smoothness are two main characterizes that they change together. When smoothness increases, reality decreases and vice versa. Angular differences maps (Fig 28 and 29) show the errors that occur when two different smoothness parameters are chosen, also in high differences; it shows the main places that optical flow techniques are unable to determine real motions.
REFERENCES
Barron, J.L., Fleet, D.J., Beauchemin, S.S., 1994. Performance of optical flow techniques. Int. J. Comput. Vis. 12, 43–77. doi:10.1007/BF01420984
Ghalenoei, E., 2014. Extracting Sea Surface Currents from Thermal Maps and Satellite Altimetry data in Caspian Sea (Thesis submitted to the Graduate for The degree of M.Sc. in Geodesy Engineering). College of Engineering, University of Tehran, Tehran, Iran. Horn, B.K., Schunck, B.G., 1981. Determining Optical Flow.
pp. 319–331. doi:10.1117/12.965761
Lucas, B.D., Kanade, T., 1981. An Iterative Image Registration Technique with an Application to Stereo Vision. pp. 674–679.