POINT CLOUDS SEGMENTATION AS BASE FOR AS-BUILT BIM CREATION
H. Macher, T. Landes, P. Grussenmeyer
Photogrammetry and Geomatics Group, ICube Laboratory UMR 7357, INSA Strasbourg, France (helene.macher, tania.landes, pierre.grussenmeyer)@insa-strasbourg.fr
Session C-2: Digital 3D modeling
KEY WORDS: 3D modelling, indoor point clouds, space segmentation, as-built BIM, existing buildings, automation
ABSTRACT:
In this paper, a three steps segmentation approach is proposed in order to create 3D models from point clouds acquired by TLS inside buildings. The three scales of segmentation are floors, rooms and planes composing the rooms. First, floor segmentation is performed based on analysis of point distribution along Z axis. Then, for each floor, room segmentation is achieved considering a slice of point cloud at ceiling level. Finally, planes are segmented for each room, and planes corresponding to ceilings and floors are identified. Results of each step are analysed and potential improvements are proposed. Based on segmented point clouds, the creation of as-built BIM is considered in a future work section. Not only the classification of planes into several categories is proposed, but the potential use of point clouds acquired outside buildings is also considered.
1. INTRODUCTION
The modelling of indoor areas of existing buildings is a huge issue since the emergence of Building Information Modelling in the Architecture, Engineering and Construction (AEC) industry. As-built BIM is particularly helpful for restoration, documentation and maintenance of existing buildings.
As shown in Fai et al. (2013), a BIM is a 3D model with objects defined as building elements and classified into different categories such as openings, footings and vertical structure, horizontal structure, roof structure. BIM is not only a 3D model as it combines geometric information and a database.
Volk et al. (2014) highlight the fact that despite well established BIM processes for new buildings, the majority of existing buildings is not maintained, refurbished or deconstructed with BIM yet. However, according to Giudice and Osello (2013), the need to refurbish the cultural heritage is becoming more important than the construction of new buildings.
The creation of an as-built 3D model requires the acquisition of the as-is conditions of the building. The scanner laser is widely used to achieve this goal because of its fast acquisitions and its accuracy. Point clouds also provide a very high level of geometric information. Unfortunately, the creation of as-built 3D models from point clouds remains currently largely a manual process because of the huge amount of data and because of processes, which are difficult to automate. A key challenge today is thus to automate the process leading to 3D models from point clouds.
The creation of as-built BIM involves 3 tasks: geometric modelling of building elements, object category and material properties assignment as well as object relationship modelling (Tang et al., 2010). This paper focuses on geometric modelling based on a three steps segmentation approach from a large scale to a small scale, with aim to make the modelling easier. Object
category assignment is proposed in a future work section as a bridge towards as-built BIM.
In a related works section existing approaches of 3D modelling based on indoor point clouds are presented. Then, data acquisition and pre-processing steps are described. Next, each step of our approach is explained and illustrated with the presented datasets. Finally, in a future work section, a way to go towards as-built BIM is proposed.
2. RELATED WORKS
The façades modelling was already studied in many works (e.g. Pu and Vosselman, 2009, Boulaassal et al., 2010, Dore et al., 2014). However the modelling based on indoor point clouds of existing buildings requires other methods as it presents more challenges to overcome. Indeed, it is not limited to a plane. Moreover, existing buildings present a lot of occlusions such as desks, computer equipment, chairs and cabinets.
The works reported in the literature deal with different techniques for indoor modelling from point clouds. 3D methods are mainly based on geometric primitive segmentation. Some approaches are based on space segmentation before applying a more detailed segmentation. Macher et al. (2014) propose the segmentation of sub-spaces corresponding to architectural entities. Similarly, Ochmann et al. (2014) propose a point-to-room labelling which is based on scan positions and detected planar structures.
Another approach consists in extracting planes in a single point cloud. Then, either plane intersections are performed (Xiong et al., 2013) or a wireframe model is created based on boundary extraction (Jung et al., 2014).
2D methods are also used to create 2D or 3D products from indoor point clouds. Huber et al. (2011) use a 2D projection of point clouds and create, based on point density, floor map models. Mura et al. (2014), for their part, perform a 2D ISPRS Annals of the Photogrammetry, Remote Sensing and Spatial Information Sciences, Volume II-5/W3, 2015
projection of the X-Y plane to process automatic room segmentation.
A key challenge for the modelling of existing buildings is the management of occlusions. Huber et al. (2011) and Xiong et al. (2013) use a ray tracing algorithm in order to label each surface as occupied, occluded or empty. This algorithm permits to identify occluded parts of point clouds and an inpainting algorithm is then used to reconstruct these parts.
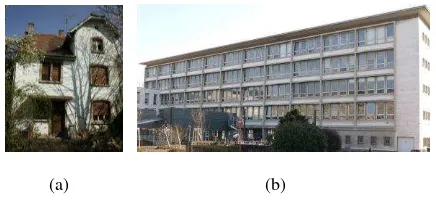
3. DATA ACQUISITION AND PRE-PROCESSING National Institute of Applied Sciences (INSA) in Strasbourg built during the 1960’s (Figure 1b). This construction follows the construction fabric of the French national education applied after the Second World War for rebuilding process. It tends to optimize the surfaces by distributingclassrooms on both sides of a corridor. The building is of rectangular shape with a flat roof terrace. The ground floor and first floor of the building which represent approximately 2500 sqm were scanned. Unlike the individual house, this building presents a lot of occluding objects such as desks, computer equipment, chairs and cabinets.
(a) (b)
Figure 1. Buildings under study: (a) individual house; (b) INSA building
3.2 Data acquisition
Both buildings were scanned using the laser scanner FARO Focus3D X330. Spheres and checkerboards were placed adequately in order to link scans in a post-processing step. A minimum of 3 targets in common between two scans is required for registration. However, it is recommended to take more than three and to compensate the whole network of targets at once.
The point cloud density was chosen based on the space configuration. Large spaces obviously require a higher density of points, on one hand to cover all the space with a correct density and on the other hand to be able to detect spheres placed in the scene in a post-processing step. This latter condition is induced by the specific target acquisition method of the FARO
Focus3D X330. Thus, for example for the INSA building a two times higher density of points was chosen to scan corridors than to scan classrooms.
For both datasets, images of the scenes were also registered by the laser scanner in order to colorize point clouds. For the clouds. Individual house acquisition requires more scans per square meter because of tight corridors and rooms. It was more difficult to walk through in the house.
(a)
(b)
Figure 2. Indoor colorized point clouds: (a) individual house (60 million points); (b) INSA building (1.7 billion points)
3.3 Pre-processing steps
Before applying different segmentations to the point clouds, several treatments need to be done. First, based on spheres and checkerboards placed in each scan, scans are registered using the dedicated software FARO SCENE. They are then exported in xyz format; one file is associated to one scan.
Next, for each point cloud, outliers are removed manually. Outliers are defined here as artefacts (false points) induced by very reflective and transparent surfaces such as mirrors and windows as well as points located far from the scene, which are not linked with the building. The points acquired on the surface of occluding objects are kept. The automation of outliers’ reduction will be studied in a future work.
Finally, point clouds are spatially resampled to accelerate processing time. Point clouds resampled at 1 cm are used for floor and room segmentation whereas point clouds resampled at 5 cm are used for plane segmentation.
ground floor
vaulted cellar first floor attic ISPRS Annals of the Photogrammetry, Remote Sensing and Spatial Information Sciences, Volume II-5/W3, 2015
4. FLOOR SEGMENTATION
In order to segment the space into floors, point clouds of each scan are considered separately. Indeed, regarding one point cloud derived from one scan, identification of acquired space elements is easier than in the whole point clouds of the building.
Floor segmentation step is based on two tasks. First, the ground of each scan is identified. Then, based on the Z values of the grounds, floor numbers can be attributed.
4.1 Ground altitude identification
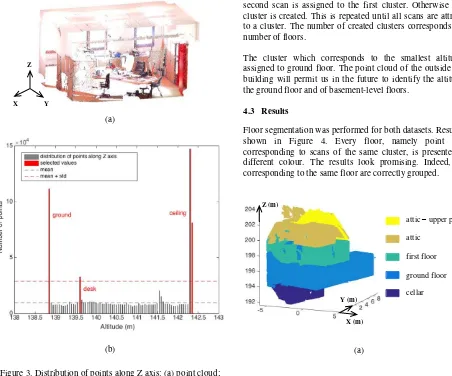
For each scan a histogram of the distribution of points along Z axis is realized. Altitudes of points are sorted into bins with an interval of 5 cm. The mean and standard deviation of points per bin are determined and the values upper the mean plus standard deviation are kept. The aim is to detect peaks in the histogram which correspond to horizontal elements of the acquired scene and notably the ground and the ceiling.
Figure 3a shows a point cloud corresponding to an office and Figure 3b shows the associated histogram and the detected peaks. In this histogram, the height of each rectangle indicates the number of elements in the bin.
(a)
(b)
Figure 3. Distribution of points along Z axis: (a) point cloud; (b) corresponding histogram
Considering the number of peaks detected, several cases appear. When the ceiling and the ground are clearly defined, only 2 well separated peaks are detected and their associated altitudes are stored respectively as ground altitude and ceiling altitude.
If more than two peaks are detected, the mean of altitudes associated to the peaks are calculated. Among peaks under the mean, the peak which has the higher occurrence is considered as ground altitude. Similarly, the peak over the mean and with the higher occurrence is considered as the ceiling altitude.
The last case is that for which only one peak is detected. This may appear when the ceiling is not flat. In this case the altitude of the peak is attributed to ground altitude.
Note that at this stage of the developed approach, scans realized in stairs are generally assigned to the downstairs. Moreover, the ceiling altitude is not yet used for floor segmentation.
4.2 Floor number attribution
Based on the ground altitude of each scan, scans are grouped into several clusters corresponding to the different floors. In order to do that, the ground altitude of the first scan is assigned to a first cluster. Then, the distance between the ground altitude of the second scan and the altitude corresponding to the first cluster is computed. If this distance is lower than 1 m, the second scan is assigned to the first cluster. Otherwise a new cluster is created. This is repeated until all scans are attributed to a cluster. The number of created clusters corresponds to the number of floors.
The cluster which corresponds to the smallest altitude is assigned to ground floor. The point cloud of the outside of the building will permit us in the future to identify the altitude of the ground floor and of basement-level floors.
4.3 Results
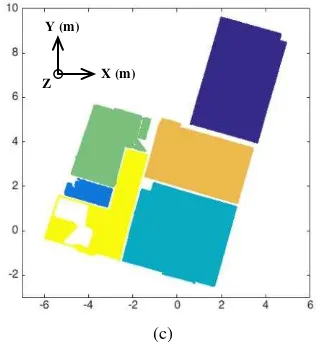
Floor segmentation was performed for both datasets. Results are shown in Figure 4. Every floor, namely point clouds corresponding to scans of the same cluster, is presented in a different colour. The results look promising. Indeed, scans corresponding to the same floor are correctly grouped.
(a) X
Z
Y
Z (m)
X (m) Y (m)
cellar ground floor first floor attic
attic – upper part ISPRS Annals of the Photogrammetry, Remote Sensing and Spatial Information Sciences, Volume II-5/W3, 2015
(b)
Figure 4. Floor segmentation results: (a) individual house; (b) 3 floors of the INSA building
5. ROOM SEGMENTATION
For scans belonging to a same floor, room segmentation is performed. The main idea here is to consider a slice of point clouds at ceiling level. The ceiling level was identified for each scan in the previous step. In this slice there should be no links between rooms. It is supposed here that buildings have flat ceilings.
5.1 Image creation and 2D segmentation
Instead of working in the point cloud, it has been decided to create a binary map from the point clouds under study. An image is created based on a slice of 20 cm of point clouds at ceiling level. The advantage of using an image is that time processing is reduced and the complexity induced by calculations in 3D is avoided. A pixel size corresponding to three times the spatial resampling is chosen, that is 3 cm in our case. This value is a compromise to avoid on the one hand holes in the image and on the other hand the disappearance of thin walls. As depicted in Figure 5b, if a pixel contains almost one point, a value of 255 (shown in white) is allocated to it.
Based on the created image, a region growing is performed. Neighbouring pixels of a randomly chosen pixel are analysed and added or not to the region. This process is iterative and once a region is complete, once again a point is selected randomly and so on. Figure 5c shows the result of the region growing applied to the image in Figure 5b.
(a) (b)
(c)
Figure 5. Image creation and 2D segmentation: (a) slice of point clouds at ceiling level; (b) generated image; (c) result obtained after region growing (one colour per detected
region)
5.2 From 2D to 3D regions
In order to move from 2D to 3D regions representing the rooms, the distances between 2D regions and the floor points are computed. For each 2D region, the 2D Euclidian distances between points of the floor and the corresponding nearest point in the region are determined. Figure 6 shows a part of a 2D region in dark blue superimposed with the floor points projected in 2D in red. The 2D distances between red points and the corresponding nearest dark blue point are determined. If these distances are lower than a predefined threshold, the points are assigned to the region. A threshold of 5 cm was chosen based on the pixel size of 3 cm.
Figure 6. 2D region (dark blue points) and floor points projected in 2D (red points)
Note that 3D regions are created based on a floor point cloud resampled at 5 cm. This sampling is required for the next step namely plane segmentation.
After distances computations and attribution of points to regions, some points are still not assigned to a region. These points, which notably correspond to openings, will be exploited in the future.
X (m) Y (m)
Z
X (m) Y (m)
Z
X (m) Y (m)
Z Z (m)
X (m)
Y (m)
ground floor first floor
part of the second floor
5.3 Results
5.3.1 For individual house: Room segmentation was performed for the ground floor of the individual house as shown in Figure 7. The 3D regions (Figure 7a) were established based on 2D regions presented in Figure 5c. Unattributed points are presented in Figure 7b. They correspond to a large extend to openings situated between rooms.
(a)
(b)
Figure 7. Room segmentation results – Individual house: (a) 3D regions; (b) unattributed points
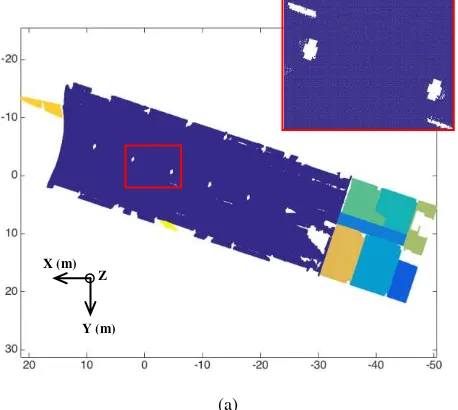
5.3.2 For the INSA building: Figure 8 presents the results obtained for the ground floor of INSA building.
(a)
(b)
(c)
Figure 8. Room segmentation results – INSA building: (a) 2D regions and zoom in ceiling occluded by pillars;
(b) 3D regions; (c) unattributed points
Figure 8c shows that unattributed points correspond to openings and elements located outside the building but also to pillars located inside this scene. Indeed, in this set of data, pillars occlude the ceiling as depicted in Figure 8a. As a result, the points composing pillars are not attributed to any region. The same observation was made for the first floor where luminaires occlude the ceilings.
An idea to overcome this problem will be to use for each region a mathematical morphological operator to close holes before the step of 2D to 3D regions processing.
6. PLANE SEGMENTATION
Finally, a segmentation of planes is performed in two steps for each room. First, planes corresponding to floor and ceiling are identified. Then, the rest of the point cloud is segmented twice into planes. Because of its efficiency, RANSAC algorithm is used in both steps. The tolerance defining the inliers of the segment using RANSAC was fixed to 5 cm.
6.1 Floor and ceiling segmentation
An histogram is once again used to determine for each room the altitude of floor and ceiling. For each room, two slices of point cloud at floor and ceiling levels are selected and segmentation into planes is performed. The two larger planes, which are horizontal, correspond to floor and ceiling. These planes are stored as floor and ceiling and removed from the point cloud.
Floor and ceiling segmentation constitutes a first step towards as-built BIM creation. Indeed, a category of object is attributed to a geometric entity.
6.2 Segmentation of remaining points
Based on point cloud from which floor and ceiling points were removed, plane segmentation is performed again. The major planes are thus extracted. Then, a second segmentation is performed on still unsegmented points. Indeed, given our processing chain, the probability that first segmentation extracts small planes is low.
Z (m)
X (m) Y (m) Z (m)
X (m) Y (m)
X (m)
Y (m) Z Z (m)
X (m) Y (m)
Z (m)
X (m) Y (m)
6.3 Results
Plane segmentation was performed for the rooms composing the ground floor of the individual house presented in Figure 7a. As shown in Figure 9a, floors and ceilings are correctly segmented in the first step. Then almost walls are extracted (Figure 9b) and finally small details are highlighted (Figure 9c). In Figure 9c, the red points are still unsegmented points.
(a)
(b)
(c)
Figure 8. Plane segmentation results: (a) floor and ceiling segmentation;
(b) wall segmentation; (c) remaining points (in colours) and partially unsegmented (in red)
7. FUTURE WORK
The results of plane segmentation need to be exploited. Indeed, even if floors and ceilings are already identified, the other detected planes have to be classified into several categories such as walls, occluding objects or pillars. The classification of geometric entities into different categories of objects constitutes a first step towards as-built BIM creation.
Additionally, knowing space configuration rules, namely that the neighbourhood of each room composes a floor, planes can
be grouped together to form walls. They will constitute separation elements between the previous detected regions.
Once planes corresponding to walls are identified and classified, point clouds acquired outside the building can be used as additional information to differentiate façade walls from cross walls and partitions. This will allow separating interior structure of the building from exterior structure of the building. Moreover, detection of windows will probably be performed on exterior walls whereas detection of doors is planned to be performed mainly on interior walls.
8. CONCLUSION
In this paper, a three steps segmentation approach was proposed and illustrated with two different datasets. The developed approach is semi-automatic because of thresholds which must be defined but the degree of automation can be improved.
Despite some potential improvements, the obtained results look promising. Indeed, the different sub-spaces of indoor buildings namely floors, rooms and planes composing the rooms are correctly identified in point clouds.
The planes composing the rooms still need to be classified into different categories to be used as input for as-built BIM creation. Additionally, planes could be grouped to form walls and to define the structure of the building.
In the future, our approach will be improved and tested on other datasets. Moreover, this approach is based exclusively on the X, Y and Z coordinate of points. The potential use of RGB and intensity information will also be studied.
ACKNOWLEDGEMENTS
The authors want to thank for their support the French College of Chartered Surveyors.
REFERENCES
Boulaassal, H., Chevrier, C. and Landes, T., 2010. From Laser Data to Parametric Models: Towards an Automatic Method for Building Façade Modelling. In: EuroMed 2010, LNCS, Springer, Heidelberg, vol. 6436, pp. 42-55.
Dore, C. and Murphy, M., 2014. Semi-automatic generation of as-built BIM façade geometry from laser and image data. Journal of Information Technology in Construction, 19, pp. 20– 46.
Fai, S., Filippi, M., and Paliaga, S., 2013. Parametric modelling (BIM) for the documentation of vernacular construction methods: a BIM model for the commissariat building, Ottawa, Canada. In: Int. Annals of the Photogrammetry, Remote Sensing and Spatial Information Sciences, II-5/W1, pp. 115–120.
Giudice, M. D. and Osello, A., 2013. BIM for Cultural Heritage. In: Int. Archives of the Photogrammetry, Remote Z
X Y
Z
X Y
Z
X Y
Sensing and Spatial Information Sciences, XL-5/W2, pp. 225-229.
Huber, D., Akinci, B., Adan, A., Anil, E., Okorn, B., and Xiong, X., 2011. Methods for automatically modeling and representing as-built building information models. Proceedings of the NSF CMMI Research Innovation Conference, Atlanta, Georgia. CMMI-0856558.
Jung, J., Hong, S., Jeong, S., Kim, S., Cho, H., and Heo, J., 2014. Productive modelling for development of as-built BIM of existing indoor structures. Automation in Construction, 42, pp. 68–77.
Macher, H., Landes, T., Grussenmeyer, P., Alby, E., 2014. Semi-automatic Segmentation and Modelling from Point Clouds towards Historical Building Information Modelling. In: EuroMed 2014, LNCS, Springer, Heidelberg, vol. 8740, pp. 111–120.
Mura, C., Mattausch, O., Villanueva, A. J., Gobbetti, E., Pajarola, R., 2014. Automatic room detection and reconstruction in cluttered indoor environments with complex room layouts. Computers & Graphics, 44, pp. 20-32.
Ochmann, S., Vock, R., Wessel, R., Tamke, M., & Klein, R., 2014. Automatic generation of structural building descriptions from 3d point cloud scans. In: Proceedings of the 9th International Conference on Computer Graphics Theory and Applications.
Pu, S. and Vosselman, G., 2009. Knowledge based reconstruction of building models from terrestrial laser scanning data. In: ISPRS Journal of Photogrammetry and Remote Sensing, 64(6), pp. 575–584.
Tang, P., Huber, D., Akinci, B., Lipman, R., and Lytle, A., 2010. Automatic reconstruction of as-built building information models from laser-scanned point clouds: A review of related techniques. Automation in Construction, 19(7), pp. 829–843.
Volk, R., Stengel, J., and Schultmann, F., 2014. Building Information Modeling (BIM) for existing buildings –Literature review and future needs. Automation in Construction, 38, pp. 109–127.
Xiong, X., Adan, A., Akinci, B., and Huber, D, 2013. Automatic creation of semantically rich 3D building models from laser scanner data. Automation in Construction, 31, pp. 325–337.