RAPID RISK EVALUATION (ER
2) USING MS EXCEL SPREADSHEET: A CASE STUDY
OF FREDERICTON (NEW BRUNSWICK, CANADA)
H. McGrath a*, E. Stefanakis a, and M. Nastev b
a Department of Geodesy and Geomatics Engineering, University of New Brunswick, Fredericton, NB, Canada - (hmcgrat1, estef)@unb.ca
b Natural Resources Canada, Geological Survey of Canada, Québec, Canada – [email protected]
Commission VI, WG VI/4
KEY WORDS: Flood Risk, Vulnerability, Exposure, MS Excel, Building Damage
ABSTRACT:
Conventional knowledge of the flood hazard alone (extent and frequency) is not sufficient for informed decision-making. The public safety community needs tools and guidance to adequately undertake flood hazard risk assessment in order to estimate respective damages and social and economic losses. While many complex computer models have been developed for flood risk assessment, they require highly trained personnel to prepare the necessary input (hazard, inventory of the built environment, and vulnerabilities) and analyze model outputs. As such, tools which utilize open-source software or are built within popular desktop software programs are appealing alternatives. The recently developed Rapid Risk Evaluation (ER2) application runs scenario based loss assessment analyses in a Microsoft Excel spreadsheet. User input is limited to a handful of intuitive drop-down menus utilized to describe the building type, age, occupancy and the expected water level. In anticipation of local depth damage curves and other needed vulnerability parameters, those from the U.S. FEMA’s Hazus-Flood software have been imported and temporarily accessed in conjunction with user input to display exposure and estimated economic losses related to the structure and the content of the building. Building types and occupancies representative of those most exposed to flooding in Fredericton (New Brunswick) were introduced and test flood scenarios were run. The algorithm was successfully validated against results from the Hazus-Flood model for the same building types and flood depths.
1. INTRODUCTION
Every year disastrous climatological and geological hazards take place in Canada and around the globe (Nastev & Todorov, 2013). In 2010, an estimated 178 million people across the world were affected by flooding and billions of dollars of damage caused (Leskens, Brugnach, Hoekstra, & Schuurmans, 2014). The costliest single disaster on record in Canada is the 2013 flood in Calgary, AB, with a price tag exceeding $6 billion (Environment Canada, 2013). In New Brunswick (NB), the study area of this project, over $23 million in damages resulted from the Saint John River flooding in 2008, and over 70 floods have been recorded along this waterway since the 1700s (Public Safety Canada, 2014).
Government officials, GIS specialists, emergency managers, and responders require tools to develop mitigation and recovery plans as well as preparedness and response procedures for natural disasters (McGrath, Stefanakis, & Nastev, 2015; Neighbors, Cochran, Caras, & Noriega, 2013). Evaluation of risk involves the combination of three components: the potential flood hazard, inventory of the built environment, and representative vulnerability functions – which relate the inundation depth to a percent damage of the asset. Studies of past flood events have shown that the majority of losses arise in urban areas, due to impairment of structures, costs of business shut-down, and failure of infrastructure (Jongman et al., 2012). Over the past 20 years, considerable progress has been made with respect to flood mitigation strategies by combining strategic planning and risk-based management techniques (Nicholls, Townend, Bradbury, Ramsbottom, & Day, 2013). There are a wide variety of flood damage models in use internationally, differing substantially in their approaches to flood computation and estimates of economic costs (Jongman et al., 2012). There are commercial (AIR
Germany Flood Model, AIR UK Flood Model) and open (Basement, Hazus-MH, Kalypso) software solutions available. Many of these solutions have been built specifically to address flood concerns in their country of origin, which, by design is tailored to meet the conditions, infrastructure, and processes relevant in their geographic region - which often make transferability to another geographic region difficult.
Of the watershed modelling and risk assessment applications available today, few are capable of non-expert implementation (Al-Sabhan, Mulligan, & Blackburn, 2003). In addition, the input data requirements and data manipulation required for these models to run may exceed the technical capabilities of the broader non-expert safety community(Nastev et al. 2015). These existing models therefore leave a gap between what is needed (and when) by decision makers and the output a model is able to provide (Leskens et al., 2014).
In this paper, we present the Rapid Risk Evaluation (ER2) Flood tool, which uses a spreadsheet application to compute replacement cost of the building and estimate potential damages resulting from user input flood scenarios. User input is limited to a handful of intuitive drop-down menus utilized to describe the building type, age, occupancy and the expected water level. In anticipation of local depth damage curves and other needed vulnerability parameters, those from the U.S. FEMA’s Hazus-Flood software have been imported temporarily. The computations are done on building-by-building or aggregate scenario basis. The results of structural and content damage are validated for flood scenarios in Fredericton, NB against Hazus estimates. The paper is structured as follows, In Section 2 a brief introduction to flood loss estimation in included and in Section 3 the framework of ER2 is described. Section 4 introduces the study area. In Section 5 ER2 results are presented and comparisons
made to Hazus. Section 6 summarizes findings and details future research plans to enhance the application.
2. FLOOD LOSS ESTIMATION
Direct losses occur as result of direct physical contact of the flood water with humans, properties, or other objects, while indirect losses represent those which are induced by flood impact and may occur (in time or space) outside of the flood event (Merz, Kreibich, Thieken, & Schmidtke, 2004). Direct economic losses include calculations of repair and construction costs resulting from the flood event, whereas indirect economic losses are related to lost jobs and business interruption (FEMA, 2010). It is the calculation of the direct economic losses which were of primary interest in the development of ER2. The most common and internationally accepted method of estimation of urban flood damage is through the use of depth-damage functions (Plazak, 1984). Structure and contents damage resulting from flood hazard are influenced by many factors, however, usually only building use and inundation depth are considered as damage-causing factors and included in the formulation of depth-damage functions (Merz et al., 2004). The building age, foundation type, and elevation of the first floor can be included as factors which contribute to the estimated damage of a structure, which are external to the depth-damage functions (FEMA, 2010).
3. ER2 METHODOLOGY
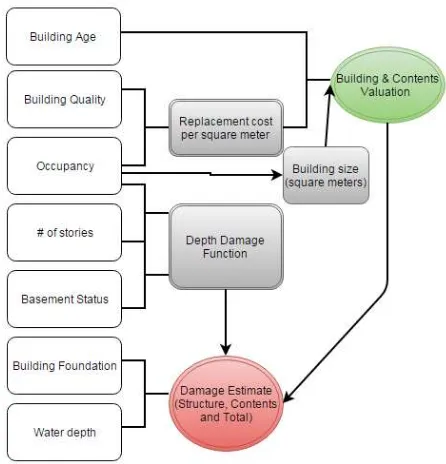
Following the findings of Plazak (1984), Merz et al., (2004) and FEMA (2010), primary inputs for the computation of direct economic losses focus on depth-damage functions, and include inundation depth, building use (occupancy), foundation type, age, and height of first floor. Using these inputs, estimates of the building value are computed, along with estimates of damage to the structure, its contents, and the sum of these to show total losses in Canadian dollars (Figure 1). The calculation of building valuation and estimated damages utilize nationally compiled data tables from the Hazus software, which have been modified to represent Canadian parameters. Data tables from Hazus which are used in ER2 include occupancy classification, depth damage function, replacement costs per square meter, and floor area (square meter) of a structure, described in Table 1.
The building occupancy classification table is a primary nominal data category in the worksheet, and is the parent of many other elements in the calculations. Occupancy classifications used in this application include 11 classes of residential occupation, 10 commercial classes, 6 industrial, two for each of government and education, and one for each of agriculture and religious structures. The selection of occupancy is the determiner of the floor area (square meters), replacement costs per square meter, and damage functions. Each of these values is accessed via a lookup table using a common occupancy identifier. The building size square meters table is based on distributions of floor area, developed at the dissemination area level for all provinces and territories from the 2011 Canadian Census and Duns & Bradstreet data (Hazus Canada, 2014). Replacement costs per square meter were derived from the same data, using RSMeans 2006 values for all occupancy codes. The replacement costs per square meter have been averaged over various alternatives for exterior wall construction (e.g.: wood siding over wood frame, brick veneer over wood frame, etc.) (FEMA, 2012).
Figure 1. Flow diagram for ER2. White boxes indicate user inputs, grey are computed interim values, and green and red are
computed valuation and estimated damages respectively.
Table Contents Description Hazus Table
Building Occupancy Classification
BldgStrDmgFn
Depth Damage Functions BldgStrDmgFn,BldgContentsDmgFn Replacement costs ($/sq m) hzReplacementCost,
hzRes1ReplCost (FEMA, 2010), however as derived Canadian damage functions become available, they will be imported and set as the default. A table of depreciation factors based on the age of the structure is used to appropriately assign value to the structure. Additionally, tables which account for presence of garage and basement (finished or unfinished) are used in computation of building value and selection of the appropriate damage curve. Using these nationally derived data tables, the ER2 tool results are considered as average for a group of buildings with similar structural and content characteristics. As the data in these tables represent an average, they do not necessarily account for differences and regional variations. To overcome this, an alternative option which allows user input of a known building value is included in ER2.
3.1. ER2 Design Interface
ER2 is comprised of three worksheets which allow user input, present results, and provide a geospatial view via Esri Maps for Office, while the remaining worksheets provide supporting information for lookup functions and contain computational data.
The three worksheets each provide unique scenarios. The first worksheet computes exposure and estimated damages to a single building type with a single user input water level. The second worksheet computes building-by-building losses, allowing up to 300 unique structures, each requiring its own flood level. On the third worksheet users can simulate an aggregated flood risk analysis with up to 50 different building types and four discrete water levels with user input percentages for the dissemination area or block. The tool has been setup for manual user input, or, if data exist in another file format, they may be pasted to into ER2 building input section.
3.1.1 ER2 Interface Design
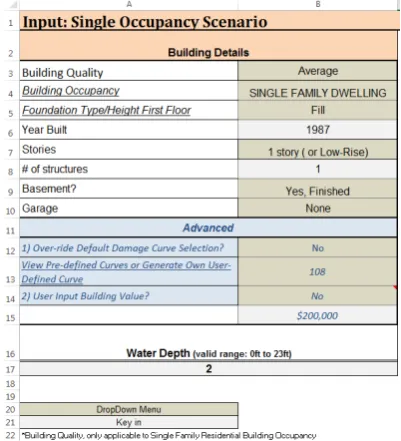
The required user input includes building details and potential water depth, Figure 2. The user interface has been configured to accept input to cells via colour coded options. The dark grey cells represent fields for which a user can select an option from pre-determined set of values via a drop down menu. The dropdown menu options have been created using the List option of the Data Validation settings and selecting the defined group name representative of the cells. Light grey cells allow users to input numeric values. Conditional formatting has been used for the manual input cells to restrict user inputs to a given range. Advanced settings, which over-ride default parameters are colored in blue and allow for a user to input a known building value, override the default damage curve selection, or input details of a user defined curve.
Figure 2. User input of building details (assets at risk) and water level (hazard)
3.1.2 ER2 Result Design
The results available in ER2 are estimates of building exposure and potential direct economic losses, relevant to structure and its contents. These data are presented in tabular format via a pivot table, providing the user the ability to choose the level of detail for reporting with charts that graphically illustrate the damage estimates, Figure 3.
Figure 3. Pivot table and chart results
3.1.3 ER2 Geospatial Result Design
Included in the building input section of each worksheet is the option to include the spatial location of buildings. The location may be entered in the form of geographic coordinates or the physical address. Through the use of the Esri Maps for MS Office extension, users may easily spatially visualize the building details and loss estimations. Data from any field may be used to theme the data, and there is an abundance of choices regarding colour, size and symbol. To further improve the information portrayed in the map, a user may add any layers from ArcGIS Online or Portal for ArcGIS (ESRI, 2015). These results may be shared online, exported to a power point presentation, or capture a static image of the map.
Figure 4. ER2 results, visualized in MS Excel, Esri Maps for Office
3.2. ER2 Calculations
ER2 computes building valuation (if needed), estimated building losses – structural, contents and total losses in Canadian dollars.
3.2.1 Building Exposure Valuation
To avoid confusion with market value or government assessed property value the cost of a building is computed via a formula reflecting average construction costs. Building value is computed using the age of building, number of stories, size of the structure and the replacement cost per square meter (Equation 1). Additional costs are added based on building quality (residential only), basement status and/or garage presence (Equation 1).
To compute building valuation, the first input required is the building occupancy classification, for example, consider a single family residence (RES1). Using RES1 occupancy class, the size of the structure (Ab _ is extracted from the ‘hzSqftFactors’ worksheet, in this example: 185.80m2. RES1 and the number of stories (s) are required to look up the replacement cost per square meter (Cwi , $709.45 for a one-story RES1 building of ‘Average’ quality. Building value is increased if a basement exists (b and if it is finished or not Cwb . Building value is further increased if a garage is present (gwg) and depends on the type of garage (Cwg . The building value is then multiplied by an age depreciation factor (Ag and by the number of structures of the same type (n . Residential structures are a special class, and have multiple RSMeans replacement cost options based on the construction class (i), (e.g.: economy, average, luxury, etc.). These construction classes take into account factors such as the quality of building materials and superiority of craftsmanship (FEMA, 2012).
Exp = (Ab _ (swiCwi) + Ab _ bCwb+ ngwgCwg)Ag * n (1)
3.2.2 Contents Exposure
The contents valuation is based on the estimated exposure as described above multiplied by a contents value percentage. The contents value is a fixed percentage, based on the occupancy class of the input structure. For example, residential structures contents are set at 50% of the building value, most commercial structures, in part to account for shelf inventory, compute contents at 100% of the building value, while most industrial buildings, hospitals, and education facilities compute contents value at 150% of the building value. These valuation percentages are based on RSMeans, as read from the ‘hzExposureContent GBldgTypeB’ worksheet (Table 1).
3.2.3 Structure damage estimation
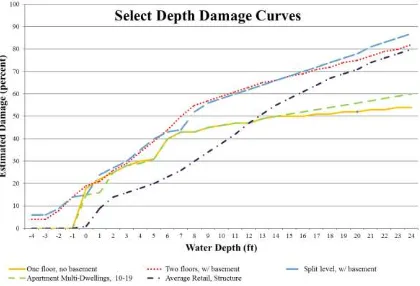
Of primary influence to the damage estimation is the selection of depth damage curve, a core of the vulnerability analysis. A damage function is described by an estimated percent of damage at any given water level. There are numerous depth damage curves available in the literature, describing structural, contents, and inventory damage for each building occupancy type. ER2 (at present) is configured to select a Federal Insurance Administration’s (FIA) or modified FIA depth damage functions for residential structures while the remaining occupancy classes refer to U.S. Army Corps of Engineers (USACE) damage curves. However, users can override these damage curves with their own curve definitions. Each building occupancy type has a recommended default damage function associated to it. In addition to the occupancy type, damage functions are unique per basement status and the number of stories. Figure 5 illustrates a number of depth-damage functions available in ER2.
Figure 5. Examples of Depth Damage curves (FEMA, 2010).
The estimated structure damages (SDk) are a function of the number of structures (n) of a given occupancy class (k), valuation of the structure (Exp and the percent damage of the selected depth damage curve at the given water level (� Equation 2. The depth damage curve (� is selected based on the occupancy class (�, number of stories � , basement status (� . The percent damage to the structure (� is read from the building damage table, at the intersection of this selected depth-damage curve based on the user input water depth (� ) minus the foundation type (� (Equation 3).
SDk = � ∗ Exp ∗ � (2)
� = [� ���] ∩ [ � − � ] (3)
3.2.4 Contents damage estimation
Estimating the contents damage to a building at a given water level is also based on the relationship of flood depth and percent damage. A separate table of damage curves, designed specifically to represent percent contents damage is referenced. As with the structure depth-damage curves, the contents depth-damage curves are unique per occupancy class, basement status and number of stories. To estimate the contents damages in dollars, the required inputs are the contents valuation (Cval), and the percent contents damage � (Equation 4). Where � is equal the intersection of the water depth (� ) minus the foundation type (� of the appropriate selected contents depth-damage curve , and is determined based on the occupancy class (�, number of stories � , basement status (� (Equation 5).
CDk = Cval * � (4)
� = [ ���]⋂[ � − � ] (5)
4. STUDY AREA: FREDERICTON, NB
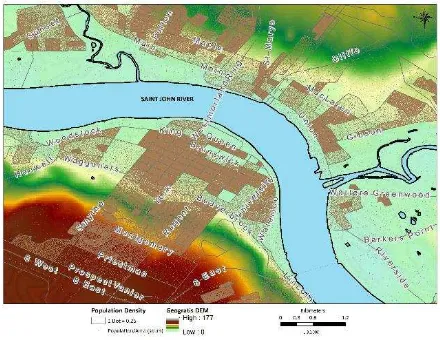
The City of Fredericton is the capital of New Brunswick and located in the west-central portion of the province in Atlantic Canada. The city is split by the St. John River which flows from west to east through the city. The local topography varies considerably with elevations ranging from 2 m to ~175m above sea level, and includes undulating and hilly land (Stobbe, 1940) (Figure 6). The basin immediately surrounding the St. John River and downstream of Fredericton is relatively flat, with an average mean water level of 2m above sea level (Lantz, Trenholm, Wilson, & Richards, 2012).
Data from the 2011 Canadian Census, indicate approximately 30,000 households in Fredericton and the surrounding suburbs with a total population of approximately 71,000 (Lantz et al., 2012; Statistics Canada, 2011). The population of Fredericton is primarily adults, between 16 and 65 with smaller representation by children (11%) and seniors (13%). As shown in Figure 6 there is a relatively high population density in the area adjacent to the Saint John River on the south side. Of the buildings in this area, approximately 320 buildings have an elevation within 5m of the river bank.
Single family residential buildings are the most common in Fredericton, comprising 73% of the residential structures. Under 10% of residential buildings in the area are classified as multi-family apartment buildings, and 6.5% of residences are mobile homes. Other buildings in the city limits include those classified as commercial (2,100), industrial (225), religious (200), government (80) or education (60). The single family buildings are primarily wood framed, one or two story buildings, with unfinished basements or crawlspaces. The mean house value is $212,800.
Flood records, dating back to the 1700s indicate over 70 floods, with heavy rainfall, mild weather, snowmelt, and ice jams as primary causes of flooding (New Brunswick, Environment and Local Government, 2014). Flooding occurs when the river level exceeds flood stage, which is 6.5m above sea level. The highest flood levels ever recorded were in 1973, when the water level was 2.04 m above flood stage, while the second largest flood occurred in 2008, where water level reached 1.86 m above flood stage. The 2008 flood caused ~$23million in damages to New Brunswick communities situated along the Saint John River (Public Safety Canada, 2014). For testing of the ER2 algorithms, water levels from two historic flood events were used: the 2008 flood, and the third largest flood on record which occurred in 2005, with flood level 1.324 m above flood stage (Figure 7).
Figure 6. Fredericton, NB. Local topography and population density
Figure 7. Two historic flood events, Fredericton, NB
5. RESULTS
Flood depth grid and user defined facilities representing local structures were imported to Hazus Canada, and analysis was run. The results from Hazus Canada, (with respect to these user defined facilities) indicate that 356 single family residences experience flooding. These flooded houses range in value from $41,000 to $495,600, with an average value of $147,019. The flood depth in these structures for the 2008 scenario ranges from 1.3cm to 1.67m. The oldest building in the study area has a year of construction dating back to 1901, while the median year of construction is 1995. Also damaged in this scenario are 161 manufactured houses, 7 triplexes and 6 multi-family dwellings with 10-19 units. In addition to residential properties, retail, wholesale trade, churches and entertainment facilities are expected to incur flood damage. Aggregated losses at the dissemination block level were also computed.
At present, local field claims data archived by the N.B. Department of Emergency Measures Organization (EMO) are currently unavailable to validate ER2 against field data. Analysis of the results of ER2 are therefore compared only to the Hazus Canada results in this paper.
As described in Section 3, users of ER2 are able to input building details and have ER2 compute the estimated building value or they may input a known building value. Each of these options and their aggregated results are described in the following sections.
5.1. Percent Damage
There are over 900 different damage curves defined in ER2. The selection of damage curve for a given structure is based on many factors including: occupancy class, basement, number of stories and type of flooding (riverine or coastal). For a one-story single family residence in Fredericton without a basement, the FIA depth damage curve with an ID of 105 is the default curve used to predict structure damage (Figure 8). The depth damage definitions are given at one foot (~30.5 cm) intervals, with percent damage in-between being linearly interpolated. Figure 8 illustrates positive correlation of the ER2 damage estimates with the depth damage curve definitions. However, the Hazus estimates of structure and contents damage do not align as well with the damage curve definitions. Hazus data do follow a similar trend to the depth-damage curve, but tend to underestimate
damage below 1m, while above 1m the structure damage is over-estimated. The contents damage is underestimated at all water levels in comparison to the curve definition. Plotting percent damage versus water depth for another flood scenario in Fredericton, NB, the third largest flood (2005) produced a similar Figure with the ER2 damages following the damage curve definition while the Hazus results again pivot from below to above the curve definition when once approximately 1m water depth is reached.
Figure 8. Percent Damage based on water level and depth damage curve, one-story single family residence with no
basement
5.2. Economic Losses
As discussed in Section 3, estimates of damage are based on water depth and percent damage. The percent damage is then converted to currency via the percent of structure value. If a user does not input a known building value, one is computed via average values based on RSMeans. For example, all single family residences are assumed to be 185m2, and replacement cost per square meter of an average quality home is $709.45. Given this assumptions of generalized costs and size, we can expect the ER2 damage estimates to vary from the Hazus results.
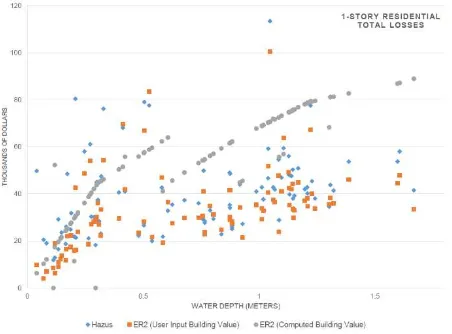
Of the 356 single family residences which, according to Hazus analysis experience flooding, 182 have been identified as single story family residences. Of these 1-story residences, 156 have no basement, while the remainder are considered to have a finished basement. Plotted in Figure 9 are estimates of the total losses from each scenario: Hazus, ER2 using computed building value, and ER2 using user input building value. The minimum water depth for which damage is estimated is 1.5cm, with the maximum from the 2008 flood event for one story single family residences is 1.66 m. There is a trend of increasing uncertainty in the damage estimates as water depth increases.
When the total damages are plotted against water depth for the three scenarios (Figure 9) Hazus, ER2 – user input (ER2-UI) building value, and ER2 – computed building value (ER2-C) we can clearly see a trend to the loss estimates. ER2-C there is a linear increasing trend to the damage estimates with increasing building value. There are two trends for ER2-C in Figure 9: as water levels increase, from 0 to 0.6m, there is an increase in the total estimated damages across the buildings which have a uniform value. As the water depth exceeds 0.6m there is a shift in damages and the linear trend continues, seeing increased damages with increasing water depth. For the Hazus and ER2-UI
the total damage estimates are more randomly distributed, and do not follow the same linear trend, however there is generally an increase of damages with increasing water level. The scattering of the damage estimates for ER2-UI and Hazus represent damages which are not based solely on floor area and a generic value of replacement cost, but an assessed property value which better represents the true value of the building. As ER2-UI and Hazus both use the same input building value, we expect to see a good correlation of total estimated damages.
Comparison of ER2-UI to Hazus structural damage shows, on average an over-estimate of $1,447, with a standard deviation of 6,058 (Table 2). The difference in the estimated contents damages, between ER2-UI and Hazus also indicate an over estimate by ER2-UI, by an average of $4,700 across this sample of 156 single family residences with no basement. As ER2-UI uses the same input building value as does Hazus, the difference we see in the total loss estimate can be related back to the differences in percent damage as shown in Figure 8. The ER2-C structural and content losses deviate farther from the Hazus and ER2-UI losses, primary due to the buildings initial value. Since all buildings (ER2-C) started with roughly the same building value, $186,000, the computed estimated losses have a smaller standard deviation, but are, in magnitude, different from the Hazus results. On average, the difference between the ER2-C and Hazus loss estimate is 26%, or an over estimate of 26% for structural damage and 45% with respect to contents damage.
Figure 9. Total Damages versus water depth for Hazus, ER2 using user input building value and ER2 using computed building value.
Hazus ER2-UI ER2-C
Structure Contents Structure Contents Structure Contents Avg $27,964 $12,738 $29,410 $17,439 $35,413 $18,825 Min $ 8,293 $ 3,554 $ 6,637 $ 2,122 $0 $0 Max $81,451 $31,942 $76,364 $ 48,762 $54,277 $34,639 Table 2. One-story single family residences, statistics from 156
buildings in Fredericton, NB Estimates from 2008 flood event ER2 user input building value (ER2-UI), ER2 Computed
building value (ER2-C )
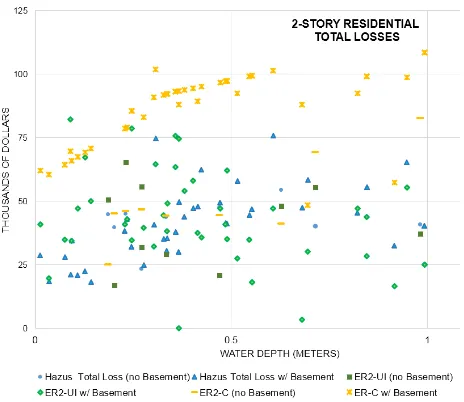
In addition to the flooded 1-story buildings, there are 80 two-story buildings in the study area which experience flood damage from these flood scenarios. The majority of these residences have a finished basement. The flood depth experienced by these houses ranges from 1.3cm to 1.25m. Given the large percentage of houses with finished basements, total damages are much
higher at lower water levels (Figure 9) than those found in Figure 10. Figure 10 shows damages computed using the ER2-C (computed building value) which follows a linear trend along the shape of the damage curve, while those which used real property assessment values (Hazus and ER2-UI) are represented by scattered data when plotted against depth.
Figure 10. Total Damages versus water depth for Hazus, ER2 using user input building value and ER2 using computed building value, 2 Story residences, with and without basements
The majority of construction of residential housing in Fredericton began in the 1960s. Plotting the same total loss data from Figure 9, using building age instead of water depth along the x-axis, we are able to visualise the estimated damage to structures over four decades (Figure 11). From Figure 11, it appears that buildings which have a recorded construction date between 1990 and 2005 are those which have the greatest damage incurred based on the 2008 flood scenario. These results seem contradictory to the flood risk mapping and New Brunswick Community Planning Act (New Brunswick Department of Environment, 2013). A review of the assessment database which lists the building age, coded by ‘year first’, should be reviewed.
Figure 11. Total Damages versus water depth for Hazus, ER2 using user input building value and ER2 using computed building value by building age.
6. CONCLUSIONS
This paper presents the principal characteristics and considerations of the flood risk assessment tool, Rapid Risk Evaluation (ER2) developed within a familiar MS Excel office package, providing capabilities for any user, with (or without) specialized technical knowledge to simulate potential flood scenarios and view estimates of exposure and damages to structures.
Results from ER2 from two historic flood events in Fredericton, NB were compared to those results computed by Hazus. We intend to further test ER2 results against field data once access to field claims database is made available.
When ER2 User Input (ER2-UI) building values are used, the structural, contents, and total losses computed are in agreement with Hazus results. ER2-UI and Hazus building values are not based solely on floor area and a generic value of replacement cost, but an assessed property value which better represents the true value of the building. As ER2-UI and Hazus both use the assessed input building value, we expect to, and do see, a positive correlation of total estimated damages. On average, structure loss differences are within 1.05% and contents 1.27%. When comparing ER2 using computed building values (ER2-C) against Hazus loss estimates, the error was higher: an average of 26% difference for structural damage and 45% with respect to contents damage. ER2-C uses nationally averaged data in the calculation of building area, replacement cost per square meter, and construction costs; it was therefore expected the results from ER2-C would be larger than those computed using assessment data. In both use cases of ER2, the damage estimates were found to be higher than those computed using individual building data.
The comparison is between Hazus and ER2 and these estimates have not been validated against field data. Recommendations for further testing and improving this algorithm include expansion of results against claims data and to review occupancy classes other than single family residences. Additionally, testing ER2 in other communities to see how ER2 estimates compares to Hazus, itself (computed building value and user input building value), and field data are of interest. Furthermore, adding in capabilities which would consider flow velocity, flood duration and water contamination are potential enhancements to the application.
Future plans for this algorithm is to offer it up as a web service and to enrich the application with a spatial component which reads building information and details data from local and provincial datasets. This spatial component will provide visualization of results through thematic maps and provide an option alternative to the Esri Maps for Office. ER2 is presently available for download from http://www2.unb.ca/~hmcgrat1/ (McGrath, 2015). Additionally, the application will be extended by adding an ability to compute risk resulting from probabilistic flood scenarios, flow velocity, flood duration, and repair duration estimates.
ACKNOWLEDGEMENTS
This project is partially supported by the Canadian Safety and Security Program (CSSP) which is led by Defence Research and Development Canada’s Centre for Security Science, in partnership with Public Safety Canada. The CSSP is a
funded program to strengthen Canada’s ability to anticipate, prevent/mitigate, prepare for, respond to, and recover from natural disasters, serious accidents, crime and terrorism through the convergence of science and technology with policy, operations and intelligence. Natural Resources Canada leads the project in partnership with New Brunswick EMO, University of New Brunswick, Public Safety Canada regional office in Fredericton, and New Brunswick Ministry of Transport.
REFERENCES
Al-Sabhan, W., Mulligan, M., & Blackburn, G. A. (2003). A real-time hydrological model for flood prediction using GIS and the WWW. Computers, Environment and Urban Systems, 27(1), 9-32.
Environment Canada. (2013). Canada's top ten weather stories for 2013. Retrieved from http://www.ec.gc.ca/meteo-
weather/default.asp?lang=En&n=5BA5EAFC-1&offset=2&toc=show
ESRI. (2015). Esri. Retrieved from http://www.esri.com/
FEMA. (2010). HAZUS®MH MR3 flood model user manual. http://www.fema.gov/media-library/:
FEMA. (2012). Hazus 2.1 flood technical manual. (Technical Manual).USACE.
Hazus Canada. (2014). Inventory: Exposure by occupancy, natural resources canada, Hazus canada metadata, hzExposure OccupB_md.rtf. Unpublished manuscript.
Jongman, B., Kreibich, H., Apel, H., Barredo, J. I., Bates, P. D., Feyen, L., Ward, P. J. (2012). Comparative flood damage model assessment: Towards a European approach. Natural Hazards and Earth System Science, 12(12), 3733-3752. doi:10.5194/nhess-12-3733-2012
Lantz, V., Trenholm, R., Wilson, J., & Richards, W. (2012). Assessing market and non-market costs of freshwater flooding due to climate change in the community of Fredericton, eastern canada. Climatic Change, 110(1-2), 1-2.
Leskens, J. G., Brugnach, M., Hoekstra, A. Y., & Schuurmans, W. (2014). Why are decisions in flood disaster management so poorly supported by information from flood models? Environmental Modelling and Software, 53, 53-61.
McGrath, H. (2015). Flood hazard and risk assessment research at UNB, GGE department. Retrieved from http://www2. unb.ca/~hmcgrat1/
McGrath, H., Stefanakis, E., & Nastev, M. (2015). Sensitivity analysis of flood damage estimates: A case study in Fredericton, New Brunswick. International Journal of Disaster Risk Reduction, 14, Part 4, 379-387.doi:http://dx.doi.org/10.1016/ j.ijdrr. 2015.09.003
Merz, B., Kreibich, H., Thieken, A., & Schmidtke, R. (2004). Estimation uncertainty of direct monetary flood damage to buildings. Natural Hazards and Earth System Science, 4(1), 153-163.
Nastev, M., & Todorov, N. (2013). Hazus: A standardized methodology for flood risk assessment in Canada. Canadian Water Resources Journal, 38(3), 223-231.
Neighbors, C. J., Cochran, E. S., Caras, Y., & Noriega, G. R. (2013). Sensitivity analysis of FEMA HAZUS earthquake model: Case study from King County, Washington. Natural Hazards Review, 14(2), 134-146.
New Brunswick Department of Environment. (2013). Environment and local government. Retrieved from http://www2.gnb.ca/content/gnb/en/departments/elg.html New Brunswick, Environment and Local Government. (2014). Flood history database. Retrieved from http://www.elgegl.gnb.ca /0001/en/Flood/Search?LocationName=Fredericton
Nicholls, R. J., Townend, I. H., Bradbury, A. P., Ramsbottom, D., & Day, S. A. (2013). Planning for long-term coastal change: Experiences from England and Wales. Ocean Engineering Ocean Engineering, 71(2), 3-16.
Plazak, D. (1984). A critical assessment of methodologies for estimating urban flood damages-prevented benefits. (Information Series, n.52 No. 000006953). Colorado: Fort Collins, Colo.: Colorado Water Resources Research Institute, Colorado State University.
Public Safety Canada, (2014). Canada's national disaster mitigation strategy. Retrieved from http://www.publicsafety.gc. ca/cnt/rsrcs/pblctns/mtgtn-strtgy/index-eng.aspx
Statistics Canada. (2011). Retrieved from http://www12.statcan. gc.ca/census-recensement/2011/as-sa/fogs-spg/Facts-csd-eng.cfm?LANG=Eng&GK=CSD&GC=1310032
Stobbe, P. C. (1940). Soil survey of the Fredericton-Gagetown area, New Brunswick. Ottawa: Experimental Farms Service, Dominion Dept. of Agriculture in co-operation with the New Brunswick Dept. of Agriculture.