CALCULATION AND UPDATE OF A 3D BUILDING MODEL OF BAVARIA
USING LIDAR, IMAGE MATCHING AND CATASTRE INFORMATION
K. Aringer, R. Roschlaub*
Bavarian State Office for Surveying and Geoinformation, Germany - (klement.aringer, robert.roschlaub)@lvg.bayern.de
Commission II, WG II/2
KEY WORDS: Roof typeextraction from LiDAR, LoD2, cadastre boundary, CityGML, Image Matching
ABSTRACT:
The Bavarian State Office for Surveying and Geoinformation has launched a statewide 3D Building Model with standardized roof shapes without textures for all 8.1 million buildings in Bavaria. For acquisition of the 3D Building Model LiDAR-data are used as data basis as well as the building ground plans of the official cadastral map and a list of standardized roof shapes. The data management of the 3D Building Model is carried out by a central database with the usage of a nationwide standardized data model and the data exchange interface CityGML. On the one hand the update of the 3D Building Model for new buildings is done by terrestrial building measurements within the maintenance process of the cadastre. On the other hand the roofs of buildings which were built after the LiDAR flight and which were not measured terrestrially yet, are captured by means of picture-based digital surface-models derived from image-matching of oriented aerial photographs (DSM from image matching).
* Corresponding author.
1. 1. 1.
1. INTRODUCTION
Due to the federal structure in Germany the official surveying and mapping is assigned to the states. Therefore, nationwide projects need close cooperation and commitment by the states. »The Cadastral and Surveying Authorities of the state, which are responsible for the real estate cadastre and state survey (Official German Surveying and Mapping), cooperate within the Working Committee (AdV, URL: http://www.adv-online.de) of the Surveying Authorities of the States of the Federal Republic of Germany to discuss technical issues of fundamental and nationwide importance targeting standardized regulations.« This includes the determination of common standards for the acquisition of 3D Building Models across Germany. In 2012 AdV decided a product standard for 3D Building Models. According to that, the building ground plans are derived from the official digital cadastral map and the buildings are represented as blocks uniformly with a flat roof in the so called first detailed level (Level of Detail 1 – LoD1). Since 2013 a central LoD1-dataset is initially assembled which is expected to be centrally delivered in the middle of 2013. The data exchange between the states and the central service center uses a nationwide uniform profile of the AdV based on the City Geography Markup Language (CityGML) Encoding Standards from OpenGIS® and the Open Geospatial Consortium (OGC)
Specification CityGML 1.0.0.
This AdV-CityGML-profile is also designed for the delivery of building data with standardized roof shapes as building models of the second detailed level (LoD2) with optional photo-realistic textures. The degree of automatic recognition of roof shapes and the elevation accuracy of the automatic roof reconstruction are on the one hand dependent on the degree of generalization of the roofs to the standard roof forms and on the other hand based on the acquisition basis. If LiDAR-data (Light Detection And Ranging) from airborne laser scanning is used for the acquisition, then the density of the point cloud is
significant. When oriented aerial photographs are used, the accuracy of the orientation elements and the point allocation determines the quality of positional and elevation accuracy. The usage of the building outlines simplifies the building reconstruction from LiDAR-data and aerial images (Vosselman, 2002, Rottensteiner and Briese, 2003). The ISPRS benchmark on
3D Building reconstruction (Rottensteiner et al., 2012) contains three out of seven different methods, which use building outlines or building maps.
Independently from the used acquisition method and the underlying dataset an update after the first acquisition of a 3D Building Model has to be ensured. This requires a comprehensive concept containing the first acquisition, the data management and the update process combined in one workflow.
2. 2. 2.
2. THE FIRST CALCULATION CONCEPT
Since 2012 LiDAR-data with a point density between 1 and 4 points per square meter are available in Bavaria. This data are suitable for calculating a precise digital elevation model (DEM) as well as a surface model. Currently the DEM is available in the minimum mesh size of 1 m for approximately 90 % of Bavaria’s territory. The overall coverage will be achieved in the middle of 2014.
2.1 General problem definition
The usage of randomly spread point clouds for the derivation of 3D Building Models causes difficulties for the interpretation of basic and unstructured elevation models and the subsequent modeling of the complex vector geometries. For all point clouds (steadily or unsteadily arranged) the data information content is limited to the elevation. Additional structures are missing. Nevertheless, by linking the point clouds with building ground plans (Figure 1) which are for example available up to date in the cadastre, the point clouds get a first semantic and spatial attribution.
Figure 1. Height coded LiDAR-data within a building ground plan (left), Delaunay Triangulation (right)
The assignment of the building ground plan complies a selection of relevant points from the point cloud. The elevation information of the selected points can now be interpreted as representatives of the roof. First roof structures like ridgelines can plastically be visualized with a Delaunay Triangulation. A relevant geometrical attribution as vectorial surface is missing. One possible method of automatic roof reconstruction proceeds as follows: Each triangle surface, which was calculated from the relevant points by an elevation-independent (2.5-dimensionale) Delaunay Triangulation, is dedicated to a standardized surface normal with a length of 1m.
Figure 2. Surface normals of the Delaunay Triangulation (left), test of the orthogonality of a surface normal in reference to a building side (right)
Subsequently it will be analyzed to which side of the building ground plan each surface normal belongs. As presented in figure 2 any of the surface normals will be selected. It can then be projected in the xy-plane due to its tilt and a respective direction angel of the xy-plane can be calculated. Considering a clockwise building ground plan direction it is first tested, whether the direction angel of the projected surface normal is orthogonal to the side of the building. A certain variance between the direction angels is considered. Secondly the minimal orthogonal distance is calculated from the base point of the surface normal to one of the sides of the building. With this method usually each surface normal is assigned to exactly one side of the building ground plan. Surface normals which cannot
be assigned to a side, for example due to the dispersive behavior of the laser beam, are unconsidered for further calculations. Thus the surface normals are classified, whereby the number of classes is determined by the number of lines describing the building ground plan.
The left picture of figure 3 shows the surface normals which are split in 8 different-colored classes – in which one of the sides is barely visible, due to its short length. This is often the case in the land register.
Figure 3. classification of a surface normal respectively to one side of the building (left), reduction of the classes to the
distinctive sides of the building (right)
For a realistic roof reconstruction a reduction of these 8 classes is required. If the building ground plan consists of more disruptions, a thereof equivalent number of classes exist. Each breakpoint in the line of the building creates another class. Figure 1 shows that the assumed roof structure consists of two saddle roofs proceeding into each other – therefore of 4 areas. That is why the number of classes is being reduced by an appropriate selection. As decision criteria for class reduction the number of surface normals in a class is used respectively the falling below a certain threshold value. Classes can be deleted if not enough surface normals can be assigned to them. Additionally, it should be preconditioned that the maximum distance for the classification of a surface normal to a side of the building must not be longer than the shortest length of both adjacent sides. In figure 3 the front of the saddle roofs with the dark red and light brown classes are omitted.
Common line sections should be merged, points which are on a line have to be deleted. In figure 3 (left) the light green and the violet lines are merged to a black line (figure 3 right) and assigned to the black class.
Figure 4. Intersection lines per color-coded class (left), overlay of the surfaces with the laser points (right)
After the reduction of the classes an arithmetic mean is calculated for all surface normals of each class. By means of mathematical methods of the descriptive geometry the intersections of the surface normals are calculated. The ridge lines are calculated from intersections between the saddle roofs. The eaves respectively the eaves heights are calculated from intersection of the roofs surface normals with the building walls surface normals. The result is an automatically derived vector model, consisting of four areas. Figure 4 shows the classified and color-coded surface normals (left) respectively the plot of laser points (right) placed over the vector model.
2.2 Semiautomatic realization of the first acquisition
Since LiDAR-data are available Bavarian-wide but a state wide DSM from Matching is not available, the 3D Building Model has to be derived from an existing laser point cloud. The technical realization of the previous described problem of automated roof recognition has often been solved differently by existing software packages of the shelf for the derivation of 3D Building Models.
The approach of the software „Building-Reconstruction“ of Virtual City SYSTEMS (VSC) runs firstly a planimetric fragmentation and then approximates the complete standard roof shape. The roof shape that fits best is applied. Afterwards the roof surfaces of this roof shape are fitted systematically as good as possible. In contrast to many other solutions, VCS meets Bavaria’s required planimetric constancy for buildings of the cadastre. With this it is ensured that no additional data set besides the cadastre is built. In fact, the compliance of the planimetric constancy offers the possibility to fully convert the cadastre to 3D in a more simple form later on.
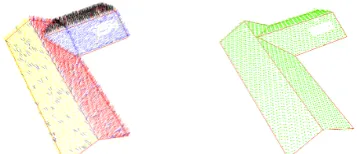
With the applied software the operator has 2 editing windows to his disposal. In a 2D-view the digital orthophoto (DOP) is being overlaid with the planimetry from the cadastre (figure 5, left) and marked with color. Buildings with automatically identified roofs which need no more post-editing are marked in blue. Painted in green are the ones that were already post-edited by the operator. The yellow colored building is the one that is currently in editing. For this building the LiDAR-data and the DTM are loaded in the right editing window in a 3D-view (figure 5, right). With few processing steps the operator adjusts the roof style of the respective building generalized to the laser points with the help of standardized roof structures from a selective list. The result of each processing step is instantly shown in the 3D-view.
Figure 5. DOP with building ground plans (left) and corresponding laser point cloud of a building in yellow which
needs to be edited (right)
The degree of automatic roof recognition can be expressed by the post-editing rate. It is basically dependent on the density and the type of the buildings. In modern cities for example the post-editing rate is only 15 %. The higher the percentage of historical buildings, the lesser the automatic recognition rate of the roofs. The post-editing rate can be between 20 % and 40 %.
The point density of the laser data influences the post-editing
4.8 points per square meter the rate dropped to 16 %.
2.3 Central storage
The data storage is carried out central on a relational database with usage of the open source database solution „3D City Database (3DCityDB)“. With a database scheme (profile) the user has the possibility to create a CityGML conformant data model in the database. The general CityGML profile was further specialized by the AdV for a German-wide standardized acquisition of 3D Building Models. 3D Building models created with this specializations in the AdV-CityGML-profile can be saved with a java based importer and exporter in the database and can be exported and visualized in KML and COLLADA format. Additionally, in Bavaria a FME Workbench is used to offer the users more data export formats like 3D shape, dxf, 3ds and Google sketchup format skp. Since CityGML is an international standard and several software companies have implemented products and interfaces for the geoinformation market a longtime sustainability of this interface can be
3.1 Closing the gap between old LiDAR-data and new built buildings
The airborne laser scanning data gained by statewide LiDAR-campaigns in Bavaria is up to seven years old in particular areas. Beyond that Bavaria is covered with digital aerial photographs in a 3 year cycle. The ground pixel size of the aerial photographs is approximately 0.2m. The oriented aerial photographs are also supposed to be used for the acquisition of the 3D Building Model.
building reconstruction from LiDAR-data, the building ground plans from the land registry, but not the height information from LiDAR-data was available. Since the building ground plans from the land registry usually are more actual than the LiDAR-data, new buildings which were built after the LiDAR- campaign, are the ones which are affected by the timed space closure. Buildings for which, at the time of the first acquisition, height information from LiDAR-data was available, but no building ground plans in the land registry, were not reconstructed.
In order to close the actuality gap of the up to seven years old LiDAR-data within the data capturing of the 3D Building Models, a DSM from image correlation (Image Matching) of aerial photographs from the Bavarian surveying flight is processed. The Bavarian photogrammetric campaign is carried out with an overlap of 75 % in longitudinal and 30 % in cross direction.
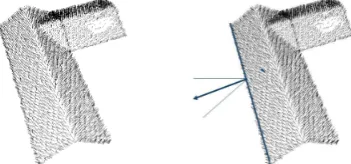
Figure 6. color-coded point cloud from Image Matching
In Bavaria the point density of current LiDAR- campaigns is 4 points per square meter. With Image Matching it is possible to reach a significant higher point density of up to 25 points per square meter due to the ground pixel size of 0.2m of the Bavarian Photogrammetry flights. Currently, the software MATCH-T from Inpho and the Surface Reconstruction (SuRe) algorithm from the Institute for Photogrammetry (ifp) of the University of Stuttgart are used to calculate a DSM on basis of the current Bavarian Photogrammetry flights for several areas of Bavaria (Stolz, 2013). In particular, Image Matching got a significant impulse from Semi-Global Matching (SGM) Algorithm (Haala, 2011).
Figure 7. Differential DSM between Laserscanning and Image Matching – new buildings are painted in red and areas under
construction in violet
The difference between the LiDAR-data processed in 2007 and data from Image Matching from aerial photographs of the Bavarian Photogrammetry campaign in 2012 can be easily presented in a differential-DSM. All changes in height between the years 2012 and 2007, like the growth of the vegetation, the construction and demolition of buildings, excavation pits and earthworks can be visualized with an appropriate color scale. The situation for the maintenance of the 3D Building Model within the timed space closure is as follows: Figure 7 shows a
differential-DSM. Within the marked circle a major change of a building has been identified. Considering the color scale it becomes clear, that it must be a newly built building due to the negative (red) height difference. In this case it is a construction of a shopping center in the year 2009, as it is shown by the comparison of both aerial photographs from 2003 and 2012 (figure 8).
Figure 8. New shopping mall
At the first data acquisition in 2012, a DOP from 2003, LiDAR-data from 2007 and an up to date building ground plan from the cadaster were available. During the first data acquisition, which is described in section 2.2, the operator has to consider the most actual information, which is the building ground plan saved in the cadastre in order to assure building ground plan constancy. Due to missing height information from the LiDAR-data the building is calculated with a standard height of 9 m (figure 9).
Figure 9. Determination of a standard height due to missing LiDAR-data for a new building
Figure 10. Detailed calculation of the roof structure with up-to-date DSM from oriented aerial photographs from the Bavarian
Photogrammetry campaign
The presented method of the timed space closure also allows the post-editing of buildings which were built after the LiDAR-flight to accomplish the first data acquisition of the 3D Building Model of Bavaria at a certain deadline.
3.2 Update within the scope of the continuation of the land registry
Currently the cadastre in Germany is two dimensional. If needed, additional information for the third dimension can be kept as an attribute. With this method the building forming points as „special building points“ with height details and information about the specific roof shape of a certain building can be saved in the cadastre. If the roof of a building consists of multiple roof shapes, these can be divided using construction element creation (Aringer, 2011).
The cadastre in Bavaria currently does not contain such 3D-information yet. After derivation of the standardized roofs of the 3D Building Model with the semi-automated first data acquisition, these data can also improve the two dimensional cadastre. So, a significant added value arises for the cadastre. If this information should be used for updating, the challenge is that the data need to be inversely convertible from the second dimension unambiguously to the third dimension. If multiple roof shapes exist per building ground plan, the principle of the subdivision of buildings in components is used.
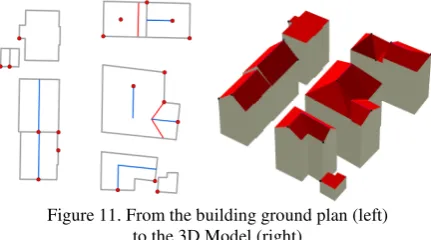
Figure 11.From the building ground plan (left) to the 3D Model (right)
Figure 11 shows buildings with roof shapes which are divided into components by red lines. Blue lines however represent the ridge lines of the roofs. The red points represent ridge and eave points which are attributed as „special” building points with a relative height specification in the cadastre. Together with the ridges and the lines that separate the components a unique reconstruction of the roof geometry from the cadastral two dimensional data is possible. This still needs to be implemented programmatically in Bavaria.
After completion of the first data acquisition and the space closure, the 3D Building Model is continually updated by the regular maintenance of the cadastre in Bavaria. Then neither LiDAR-data nor a DSM from image matching are required, since the cadastral measured building roof shapes are used. If multiple roof shapes for a building exist, these are divided into components. Additionally he ridge lines of a roof shape are calculated as well as the height of selected „special“ building points (ridge and eave points). With this information the third dimension can be reconstructed afterwards and thereby the 3D Building Model can be updated.
Figure 12.Cadastral measurement of a building
4. 4.4.
4. APPLICATIONS
Due to the uniform coloring with red roofs and brown facades the 3D Building Models appear very simple and synthetic. To show potential added value of 3D Building Models, aerial photographs of the buildings facades and roofs were captured by an additional photogrammetric flight. The texturing of the official 3D Building Model of a town was employed to serve as an example. The result is a very photo-realistic 3D Building Model of the town.
Figure 13. 3D Building Model with standardized roofs (left) and textures (right)
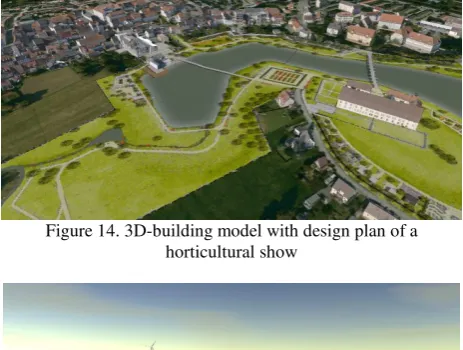
Figure 14. 3D-building model with design plan of a horticultural show
Figure 15. Visualization of a planned wind turbine
5. 5.5.
5. CONCLUSION
The introduced method for the implementation of a statewide 3D-building model extends from the first acquisition to the aimed daily data maintenance. The practical implementation of the used software has already shown good results for derivation and editing of 3D-building models on basis of arbitrary point clouds (Laserscanning and Matching) which are consistent to the building ground plan. The usage of standardized roofs helps to generalize the roofs and to realize a 3D-building model continuously in a reasonable time. The percentage of post-editing is between approximately 15 % and 50 % and is depending on the building density, the difficulty of the area to be edited and the quality of the laser point cloud.
Due to the ground resolution of the aerial photographs of about 0.2m, point clouds from Matching can be created in a resolution of up to 25 points per square meter. Because of the big amount of data for the practical use, a reduction of the point density to 4 points per square meter is sufficient. Ultimately, a significant quality improvement of the cadaster can be achieved by the creation of a statewide 3D-building model with additional inspection and editing of the existing data.
REFERENCES
Aringer, K., Hümmer, F., 2011. Die dritte Dimension im Kataster – Aufbau eines landesweiten Gebäudemodells am
Beispiel Bayerns, Zeitschrift für Geodäsie, Geoinformation und
Landmanagement (zfv), No. 4, pp. 210-218.
Haala, N., 2011. Multiray Photogrammetry and Dense Image Matching, Photogrammetric Week 2011, Wichmann Verlag, Berlin/Offenbach, pp. 185-195.
Rottensteiner, F., Sohn, G., Jung, J., Gerke, M., Baillard, C., Benitez, S. and Breitkopf, U., 2012. The ISPRS Benchmark on Urban Object Classification and 3D Building Reconstruction, ISPRS Annals of the Photogrammetry, Remote Sensing and
Spatial Information Sciences, Volume I-3, XXII ISPRS Congress, 25 August – 01 September, Melbourne, Australia.
Rottensteiner, F., Briese, Ch., 2003. Automatic generation of building models from lidar data and the integration of aerial images. In: International Archives of Photogrammetry, Remote
Sensing and Spatial Information Sciences, Dresden, Germany,
Vol. XXXIV, Part 3/W13, pp. 174-180.
Schilcher, M., Guo, Z., Klaus, M., Roschlaub, R., 1998. Semi Automatic Derivation of 3D-City-Models from existing
2D-Geoinformationsystems, Spatial Information Science and
Technology SIST, 13. – 16. Dezember, Wuhan, China.
Schilcher, M., Guo, Z., Klaus, M., Roschlaub, R., 1999. Aufbau
von 3D-Stadtmodellen auf der Basis von 2D-GIS,
Photogrammetrie – Fernerkundung – Geoinformation (PFG), No. 3, pp. 157-170.
Schilcher, M., Roschlaub, R., 1999. Fortführung und
Wiederverwendbarkeit von 3D-Stadtmodellen durch
Kombination von GIS und Photogrammetrie,
Festschrift aus Anlass des 60. Geburtstags von H. Ebner, TU München, pp. 267 – 281.
Stolz, M., 2013. Digitale Oberflächenmodelle aus
Bildkorrelation, DVW, eingereicht für No. 3.
Vosselman, G., 2002. Fusion of laser scanning data, maps and
aerial photographs for building reconstruction, IEEE