RESEARCH ON ESTIMATION CROP PLANTING AREA BY INTEGRATING THE
OPTICAL AND MICROWAVE REMOTE SENSING DATA
Y. Jia*, F. Yu
Chinese Academy of Surveying and Mapping, Beijing 100830, P. R. China – (jiayi, yufan)@casm.ac.cn
Topics: Multi-source classification and information extraction
KEY WORDS: Optical and microwave remote sensing, Normalization, Bayesian network, Classification, Crop planting area
ABSTRACT:
Considering the problem in monitoring agricultural condition in the semi-arid areas of Northwest of China, we propose a new method for estimation of crop planting area, using the single phase optical and microwave remote sensing data collaboratively, which have demonstrated their respective advantages in the extraction of surface features. In the model, the ASAR backscatter coefficient is normalized by the incident angle at first, then the classifier based on Bayesian network is developed, and the VV, VH polarization of ASAR and all the 7 TM bands are taken as the input of the classifier to get the class labels of each pixel of the images. Moreover the crop planting areas can be extracted by the classification results. At last, the model is validated for the necessities of normalization by the incident angle and integration of TM and ASAR respectively. It results that the estimation accuracy of crop planting area of corn and other crops garden are 98.47% and 78.25% respectively using the proposed method, with an improvement of estimation accuracy of about 3.28% and 4.18% relative to single TM classification. These illustrate that synthesis of optical and microwave remote sensing data is efficient and potential in estimation crop planting area.
1. INTRODUCTION
Agriculture is the basis of China's national economy,
agricultural information monitoring is important for
agricultural production, it is the basis for national
socio-economic information of the people's livelihood [1].
Estimation of Agricultural crop area is one of the key
technologies to monitor the agricultural situation, the
traditional methods is based on a sample survey which is
human-based, point-based data. It spends a lot of money
and has the low efficiency. The survey result is easily
influenced by human factors. Based on the principle of
electromagnetic waves emitted or reflected from an
object on earth observation technology, Remote sensing
technology can provide long-lasting surface information
frequently, with macro, dynamic and accurate monitoring
of the changes of the surface environment. so the use of
remote sensing to establish an objective, dynamic,
real-time, low-cost crop area estimation method is very
significant.
Currently, the theory of estimating crop acreage by
remote sensing data is mainly based on the spectral
theory of green plants, using multi-temporal Landsat
remote sensing data (Landsat TM) and very high
resolution remote sensing data Meteorology (NOAA /
AVHRR), methods there are greenness - phase - area
mode, visual interpretation calculation method, the
combination of remote sensing and statistical methods,
combination of geographic information systems and
remote sensing methods [2-4]. The United States is the
world's first country to estimating crop area by remote
sensing in 1974 through the "large-scale crop yield
estimation experiment" (LACIE), Landsat MSS was used
on wheat acreage estimation with precision up to 90% [5].
Since 1988, the European Union carried out monitoring
the EU's arable land, crop acreage and production using
remote sensing technology through the MARS program,
International Archives of the Photogrammetry, Remote Sensing and Spatial Information Sciences,
and the monitoring results were used for the verification
of the declaration of agricultural subsidies and the reform
of the Common Agricultural Policy [6]. China also
actively carried out the work of Agricultural Remote
Sensing. In 20 mid-1980s, the National Meteorological
Administration estimated the production of northern
winter wheat by NOAA / AVHRR satellite remote
sensing yield over 11 provinces, the standard methods of
estimating crop acreage by remote sensing is established
[7]. Fang Hongliang [8] used supervised classification
and unsupervised classification to extract for rice
planting area by TM satellite data, the accuracy is more
than 84%. Wu Bing-Fang [4] built 'Chinese Agricultural
Information of Remote Sensing Systems' in 1998, the
system used remote cluster sampling and ground surveys
of combining methods to estimate crop acreage, the crop
acreage for bulk extraction accuracy was over 95% in
nationwide.
The above-mentioned method requires more
temporal optical remote sensing data, and optical data is
easily influenced by weather, atmospheric conditions in
the study area are higher, we are often difficult to obtain
a high-quality crop growth phase continuous data. The
radar data can pass through clouds and fog, with the
all-time, all-weather characteristics, information from
different perspectives reflects surface characteristics. If
we combine the optical and radar data together to extract
surface information, it is great significant for improving
the extraction accuracy of crop area.
Based on this consideration, we propose a
single-phase optical radar remote sensing of crop acreage
synergistic extraction method. At first, the incidence
angle of ASAR data is normalized, the backscattering
coefficient were corrected in the same incident standards;
and then a Bayesian networks is build, training areas
were selected. ASAR dual polarization and TM7 bands
were the input data as classification, based on the
classification results to extract crop acreage. With the
support of the measured data, we verified the results.
2. Normalization of the ASAR backscattering coefficient by the incident angle
The incident angle of SAR influences the signal
intensity very much. Backscattering coefficient of the
same object is different at vary incident angles, the
discrepancy in vary situation (such as bare ground or
vegetation-covered areas) shows unlikeness, which is not
conducive to the land surface classification. So in order
to make the surface objects under the uniformity incident
angle standards and compare them, we normalized the
ASAR backscattering coefficient by its incident angle.
2.1 Extrapolation of the optimal incident angle θj for
Normalization
If the range of incident angles are (θ1, θ2) in a SAR
image, we need to find a θj ,which makes the changes of
backscattering coefficient of each pixels after
normalization minimized.
By the Taylor formula, it is possible to extrapolate the
SAR backscattering coefficient to the optimal angle θj,
As θЄ(θ1, θ2), the error Er for choosing θj as the optimal
angle can be written as:
2 2
Where ξis the high-order terms of Taylor formula, when
0
the formula (2) can only be solved, and the solution is θj
= (θ1 + θ2)/2
Previous researches [9] show that the land
vegetation coverage affects the SAR backscattering
coefficient slightly when NDVI<0.45 in C bands, and the
backscattering is mainly composed by direct scattering
International Archives of the Photogrammetry, Remote Sensing and Spatial Information Sciences,
from bare ground. On the contrary, when NDVI>0.45,
the direct scattering of bare ground is less, and the
vegetation scattering plays a leading role. Therefore, it is
necessary to normalize the SAR backscattering
coefficient in bare ground and vegetation-covered areas
respectively.
2. 2 Normalization in bare ground or sparse vegetation
areas
From the previous researches [10], we know that the
simulations of AIEM (Advanced Integral Equations
Model) are identical with the field measurements, so
AIEM is used to estimate the backscattering coefficient
in different surface roughness, soil moisture content, and
incident angles in bare soil or sparse vegetation. The
single backscattering coefficientσpq is given by:
2
surface related to the nth power of the surface correlation
function by the Fourier transforms. kz = kcosθi; ksz =
kcosθs; kx = ksinθicosφ; ksx = ksinθscosφs; ky= ksinθisinφ;
ksy = ksinθssinφs; φ is the incident azimuth angle; θs and φs are the scattering angle and scattering azimuth angle,
respectively; Ipqn is a function of θi, φ, θs, φs, εs, s and the
Fresnel reflectivity.
The input parameters of AIEM are εs which is
calculated by the surface soil moisture mv and soil texture
[11], θi , s, correlation length (l) and the surface
correlation function ρ(x), which is determined by analyzing the surface profile of each site.
In this paper, the simulated inputs of AIEM are set:
C band, VV polarization, and the other input parameters
are as follows (Table 1):
Table 1 The input parameters of simulation by AIEM
Inputs Min Max Step Unit
Soil Moisture mv 5.0% 40.0% 3.0% g/cm3
RMS height s 0.1 4.0 0.25 cm
Correlation length l 5.0 25.0 2.5 cm
Incident
angle θi 15 45 3 °
By analysis of the simulation results, we find
when the roughness is small((s < 2 cm), there are obvious
correlation between the backscattering coefficients (σ(θm)
and σ(θn)) in different incident angles (θmandθn), There
is a good liner relationship between σ(θm) and σ(θn), but
the relationship is unreliable when the (|θm-θn|) rises, if
we try to directly establish the linear relationship
between σ(θi) (θiЄ[15°, 45°]) and σ(θj) (backscattering
coefficients at optimum angle θj), it may cause large
errors, which shows in Fig.1:
Figure. 1 Linear simulation between σ(θj) and σ(θi), θiЄ[15°,
45°]), step 3°
Then, according to the influence of the incident
angles, the cosine and sine of incident angles are adopted
to develop the empirical relationship between σ(θj) and σ(θi), in this paper, θiЄ[15°, 45°], the empirical formula
changes when the rang of incident angles changes. In this
research, θj,= (15°+45°)/2=30°. We can get the values of
the empirical coefficients: a = 1.045, b = 11.82 and c =
International Archives of the Photogrammetry, Remote Sensing and Spatial Information Sciences,
0.004. Fig. 2 is the comparison of normalized
backscattering coefficient σ(θi, 30°) and σ(30°) simulated
by AIEM:
Figure. 2 Comparison of normalized backscattering coefficient σ(θi,
30°) and σ(30°) simulated by AIEM
In Fig. 2, the R2 is 0.9853, and RMS is 0.864dB, it
reveals the normalization formula (4) can gain a good
precision at a large range of incident angles (θiЄ[15°,
45°]).
2. 3 Normalization in vegetation-covered areas
The water-cloud model [13] is introduced to simulated
the backscattering in vegetation-covered areas. In the
water-cloud model, The vegetation is represented as a
homogeneous horizontal cloud of identical water spheres,
the backscattering coefficient of whole canopy σcan is
presented as the sum of the contribution of the vegetation
σveg and the contribution of the underlying soil σsoil,
which is attenuated by the vegetation layer. Multiple
scattering between canopy and soil can be neglected. For
a given incidence angle θi, the backscattering coefficient
is represented in water-cloud models by the general form:
2
( )
( )
( )
( )
can i veg i i soil i
(5)
2
( )
iexp( 2
Bm
v/ cos )
i
(6)
veg( )
i
A
cos (1
i
2( ))
i (7)Where γ2(θi) is the two-way transmissivity of the
vegetation canopy, A and B are empirical coefficient
determined by the vegetation type and the frequency of
incident electromagnetic waves.
In vegetation-covered areas, NDVI>0.45, the total
backscattering mainly consist of the scattering
contribution of the vegetation layer. If the underlying
ground scattering σsoil(θi) is neglected, the γ2(θi) tends to
0, so σcan(θi) = σveg(θi)=Acosθi. Then the normalization
formula in vegetation-covered areas can be expressed as:
cos
( )
( )
cos
j
j i
i
(8)Similarly, the formulas (4) and (8) also can be used at
HH or cross polarization, so we can obtain the
normalization formulas of SAR backscattering
coefficient at all polarization state.
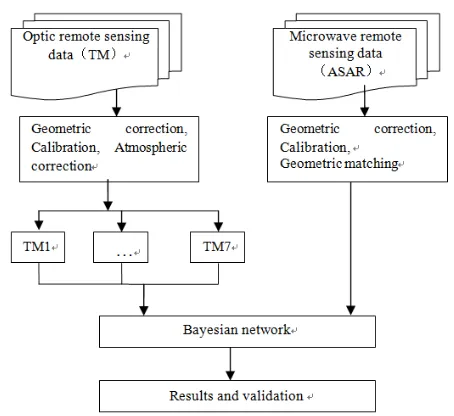
2. 4 Classification method
This paper presents a method based on integration of
both active and passive remote sensing data for
monitoring crop planting area. The experiment is carried
out in Heihe river basin, a semi-arid area in the
north-west of china. This method takes good use of the
advantages from both optical and microwave remote
sensing. The flow chart of the soil moisture extraction
scheme is given in Figure 3.
Figure 3. The flow chart of our method 3. Study area and database
The measures reported in this study are conducted
during the Watershed Airborne Telemetry Experiment.
The study area locates in Grass Station of Lanzhou
University in Zhang Ye district, Gansu province; it is a
part of the low plain of Hexi Corridor. Its geographical
coordinates are 39.25043°N, 100.005871°E, and the
International Archives of the Photogrammetry, Remote Sensing and Spatial Information Sciences,
altitude is 1385 meters. Land use mainly consists of
country, bare salinized land, irrigative agricultural fields,
small piece of desert and proluvium fan. The field
experiment was conducted from June to July in 2008, at
which time the main crops were corn, while wheat, clove,
barley and other crops can also be found.
Satellites over the study area provided TM and
ASAR data on 7 July 2008 and 11 July 2008,
respectively. ASAR (Advanced Synthetic Aperture Radar)
is a synthetic aperture radar carried by the ENVISAT-1
satellite and operates in the C-band (central wavelength
5.63 cm), with multi-polarization, seven observation
angles and five operating modes. In this study, we chose
to use the ASAR data (product code ASAR_APP_1P),
and the operating mode was Alternation Polarization
corresponding to two kinds of polarization (VV and VH)
and high space resolution (12.5×12.5 m per pixel).
4. Results
Two polarizations of ASAR (VV, VH) and all the 7
bands of TM are taken as the input of the classification
experiment, and the multisource images are resample to
30m*30m and geometrically corrected. The study area is
divided to 10 classes, which are bare farmland, corn,
other corps, saline, desert, building, sand, water,
mountain, woodland. When the training and validation
samples are selected, using the method presented in
Section 2.2.2, we can obtain the classification result
which is shown in Figure.4
Figure. 4 The Classification map of study area
In Fig. 4, the basic distribution of oasis is consistent
with feature of the dual ecological environment of
western semiarid regions: ‘water always accompanied
with oasis, desert accompanied with drought.
We counted the classification of images and found
that there were total 1, 008, 575 corn pixels,its planting
area was 1, 008, 575 × 900 = 907,717,500 square meters,
about 1,361,576 acres, nearly 18.16% of the entire study
area. There were 153, 922 pixels for other crops, with an
planting area 153, 922× 900 =138, 529, 800 square
meters,about 207, 795 acres, nearly 2.77% of the entire
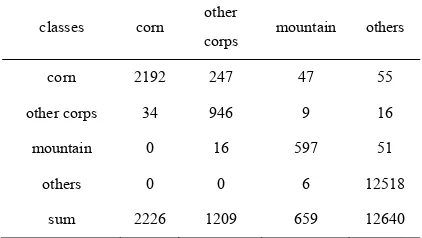
study area. To verify the normalization formula (Eq. (8)
and Eq. (12)) and the necessity of coupling optical radar
data for classification, we respectively compared the
output of the classification of ASAR and TM, using
Bayesian network classifier, with the classification only
by TM. Table 3 presents the statistical errors among the
two methods.
As shown in the Table 2 and Table 3, the accuracy of
classification with single TM is low, and reaches a
classification precision of 89.63%. When the dual
polarization of ASAR data is jointed, the precision
increases to 93.72%. The extraction accuracy of corn and
other crops planted area by proposed method are 98.47%
and 78.25%, with an improvement of estimation accuracy
of about 3.28% and 4.18% relative to single TM
classification. The reasons may be that the ASAR
International Archives of the Photogrammetry, Remote Sensing and Spatial Information Sciences,
information can increase the surface characteristics and
make them easy to distinguish. For example, corn, other
corps, garden and woodland are similar in spectrum, we
can identify them by their various structural features
caught by ASAR signals and finally obtain a better
accuracy. Therefore, the above illustrate that the
normalization and integrating optical and SAR data for
classification are efficient and reliable
Table 2. Classification by single TM
classes corn other
a) Total precision 89.63%;Kappa coefficient 87.9%
Table 3. Classification by combining TM and ASAR
classes corn other
a) Total precision 93.72%, Kappa coefficient 91.07%.
5. Conclusion
1) A new classification model for estimation of crop
planting area by active and passive remote sensing data is
developed in this paper. In the model, the ASAR
backscattering coefficient is normalized by the incident
angle, then a classifier based on the Bayesian theory is
built up, ASAR and TM data are taken as the input of the
classifier and the classification experiment is carried out,
the validation by field measurements shows that:
2) Compared with the Classification accuracy using
single TM, the classification precision of integrating
active and passive remote sensing data increases 4.09%,
it shows comparing ASAR and TM data can present
more information of the objects and increase the
classification precision.
3) The extraction accuracy of corn and other crops
planted area by proposed method are 98.47% and 78.25%,
with an improvement of estimation accuracy of about
3.28% and 4.18% relative to single TM classification.
The results shows the huge potential of crop acreage
extracting by active and passive remote sensing data
References
[1] Yang B. J., 2005. Monitoring agricultural condition by remote
sensing. Beijing: Chinese Agriculture Press, pp. 5 - 6.
[2] Sun J. L., 1996. Crop monitoring and the yield estimating by remote
sensing in China. Beijing: Chinese Science and Techno logy Press,
pp. 12-16
[3] Chen S. p., 1990. The application of remote sensing in agriculture. In:
Chen Shupeng. Probe of geography (Volume 3). Application of
Remote Sensing. Beijing: Science Press, pp. 20-32
[4] Wu B. F., 2000. Operational Remote Sensing Methods for
Agricultural Statistics. ACTA GEOG RAPHICA SINICA, 55(1), pp.
25-35
[5] Donald R. B., Hall F. G., 1980. Global Crop Forecasting. Science,
208, pp. 670-679.
[6] Csornai G., 1999. Operational crop monitoring by remote sensing in
Hungary. Nieuwenhuis, Vaughan &Molenaar Press, pp.20-30
[7] Chen S. B., 1993. Wheat, maize and rice yield estimation techniques
Study Collection. Beijing: Science Press,
[8] Fang H. L., 1998A discussion on two strategies applied to estimate
rice planting area of an administrative division using remote sensing
technique. ACTA GEOG RAPHICA SINICA, 53 (1) , pp. 58 - 65.
[9] Wang C. Z., Qi J. G., Susan M., 2004. Soil moisture estimation in a
semiarid rangeland using ERS-2 and TM imagery. remote sensing of
environment , 90, pp.178-289
[10] Wu T. D., Chen K .S., 2004 A reappraisal of the validity of the IEM
model for backscattering from rough surface. IEEE Transactions on
Geoscience and Remote Sensing, 42, pp. 743-753
[11] Fung A. K., 1992Backscattering from a randomly rough dielectric
surface. IEEE Transactions on Geoscience and Remote Sensing, 30.,
pp.56 – 369
[12] Li Q., Shi J. C., 2002. A generalized power law spectrum and its
applications to the backscattering of soil surfaces based on the
integral equation model. IEEE Transactions on Geoscience and
Remote Sensing, 40, pp. 271-280
[13] Ulaby F. T., Moore R. K., Fung A. K., 1982. Microwave remote sensing. Volume Ⅱ:Radar Remote Sensing and
surface Scattering and Emission Theory. Addison-Wesley Publishing
Company Press, 123-126
International Archives of the Photogrammetry, Remote Sensing and Spatial Information Sciences,