Assessment of soil erosion vulnerability in western Europe
and potential impact on crop productivity due to loss of soil depth
using the ImpelERO model
D. de la Rosa
∗, J.A. Moreno, F. Mayol, T. Bonsón
Instituto de Recursos Naturales y Agrobiolog´ıa de Sevilla (IRNAS), Consejo Superior de Investigaciones Cient´ıficas (CSIC), P.O. Box 1052, 41080 Sevilla, Spain
Received 22 July 1999; received in revised form 13 December 1999; accepted 28 March 2000
Abstract
Soil erosion continues to be a major concern for the development of sustainable agricultural management systems. Sustain-ability modelling analysis for soil erosion must include not only vulnerSustain-ability prediction but also address impact and response assessment, in an integrated way. This paper focuses on the impact of soil erosion on crop productivity and the accommodation of agricultural use and management practices to soil protection. From the Andalucia region in Spain, soil/slope, climate and crop/management information was used to further develop an expert-system/neural-network soil erosion predicting model (named ImpelERO). Based on soil tolerance to water erosion, three regression equations were formulated to examine the effects of soil depth loss on crop productivity reduction. Also, a computerised procedure was developed to find a combination of management practices which would minimise soil loss in each field-unit. The overall approach of ImpelERO was applied in 20 selected benchmark sites from western Europe to quantify the soil erosion vulnerability with several crops, the impact of soil erosion on crop production, and the optimum management strategies. In the Mediterranean sites, soil losses reach an average of almost 50 Mg ha−1per year, the potential impact of soil erosion on the crop productivity was very important (up to 48% reduction in the 2050 time horizon), and the farming practices can be widely modified to protect environmental qualities. The results of this benchmark site analysis of soil erosion, however, must not be extrapolated to large geographical areas without additional spatialisation studies. © 2000 Elsevier Science B.V. All rights reserved.
Keywords: Water erosion; Quantifying soil loss; Crop productivity; Farming by soil; Expert system; Neural network; Andalucia region; Western Europe
1. Introduction
Although soil degradation is generally recognised as a serious and wide-spread problem, its geograph-ical distribution and total areas affected are only roughly known. This redistribution process of soil
∗Corresponding author. Tel.:+34-954-624711;
fax:+34-954-624002.
E-mail address: [email protected] (D. de la Rosa).
within the landscape must be considered by land and water resource managers in order to evaluate the con-sequences of their management decisions. Also, it is necessary to separate the ‘current status’ from the ‘future risk or soil vulnerability’. According to the GLASOD study (Oldeman et al., 1991), which reflects the present status of human-induced soil degradation, about 1.5 billion ha are irreversibly degraded by soil erosion process on a world-wide basis. Soil erosion is an increasing phenomenon in Europe (Blum, 1990).
In parts of the Mediterranean region, erosion has reached a stage of irreversibility and in some places soil erosion has practically stopped through lack of soil. With a very slow rate of soil formation, any soil loss of more than 1 Mg ha−1per year (t ha−1per year) can be considered irreversible within a time span of 50–100 years. Losses of 30–40 Mg ha−1 in individ-ual storms that may happen once every 1 or 2 years are measured regularly in the European Union, with losses of more than 100 Mg ha−1 in extreme events (Van Lynden, 1994). In order to assess future risks of soil erosion, more precise and quantitative informa-tion is needed on the soil attributes, climate variables, present land use and vegetation cover, along with new soil erosion predicting procedures.
These predicting procedures must focus not only on the future risk or vulnerability to soil erosion, but also on the potential impact on crop productiv-ity. The relative productivity of soils and its rate of change due to erosion depend on the presence of favourable rooting characteristics in the soil profile. When a soil comes into production, its productivity may remain at a sustained level for some time. If nutrients are replaced and the soil receives good man-agement, the soil may continue to produce crops at a sustained level for an indefinite period. However, as erosion removes the upper soil profile, productivity will decline if the subsoil is limiting for crop growth. Some land evaluation studies (e.g. Hurtado and De la Rosa, 1982; Pierce et al., 1983) consider long-term changes in soil productivity due to erosion, quanti-fying the change in productivity of different soils, as successive increments of soil depth are lost by erosion.
In recent years, scientists working with new approach in agricultural production: farming by soil, precision agriculture, plot specific management or soil tillage research, have provided new research in-formation on pertinent processes related to soil tillage in order to prevent and reduce soil erosion (Robert et al., 1993; Horn et al., 1998). Agricultural manage-ment operations according to spatially varying land characteristics have the added difficulty of trying to satisfy multiple, and often opposing, objectives; the best soil conditions for plant growth (crop yield) may not be the best for erosion concerns (natural resource conservation) or pollution effect (environmental impact) (Voorhees et al., 1993). In topographically
complex areas, tillage erosion rates appear to be equal or exceed water erosion rates, and soil redistri-bution by tillage contributes to landscape sensitivity to water erosion (Poesen et al., 1990). In any case, soil survey and land evaluation must be the basic building blocks for developing the comprehensive data set needed to drive these specific soil farming studies.
In this paper, an additional development of the re-cently proposed approach for predicting agricultural soil erosion vulnerability in Andalucia region (Im-pelERO model; De la Rosa et al., 1999) was carried out in order to investigate the effects of soil loss on crop yield. Alternative management practices for diminishing soil erosion were also analysed. In addi-tion, the overall approach was applied in 20 selected benchmark sites from western Europe to estimate the agricultural soil erosion vulnerability, along with the potential impact of soil erosion on crop production, and the accommodation of management practices for this vulnerability reduction.
2. Materials and methods
2.1. Study sites, spatial information
The input data considered for the modelling and ap-plication analyses can be grouped in three categories: soil/slope data, climate data and crop/management knowledge. The ImpelERO evaluating unit is the field-unit as a contiguous tract of land (soil/slope and climate) with uniform land characteristics under a specific land use (crop/management). The spa-tial pattern of a field-unit is a parcel, as part of a farm, used in this work as a synonym of benchmark site.
2.1.1. Andalucia agricultural area
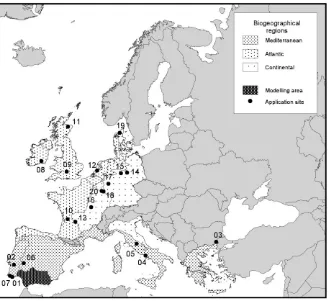
Fig. 1. Location of the modelling area: Andalucia, and the selected 20 benchmark sites for application within the three biogeographycal regions of western Europe.
include soil descriptions and soil chemical and phys-ical properties along with site slope characteristics, were obtained from the SDBm–IRNAS soil database (IRNAS, 1996a).
Representative meteorological stations were also selected from the CDBm–IRNAS climate database (IRNAS, 1996b), analysing monthly mean tempera-ture and precipitation for the 1961–1990 period.
The agricultural management experience for the field-units was captured from the Andalucia farmers with reference to the following traditional crops: rain-fed and irrigated winter wheat (Triticum sp.), rainrain-fed and irrigated winter sugarbeet (Beta vulgaris L.), rainfed and irrigated spring sunflower (Helianthus sp.) and oil and green olives (Olea sp.). The selected field-units cover the whole range of erosion events from what was considered very small to extreme erosion (De la Rosa et al., 1999).
2.1.2. Western European sites
In the application area, western Europe (Fig. 1), soil profiles dataset from the EU 12 Soil Map 1:1 000 000 (CEC, 1985) corresponding to 20 selected benchmark sites in Europe were used (Table 1). These selected benchmark sites correspond to three bio-geographical regions: Mediterranean, Atlantic and Continental. The dominant soils per region are: Luvisols and Vertisols in the Mediterranean region, Cambisols in the Atlantic region, and Cambisols, Phaozems and Luvisols in the Continental region. Slope class and form from the soil map unit of each benchmark site were considered. The flat or almost flat and terraced conditions were the dominant slope characteristics. The greatest variability of slope was found in the Mediterranean region, and the smallest in the Continental region.
D.
de
la
Rosa
et
al.
/Agricultur
e,
Ecosystems
and
En
vir
onment
81
(2000)
were compiled from the World Weather Disc (WDA, 1994). Almost all the climatic data, monthly means of temperature and precipitation, correspond to the 1951–1987 period. Irrigation surplus of water was not considered in any case.
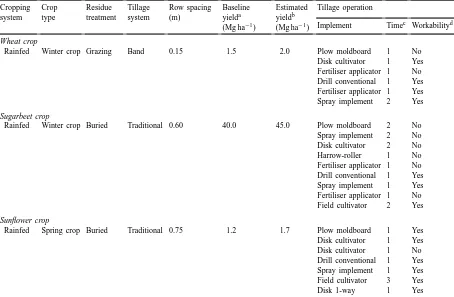
The following cropping systems were considered on the selected application sites: winter wheat, winter sugarbeet and spring sunflower. Table 2 summarises for each cropping system, the agronomic practices which were assumed for all the benchmark sites and used as input data in the ImpelERO model applica-tion. The baseline and estimated yields were used to derive the productivity level. The tillage implements sequence, along with the number of times applied and the workability consideration by the farmer, were also established. These management practices, with special
Table 2
Agricultural management practices for farming the testing crops, and assumed to be used in the selected European benchmark sites Cropping
system
Crop type
Residue treatment
Tillage system
Row spacing (m)
Baseline yielda (Mg ha−1)
Estimated yieldb (Mg ha−1)
Tillage operation
Implement Timec Workabilityd Wheat crop
Rainfed Winter crop Grazing Band 0.15 1.5 2.0 Plow moldboard 1 No Disk cultivator 1 Yes Fertiliser applicator 1 No Drill conventional 1 Yes Fertiliser applicator 1 Yes Spray implement 2 Yes Sugarbeet crop
Rainfed Winter crop Buried Traditional 0.60 40.0 45.0 Plow moldboard 2 No Spray implement 2 No Disk cultivator 2 No Harrow-roller 1 No Fertiliser applicator 1 No Drill conventional 1 Yes Spray implement 1 Yes Fertiliser applicator 1 No Field cultivator 2 Yes Sunflower crop
Rainfed Spring crop Buried Traditional 0.75 1.2 1.7 Plow moldboard 1 Yes Disk cultivator 1 Yes Disk cultivator 1 No Drill conventional 1 Yes Spray implement 1 Yes Field cultivator 3 Yes
Disk 1-way 1 Yes
aMg ha−1corresponds to megagram (t) per hectare; baseline yield is the actual value of crop production from statistical sources. bEstimated yield is the predicted value of crop production by using simulation models.
cNumber of times that an implement is used.
dWorkability status makes reference if (yes or no) the optimum soil water content for each tillage operation is considered by the farmer. reference to the tillage operations, are frequently applied for the selected crops in rainfed conditions.
2.2. Methodology
2.2.1. Soil depth loss and crop productivity
management qualities and one output, vulnerability index to soil erosion.
Crop productivity was calculated by application of the MicroLEIS–ALBERO yield prediction model (De la Rosa, 1996). This soil evaluation model is a re-gression equation to predict winter wheat yield from several soil characteristics. The X-variables are use-ful depth of soil, depth to soil hydromorphic features, soil carbonate content, soil salinity, sodium saturation, cation exchange capacity and clay content.
2.2.2. Management practices accommodation
On the basis of the expert-system/neural-network structure of the ImpelERO model (De la Rosa et al., 1999), a computerised procedure was followed to find an adequate combination of management practices to minimise soil loss for each field-unit (specified climate and soil characteristics). The procedure for-mulates up to 64 different management schemes spe-cific to control erosion. Other management practices which referred to plant growth or pollution impact (e.g. fertiliser, seed and chemical application), were not considered.
This computerised approach of agricultural man-agement strategies on soil erosion reduction is sum-marised in Fig. 2. As a first step and for one particular field-unit (fixed land qualities, LQs), the user can es-tablish a percentage of vulnerability reduction (R) of the actual vulnerability index (Va) in order to calculate the target vulnerability index (Vt). As a second step, 64 applications of the neural-network (four possible values of the three management qualities, MQs,=43) were made in order to calculate the vulnerability in-dex (Vj) which is closer to the target index. Then, the combination of MQs which corresponds to the Vjwas selected. As a third step, the decision trees were back-tracked by using the selected combination of MQs to finally formulate the optimum management strategies.
2.2.3. Computer environment
The computer program to automate the ImpelERO model application includes the additional develop-ment presented in this paper. This software developed in Borland C++builder for running on PC-platform under WINDOWS 95 and NT environment, along with an installation and user guide, may be ob-tained free by visiting the MicroLEIS website http:// www.irnase.csic.es/microlei.htm.
Fig. 2. General scheme of the automated neural-network-based search and the decision trees backtracking to accommodate the management practices (MQs=management qualities) to a percent of soil erosion reduction, where Va=actual vulnerability index, Vt=target vulnerability index, R=desired vulnerability reduction and Vj=possible vulnerabilities for fixed land qualities (LQs).
without additional retraining of the model, would widen the application range to different environments.
3. Results and discussion
3.1. Modelling long-term changes in crop productivity
In this paper, the impact of soil erosion on the crop productivity was analysed as a following step of the prediction modelling of soil loss by water erosion al-ready developed for the ImpelERO model (De la Rosa et al., 1999). Following these predicting procedures, the rate of change of the relative productivity of soils due to erosion can be calculated on the basis that favourable rooting characteristics are present in the soil profile. As erosion removes the upper soil profile, productivity will decline if the subsoil is limiting for crop growth. The effect of diminishing soil organic matter and nutrient contents on crop productivity is not considered in this analysis.
The concept of soil loss tolerance was introduced in order to give a measurement of how much erosion a soil could tolerate before experiencing excessive damage. In general terms, the soil loss tolerance (T value) is defined as the maximum rate of annual soil erosion that will permit a high level of crop produc-tivity to be sustainable. This T value is considered to range from 1 to 10 Mg ha−1per year depending upon intrinsic soil profile characteristics (Larson, 1981). According to the profile characteristics of the dom-inant soils of Andalucia, the soils were grouped as follows:
1. Soil group A (maximum tolerance): corresponds to soils with favourable characteristics to a depth exceeding 120 cm. The deep alluvial soils (Flu-visols) on recent Holocene plains bordering the Guadalquivir River, along with the typical Verti-sols on rolling Tertiary hills, are examples of soils in this group.
2. Soil group B (medium tolerance): corresponds to soils with favourable surface horizons but un-favourable subsoils. The useful depth for crop growth is between 75 and 120 cm often due to fine or coarse texture. Soils developed on Pleistocene terraces (Luvisols, dominantly) exemplify the soils in this group.
3. Soil group C (minimum tolerance): corresponds to soils with favourable surface horizons and consolidated or coarse-fragment (rock or gravel), hydromorphic and/or extremely calcareous sub-soils. The useful depth for crop growth is less than 75 cm. Soils developed on carbonate-rich Ter-tiary sediments and conglomerate formations in Plio-pleistocene surfaces (Regosols and Planosols, dominantly) are examples of soils in this group. Soil erosion at the rate estimated by the ImpelERO model was simulated for four time horizons: current, 2020, 2050 and 2100. Vulnerability index, soil loss and depth reduction rates are facilitated directly by the model application; and the corresponding three soil depth reductions are calculated using the depth reduction rate.
After calculations of soil erosion, crop productivity was calculated at each time horizon by application of the MicroLEIS–ALBERO wheat yield prediction model (De la Rosa, 1996). The predicted yield (PY) was converted to productivity index (Pi) as follows:
Pi= PY
max(PY) (1)
where max (PY) was considered to be 5.5 Mg ha−1. By using this procedure for the four time horizons, the rooting depth moved down the profile as soils eroded, unless some limiting layer occurred in the first 120 cm or until a limiting layer was encountered. For such soils, that portion of the rooting depth below the limiting layer is excluded from the productiv-ity calculation. In other words, the depth of rooting would be less than 120 cm. For soils with undesirable soil characteristics in the lower portion of the profile, productivity declines as erosion proceeds. In contrast, erosion would not likely impair the productive ca-pacity of soils with favourable characteristics in the lower portion of the profile.
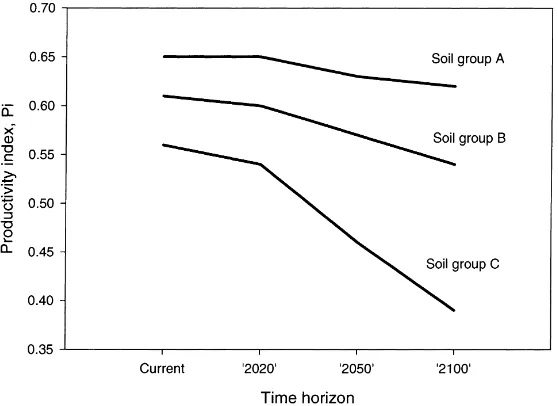
Fig. 3. Productivity changes with the time horizon for the 34 testing field-units in Andalucia region. The average soil loss rates were calculated: 29 Mg ha−1 per year for 13 soils of the group A, 16 Mg ha−1 per year for 10 soils of the group B, and 37 Mg ha−1 per year for 11 soils of the group C.
three simulated time horizons, the regression equation of productivity reduction in percentage (%) versus soil depth reduction in centimetre (cm) is as follows:
Y =0.22X−0.36 (r2=0.92;n=36) (2) For 10 soils with medium tolerance (Fig. 3, soil group B), erosion initially resulted in only slight reductions of productivity. With continued erosion, productivity declined progressively as, for example, roots encounter more and more of the firm, mod-erately permeable material. An initial productivity index of 0.61 was calculated, with a 12% reduction to 0.54 if the average erosion rate of 16 Mg ha−1 per year continued for the next 100 years. Yield reduc-tions were not uncommon as topsoil depth decreased on soils with unfavourable subsoils. For the three simulated time horizons, the regression equation of productivity reduction in percentage versus soil depth reduction in centimetre is as follows:
Y =0.92X−0.07,
r2=0.98;n=30 (3) For 11 soils with minimum tolerance (Fig. 3, soil group C), if erosion occurs, productivity was sustained for a short time, but productivity dropped sharply with continued erosion. It was calculated that if erosion
continued at its current average rate, 37 Mg ha−1per year, the productivity index would drop from 0.56 to 0.39, a loss of 30%, at the time horizon 2100 of sim-ulated erosion. For the three simsim-ulated time horizons, the regression equation of productivity reduction in percentage versus soil depth reduction in centimetre is as follows:
Y =0.97X−0.53,
r2=0.96;n=33 (4)
3.2. Selecting management practices
sur-face roughness: elevate (>25 mm); workability consid-eration: yes; and soil stabilizers: any.
The predicted management schemes were gener-ally in good agreement with results of experimental studies (e.g. De Barros, 1997). This validation test suggests that the management accommodation mod-ule of ImpelERO model could be used by farmers to select the best management practices for efficient erosion control.
3.3. Application analysis
3.3.1. Soil erosion vulnerability
The soil erosion vulnerability results of the applica-tion of ImpelERO model to the 20 selected benchmark sites in Europe for wheat, sugarbeet and sunflower, are
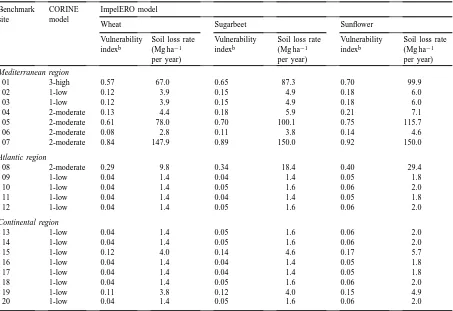
Table 3
Results of the CORINE and ImpelERO soil erosion models application to the selected European benchmark sitesa Benchmark
site
CORINE model
ImpelERO model
Wheat Sugarbeet Sunflower
Vulnerability indexb
Soil loss rate (Mg ha−1 per year)
Vulnerability indexb
Soil loss rate (Mg ha−1 per year)
Vulnerability indexb
Soil loss rate (Mg ha−1 per year) Mediterranean region
01 3-high 0.57 67.0 0.65 87.3 0.70 99.9
02 1-low 0.12 3.9 0.15 4.9 0.18 6.0
03 1-low 0.12 3.9 0.15 4.9 0.18 6.0
04 2-moderate 0.13 4.4 0.18 5.9 0.21 7.1
05 2-moderate 0.61 78.0 0.70 100.1 0.75 115.7
06 2-moderate 0.08 2.8 0.11 3.8 0.14 4.6
07 2-moderate 0.84 147.9 0.89 150.0 0.92 150.0
Atlantic region
08 2-moderate 0.29 9.8 0.34 18.4 0.40 29.4
09 1-low 0.04 1.4 0.04 1.4 0.05 1.8
10 1-low 0.04 1.4 0.05 1.6 0.06 2.0
11 1-low 0.04 1.4 0.04 1.4 0.05 1.8
12 1-low 0.04 1.4 0.05 1.6 0.06 2.0
Continental region
13 1-low 0.04 1.4 0.05 1.6 0.06 2.0
14 1-low 0.04 1.4 0.05 1.6 0.06 2.0
15 1-low 0.12 4.0 0.14 4.6 0.17 5.7
16 1-low 0.04 1.4 0.04 1.4 0.05 1.8
17 1-low 0.04 1.4 0.04 1.4 0.05 1.8
18 1-low 0.04 1.4 0.05 1.6 0.06 2.0
19 1-low 0.11 3.8 0.12 4.0 0.15 4.9
20 1-low 0.04 1.4 0.05 1.6 0.06 2.0
aMg ha−1per year corresponds to megagram (t) per hectare and year.
bVulnerability index ranges: 0.00–0.15=very small, 0.15–0.30=small, 0.30–0.50=moderate; 0.50–0.70=large, 0.70–0.85=very large, 0.85–1.00=extreme.
shown in Table 3. The maximum variability of vulner-ability index, from very small to extreme, is shown in the Mediterranean sites (2.8–150.0 Mg ha−1per year of soil loss rate). Sunflower showed the least protection against soil erosion. In contrast, the Continental sites showed very small risk to soil erosion for most of the benchmark sites and crops (1.4–4.9 Mg ha−1per year of soil loss rate). As validation analysis, these values were rather close to the soil loss average values used by the European Environment Agency (EEA, 1999) in agricultural land of selected countries and during the period 1990–1995: 28 Mg ha−1per year for Spain (Mediterranean country), and 2 Mg ha−1per year for Germany (Continental country).
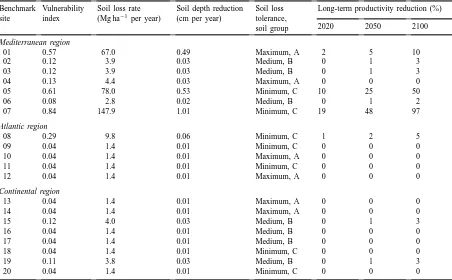
Table 4
Results of long-term productivity reduction predicted by the ImpelERO model, in three simulated time horizons, for winter wheat cropa Benchmark
site
Vulnerability index
Soil loss rate (Mg ha−1 per year)
Soil depth reduction (cm per year)
Soil loss tolerance, soil group
Long-term productivity reduction (%)
2020 2050 2100
Mediterranean region
01 0.57 67.0 0.49 Maximum, A 2 5 10
02 0.12 3.9 0.03 Medium, B 0 1 3
03 0.12 3.9 0.03 Medium, B 0 1 3
04 0.13 4.4 0.03 Maximum, A 0 0 0
05 0.61 78.0 0.53 Minimum, C 10 25 50
06 0.08 2.8 0.02 Medium, B 0 1 2
07 0.84 147.9 1.01 Minimum, C 19 48 97
Atlantic region
08 0.29 9.8 0.06 Minimum, C 1 2 5
09 0.04 1.4 0.01 Minimum, C 0 0 0
10 0.04 1.4 0.01 Maximum, A 0 0 0
11 0.04 1.4 0.01 Minimum, C 0 0 0
12 0.04 1.4 0.01 Maximum, A 0 0 0
Continental region
13 0.04 1.4 0.01 Maximum, A 0 0 0
14 0.04 1.4 0.01 Maximum, A 0 0 0
15 0.12 4.0 0.03 Medium, B 0 1 3
16 0.04 1.4 0.01 Medium, B 0 0 0
17 0.04 1.4 0.01 Medium, B 0 0 0
18 0.04 1.4 0.01 Minimum, C 0 0 0
19 0.11 3.8 0.03 Medium, B 0 1 3
20 0.04 1.4 0.01 Minimum, C 0 0 0
aMg ha−1per year corresponds to megagram (t) per hectare and year.
soils (Table 3). By comparing the two sets of model results, ImpelERO and CORINE, it can be concluded that the use of the more sophisticated ImpelERO model gave more accurate and discriminate results in the three regions and for any given crop.
3.3.2. Impact on crop productivity
Table 4 shows the application results of the Im-pelERO model for each benchmark site, considering the type of soil tolerance (soil group A, B or C) and including the soil loss impact in terms of productivity changes with time horizon (2020, 2050 and 2100). The maximum impact according to the long-term productivity reduction (97%) was shown for the Odiaxere–Albufeira site in the Mediterranean region and for the 2100 time horizon. According to the EEA (1999), the EU Mediterranean countries have severe soil erosion problems, which can reach the ultimate stage and lead to desertification. With the present rates of erosion, considerable areas in these countries
may reach a state of ultimate physical degradation, beyond a point of no return within 50–75 years. Some smaller areas have already reached this stage (Van Lynden, 1994).
In the Atlantic and Continental benchmark sites the potential effects of soil loss reduction on the produc-tivity reduction was very low (0–5%), with maximum value in Vendays–Bordeaux site. In any site as shown in Table 4, the impact of soil erosion on the produc-tivity was low (2–10%) for soils with maximum tol-erance (soil group A).
3.3.3. Accommodation of management practices
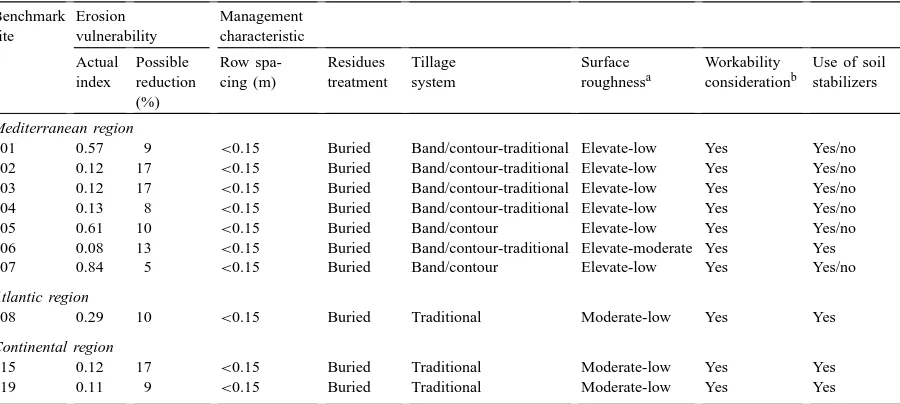
Table 5
Recommended management for winter wheat to reduce soil erosion vulnerability by application of the ImpelERO model Benchmark
01 0.57 9 <0.15 Buried Band/contour-traditional Elevate-low Yes Yes/no
02 0.12 17 <0.15 Buried Band/contour-traditional Elevate-low Yes Yes/no 03 0.12 17 <0.15 Buried Band/contour-traditional Elevate-low Yes Yes/no 04 0.13 8 <0.15 Buried Band/contour-traditional Elevate-low Yes Yes/no
05 0.61 10 <0.15 Buried Band/contour Elevate-low Yes Yes/no
06 0.08 13 <0.15 Buried Band/contour-traditional Elevate-moderate Yes Yes
07 0.84 5 <0.15 Buried Band/contour Elevate-low Yes Yes/no
Atlantic region
08 0.29 10 <0.15 Buried Traditional Moderate-low Yes Yes
Continental region
15 0.12 17 <0.15 Buried Traditional Moderate-low Yes Yes
19 0.11 9 <0.15 Buried Traditional Moderate-low Yes Yes
aSurface roughness is the overall value, expressed in millimetres, determined by the operation number and the random roughness of each operation implement used.
bBased on farmer estimation (yes or no) of the soil workability status to carry out tillage operations.
in the Mediterranean region (5–17% for all the sites), and minimum in the Atlantic region (10% for only Ballypierce–Bunclody site). When the vulnerability index was above 0.29, only a reduction of 10% or less was possible. However, when this index was below 0.12 the reduction increased up to 17%. A reduction was not possible when the vulnerability index was very low (about 0.04).
In general terms, the following fall into the most appropriate management strategies to reduce the soil erosion vulnerability: minimum row spacing, no-treatment and burial of the residues, band or con-tour tillage system, use of tillage implements to ele-vate random roughness, and the practice of tillage at the optimum soil water content range. Formulation of specific crop management for soil protection of each particular site (farming by soil; Robert et al., 1993) is one of the most interesting facilities of the ImpelERO model.
4. Concluding remarks
The effect of soil erosion on crop productivity de-pends to a large extent on intrinsic soil characteristics
present in the Andalucia region. For soils of maximum tolerance which correspond to soils with useful depth exceeding 120 cm, productivity may drop as little as 5%, whereas for soils of minimum tolerance, which correspond to soils with useful depth less than 75 cm, productivity may drop as much as 30% in the time horizon 2100.
Agricultural activities, especially those concerning soil tillage, can be accommodated to reduce soil ero-sion by using expert system/neural-network technolo-gies adapted to erosion prediction risks. An example of these models has been satisfactorily used as an optimisation tool for selecting the land use and man-agement practices for the reduction of soil erosion.
The ImpelERO model gives in the three European regions much more accurate and precise results than the CORINE model. Practical extrapolation of the Im-pelERO model application results to large geographi-cal areas would require future spatial studies.
Acknowledgements
This work was developed as a part of the IMPEL project funded by DGXII of the European Commis-sion, under the Environment and Climate Programme, 1994–1998 (Contract numbers: ENV4 CT950114 and ERB IC20 CT960013; Project Officer: D. Peter; Sci-entific Co-ordinator: M.D. Rounsevell). The English review of the manuscript by V. Castillo is acknowl-edged with gratitude.
References
Blum, W.E.H., 1990. The challenge of soil protection in Europe. In: World Resources Institute, 1991, Accounts Overdue. Oxford University Press, Oxford.
CEC, 1985. Soil Map of the European Communities, Scale 1:1 000 000, 7 Sheets and Explanatory Text. DG Agriculture CEC Publication, EUR 8982, Luxembourg.
CEC, 1992. CORINE Soil Erosion Risk and Important Land Resources in the Southern Regions of the European Community. DG Environment CEC Publication, EUR 13233 EN, Luxembourg.
De Barros, J., 1997. Quantitative analysis of selected land-use systems with sunflower. In: Bouma, J., De la Rosa, D., Driessen, P.M. (Promotors), Doctoral Thesis. Wageningen Agricultural University, Wageningen.
De la Rosa, D. (coord), 1996. MicroLEIS 4.1: Microcomputer-based Land Evaluation Information System. Integrated System for Land Datatransfer and Agro-ecological Land Evaluation. Software+Documentation. CSIC–IRNAS Publication, Sevilla, http://www.irnase.csic.es/microlei.htm.
De la Rosa, D., Mayol, F., Moreno, J.A., Bonsón, T., Lozano, S., 1999. An expert-system/neural-network model (ImpelERO) for evaluating agricultural soil erosion in Andalucia region, southern of Spain. Agric. Ecosyst. Environ. 73, 211–226. EEA, 1999. Environment in the European Union at the Turn
of the Century. European Environment Agency, Office des Publications, Luxembourg.
Horn, R., De la Rosa, D., Rajkai, K., Dexter, T., Simota, C., 1998. SIDASS: a spacially distributed model predicting the dynamics of agrophysical soil state within eastern and western European countries for the selection of management practices to prevent soil erosion. Project work program, INCO-Copernicus IC15-CT98-0106 project, DG XII, CEC.
Hurtado, M., De la Rosa, D., 1982. Impacto de la erosion sobre la productividad agricola de los suelos. CSIC–CEBAC Publication, Sevilla, 128 pp.
IRNAS, 1996a. SDBm–IRNAS. Soil profile database. Land Evalua-tion Group, Sevilla.
IRNAS, 1996b. CDBm–IRNAS. Climate database. Land Evalua-tion Group, Sevilla.
Larson, W.E., 1981. Predicting the soil resource base. J. Soil Water Conserv. 36, 13–16.
Oldeman, L.R., Hakkeling, R.T.A., Sombroek, W.G., 1991. World Map of the Status of Human-induced Soil Degradation, an Exp-loratory Note, 2nd revised Edition. Global Assessment of Soil Degradation (GLASOD), ISRIC, Wageningen UNEP, Nairobi. Pierce, F.J., Larson, W.E., Dowdy, R.H., Graham, W.A.P., 1983. Productivity of soils: assessing long-term changes due to erosion. J. Soil Water Conserv. 38, 39–44.
Poesen, J., Ingelmo-Sanchez, F., Mucher, H., 1990. The hydro-logical response of soil surfaces to rainfall as affected by cover and position of rock fragments in the top layer. Earth Surf. Process. Landforms 15, 653–671.
Robert, P.C., Rust, R.H., Larson, W.E., 1993. Soil Specific Crop Management. American Society of Agronomy, Madison, WI. Van Lynden, G.W.J., 1994. The European Soil Resource: Current
Status of Soil Degradation Causes, Impacts and Need for Action. Council of Europe, Strasbourg.
Voorhees, W.B., Allmaras, R.R., Lindstrom, M.J., 1993. Tillage considerations in managing soil variability. In: Robert, et al., P. (Eds.), Soil Specific Crop Management. American Society of Agronomy, Madison, WI, pp. 95–111.