MODELING AND ACCURACY ASSESSMENT FOR 3D-VIRTUAL RECONSTRUCTION
IN CULTURAL HERITAGE USING LOW-COST PHOTOGRAMMETRY:
SURVEYING OF THE “SANTA MARÍA AZOGUE” CHURCH’S FRONT
Robleda Prieto G. a, *, Pérez Ramos A. a
a
Dept. of Technology and Science of Graphical Representation. University School of Technical Arquitecture – University of La Coruña. Rúa de Rúa da Fraga 27, Campus da Zapateira, 15008 A Coruña, Spain – [email protected]
Commission V, WG V/4
KEY WORDS: Low-cost photogrammetry, Cultural Heritage, Architectonic Rehabilitation, Virtual Reconstruction
ABSTRACT:
Sometimes it could be difficult to represent “on paper" an architectural idea, a solution, a detail or a newly created element, depending on the complexity what it want be conveyed through its graphical representation but it may be even harder to represent the existing reality. (a building, a detail,...), at least with an acceptable degree of definition and accuracy. As a solution to this hypothetical problem, this paper try to show a methodology to collect measure data by combining different methods or techniques, to obtain the characteristic geometry of architectonic elements, especially in those highly decorated and/or complex geometry, as well as to assess the accuracy of the results obtained, but in an accuracy level enough and not very expensive costs. In addition, we can obtain a 3D recovery model that allows us a strong support, beyond point clouds obtained through another more expensive methods as using laser scanner, to obtain orthoimages.
This methodology was used in the study case of the 3D-virtual reconstruction of a main medieval church façade because of the geometrical complexity in many elements as the existing main doorway with archivolts and many details, as well as the rose window located above it so it's inaccessible due to the height.
* Corresponding author.
1. INTRODUCTION
In the labour to collect data to represent architectonic elements, some authors (Scherer, 2002) reduce the acquisition of metric data for graphic representation of cultural and architectural heritage in general, to four methods (traditional, topographic, photogrammetric and scanning), while there are significant differences between them in terms of accuracy, cost and time employee in taking and/or data processing.
In this paper, we try merging the aforementioned methods to obtain a methodology that allows us to obtain results with high accuracy level as are obtained through sophisticated techniques as laser scanner, but less expensive than these: in our 3D-virtual reconstructions we mainly use the photogrammetric software “Agisoft – PhotoScan Professional Edition” (3,499.00 USD = 2,795.31€), a non-professional photographic camera “Canon 600D” including a 18-35mm lens and 32Gb SD-card (499.00 €). To this work equipment, needed tools should be taken into account to collect measure data on site to “scale, rotate and translationate” the virtual model: in our case we use a laser total station “Leica TCR-307” (nowadays phase-out model but similar, as “Leica TS-02”, costs 7,018.00€). Thus, total amount goes from 3,294.00€ to 10,312.00€, depending on using the total station or more traditional techniques to set horizontal and vertical axis to obtain a local coordinate system and control measure differences between reference points and control points. Nevertheless, laser total stations can be rented from 40€/day, so topographical support can be easily assumable.
On the other hand, using laser scanner techniques is much more expensive than aforementioned ones: “Leica C-10” laser scanner (“time of fly” measure system) sale price is over 50,000€ and “Faro Focus 3D” (“phase difference” measure system) is around 34,000€. Point cloud treatment software should be added to these expenses. Renting option is also available in this case: “Leica C-10” rent is 600€/day but other 600€/day (at least one day) corresponding to a specialized operator belonging to the reseller have to be added (requirement imposed by the reseller consulted) including temporary license software, while “Faro Focus 3D” rent is 500€/day with point cloud treatment trial software available.
This cost analysis summarizes why are named “low-cost” the technique introduced by this paper. In addition, unlike laser scan technique, added value is obtained because of we can obtain photorealistic finishes into the same software where point clouds are generated. At the same time, this allows us a visual support in the process of vectorizing complex geometries, because we have the support of the images taken through our non-professional camera and not only coloured point clouds that could not be enough defined.
To show all of this, we use the study case of the 3D-virtual reconstruction of the Santa María de Azogue church’s front in Betanzos, built between the late 14th and early 15th century in Gothic style. It has a main doorway with a semicircular arch richly decorated, above which there is an outstanding rose window. The church is located on English Santiago’s Way, just in the cross of the two branches coming from Ferrol and from
La Coruña that led for many years pilgrims coming from England who landed in the two biggest northern seaports close to Santiago Cathedral. Because of its location, the church was affected by many architectonic influences which translated into a highly decorated and complex geometry that makes using traditional methods to collect data for its graphical representation unuseful so we thought advanced methods were better than traditional ones but without becoming unaffordable and at the same time with accuracy enough.
The 3D-virtual reconstruction accuracy has been assessed through GCP (ground control points) comparing the XYZ coordinates of the points measured on the “real model” with laser total station and the other ones supplied by the photogrammetric reconstruction on the “virtual model” for the homologous points. Previously we had to scale (putting in the same measure both real model and virtual model), rotate (stablishing the axis direction of the reference system) and traslationate (defining the origin of the reference system) the virtual model obtained through GRP (ground reference points) as well measured with laser total station. In this case, we got maximum error of 0.0047m (1.109 pixel), considered low enough to be admitted to obtain orthoimages to use in the surveying of the church.
2. METHODOLOGY AND RESULTS
Departing from the same hypothesis as another studies performed by us (Robleda Prieto G., 2014b) but changing the software used till now (Photomodeler Scanner), we try to validate a photogrammetric virtual recovery methodology by using mainly: a non-professional photographic camera (to take photographs), photogrammetric software running by PC’s (to obtain a 3D virtual model), a total station (to obtain coordinates of some control and reference points) and a tablet (to define unmistakably points to be measured with total station).
In this case, we used an off-the-shelf camera “Canon 600D” with a 18-35mm lens, which was mounted on a tripod in order to obtain the maximum definition as possible and avoid the blurriness due to lack of stability with high shutter speed.
In order to get the most definition and sharpness, the project was divided in two subprojects:
2.1 Subproject “Doorway”
The main door is the most decorated and the major complex geometry element. So photos were taken from the closest distances as possible as to embrace the whole door.
The photos were taken from 9 tripod placements in a way that from each one of those, the camera was focusing towards the same direction which was approximately the doorway centre while the distances from each placement to the door were more or less the same (Cueli J.T., 2011). Thus, we covered all the elements (frontal and jambs) from different angles and, at the same time, the disposition of the tripod placements in arch form (on floor) allows to get more accuracy in the photogrammetric processes performed by the software, because of the convergence of the images (Esmaeili F et al., 2013).
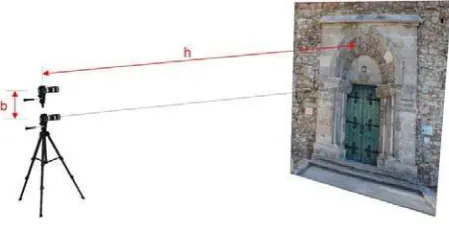
The distance between each placement was approximately in a range of a ratio b/h = 0.10 - 0.15, being “b” the distance from a camera position to the next and “h” the distance to the object
focused. This ensured us to get properly horizontal pairs of images to generate point clouds (Cueli J.T., 2011). Even more, from each settlement, two photos were shot from both positions: one in a height of the tripod used and the other one in a height of the tripod such as ratio "b/h" was kept in a 0.10-0.15 range, which means that distances between settlements were the same than distances between the two different photos taken from a only settlement. Thereby we could obtain not only horizontal pairs of images but also vertical pairs.
Figure 1. Ratio “b/h” in a tripod placement centered relative to the object, to obtain a vertical pair of images.
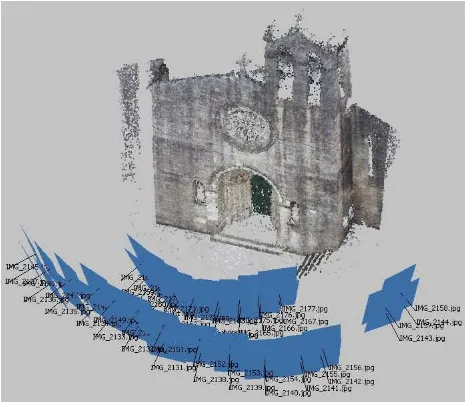
Figure 2. Sparse point cloud of the doorway with all the shootings needed to get both horizontal and vertical pairs.
Related on the shooting, next adjustments were set on manual mode camera (Robleda Prieto G., 2014a): focal length = 18 mm, ISO = 100 (to obtain the maximum sharpness our camera can supply), aperture value = f/11 (to get an optimum depth field without diffraction problems on images), shutter speed = 1/15seg (to balance the lighting level with the ISO choosen: the lower ISO, the more sharpness and the more light needed).
The photos were taken in maximum resolution as possible (5184x3456 pixel) and in RAW format to keep all their properties in the moment of the shoot instead of to use a compression format which could to remove some image information because of the compression processes. Once in the office, the photos were “printed” to JPEG format after to make some little corrections (colour, contrast, etc.) to try equalize image quality between them.
This images in JPEG format, were imported into the “Agisoft – PhotoScan Pro” software (Agisoft, 2015) to obtain point clouds from monoscopic digital multi-images (Hui, 2012) through the photogrammetric processing. But before, images must be
aligned by the software, what means that software must solve how photos are located in the space and in relation with the object to be recovered. In this case we achieved to align all the images, so all the stereo-pairs could be used to get point clouds but software only uses the better stereo-pairs. After this process of aligning, a sparse point cloud with 242358 points was obtained.
2.2 Subproject “General Façade”
In those zones of the façade where geometry is less complex (rectangular ashlars) or in those other not showed into the scene of “Doorway Subproject" (like the Rosewindow)” with the same reasoning than before, 14 tripod placements were performed, all of them located at the same distance from de façade center (more or less) but enough to embrace the façade remaining. Perhaps, we could have subdivided the whole project in another subproject more for the Rosewindow only (in fact, we took more photos as to do it like this), but finally it was no necessary because this subproject including this singular element was considered sharpness enough.
Figure 3. Sparse point cloud of the general façade (doorway zone excluded) with all the shootings needed: 14 tripod placements, two photo from each placement, so 28 images.
The camera settings were similar than the previous subproject: focal length = 18 mm, ISO = 100, aperture value = f/11, shutter speed = 1/13seg.
In a similar way than before, once images were converted from RAW to JPEG format, imported into the software and aligned, a second sparse point cloud was get in this subproject with 267382 points.
2.3 Merged Project
As a result of merging the sparse point clouds of the two subprojects, another sparse cloud was obtained with 507254 points: 242358 points concentrated in the doorway and 267382 belonging to the remaining front façade. Notice that 242,358 plus 267,382 is more (509,740) than 507,254 because of redundant points (very close between themselves) are removed in the merge process.
In the previous subprojects, before aligning images, masks were applied to photographs to avoid parts of the scenes (sky, obstacles, people, etc.) which could produce errors in the process of aligning photos and obtaining sparse point cloud, so the merge cloud hadn’t to be barely cleaned.
Figure 4. Merged sparse point cloud of the whole project with the two sets of tripod placements and all the images (28+18).
In this step Dense Point Cloud could have been obtained but it was considered inopportune until knowing the reliability of the virtual model in terms of accuracy.
2.4 Accuracy assessment
On site, with a laser total station, measurement points were taken in order to assess the accuracy of the recovery model. The laser EDM allows to get distances directly to points located on a surface which can reflect the laser, so with the laser total station we can obtain coordinates X,Y,Z of any point on the façade.
In this case instead of using coded target, we used “natural targets” (any natural mark on the stone façade) to not damage the building. The chosen points must be unmistaken so those can be carefully chosen to be visible in the photographs and perfectly recognizable. To define this points a mobile device (tablet) was used: if a possible “natural target” can be seen in a photo taken with a mobile device it is sure than this point will be seen in a photo taken with a more resolution camera, so the target is marked on the mobile device.
Figure 5. Natural target nº 6: white dot on the granite façade.
Once chosen all the targets, in the same order as defined in the mobile device, points measurements are taken with the laser total station.
Figure 6. Point measurements collected on site with laser total station aided with a mobile device.
This “special” points are usually named GCP (Ground Control Points) but other times those points can be named GRP (Ground Reference Points), depending on this points are used to scale and set the reference system or if they are used for assess the accuracy of the recovery model. In this study case, point n.1 and point n.2 were both considered GRP and these and another eight were GCP.
Table 7. GRP (highlighted in orange) used to rotate the model and to set the origin of local coordinates (see next Fig.) and
GCP used to scale the model and to assess the accuracy.
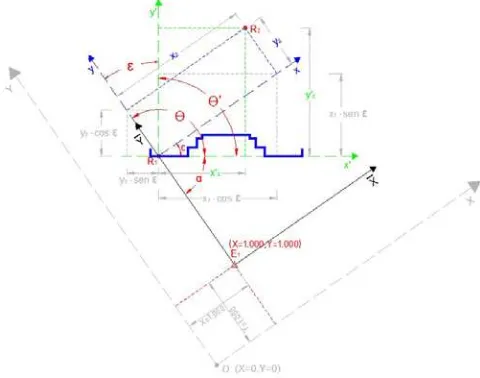
Figure 8. Scheme (floor plan) of arbitrary position and orientation of the total station reference system related with a
building façade (cross section in blue).
It's not possible to place the total station on a point on the façade (the origin of the local reference system) or to place it perfectly orthogonal to the centre of the façade. So we placed the total station anywhere with arbitrary relative coordinates (for example x=1000, y=1000, z=1000) and unknown absolute coordinates (X=?, Y=?, Z=?), and a first point on the façade was chosen to set the origin of angles of total station, because this point will be the local coordinates origin (point n.1, x’=0, y’=0, z’=0) of the model. Then, a second point was also carefully chosen (point n.2) but this had to be a target in the same depth (y’ point n.2 = 0) as the first because it was necessary to estimate the rotation angle: in this case ε = 5.1890º (see Tab. 7 and Fig. 8).
Thus, the GRP, in this case, were P.1 and P.2 (they aided us to reference the model ) but other natural marks clearly visible on the façade were chosen as GCP (point 3 to point 10) to perform the assess of the accuracy. As GRP as GCP were imported into photogrammetric software to scale the model but before this, coordinates obtained from the total station had to be moved from placement station E1 to the local coordinates origin P.1 and after the local coordinate system had to be rotated towards direction P.1–P.2 (see Tab.7 and Fig.8) Then, the assessment of the accuracy were made through GCP, excepting those with a high error (probably due to a bad quality of the target chosen).
Table 9. GRP and GCP imported into “Agisoft – PhotoScan Pro”, used to scale the model and to assess the accuracy.
2.5 Dense Point Cloud, Mesh and Texture
After to assess the accuracy the model was validated because the total error was only 8.7 mm (see Tab. 9), so the processes carried on with getting a Dense Point Cloud of the whole model (merged the two subprojects) 1with 2,423,632 points.
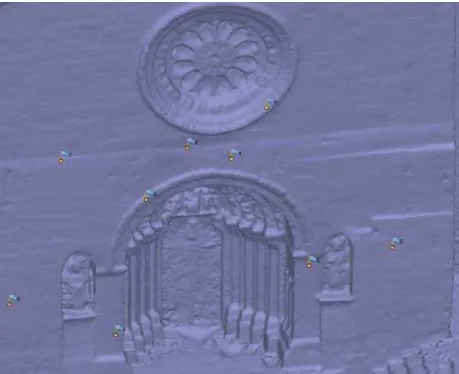
Figure 10. Orthoimage of the Dense Point Cloud of the whole project (2,423,632 points) and the GRP and GCP on it.
Figure 11. Dense Point Cloud detail in orthographic perspective
Next step was to triangulate the dense cloud points to get the Mesh. Which is needed to obtain faces, namely, the DSM
(Dense Surface Model) on which photos are project to obtain the Textured Model.
Figure 12. Mesh (orthographic perspective) generated from the Dense Point Cloud: 218,200 vertex and 431,705 faces.
Figure 13. Mesh detail: vertices are closer each other in zones with more complex geometry so faces are smaller just there.
The triangles of the original mesh would have been very small because vertices coming from Dense Point Cloud were very close each other, so generated mesh was decimated to reduce a little bit the weight of the file and thus can manage the mesh in an easier way. For this, the number of the mesh vertex (218,200) are much less than points of the Dense Cloud (2,423,632). From this resultant final Mesh was get the DSM.
Figure 14. Perspective of the Dense Surface Model (DSM).
At the end of the modelling process, the projection of the images on the Dense Surface Model was done. Having obtained a Mesh with a triangle size small enough on the face made by the DSM of each triangle, the software projects the image more orthogonal to each triangular face, so the smaller triangles and the more photos available, the better.
Figure 15. Orthoimage of the Textured Model obtained by projecting photos on the DSM.
To obtain the correct view (front, top, lateral), orthographic or perspective, is basic the process aforementioned of moving the coordinate system from relative to local as well as to rotate him parallel to an axis contained on the façade. If not, it couldn’t
export the correct view and even it couldn’t assess correctly the accuracy of the model.
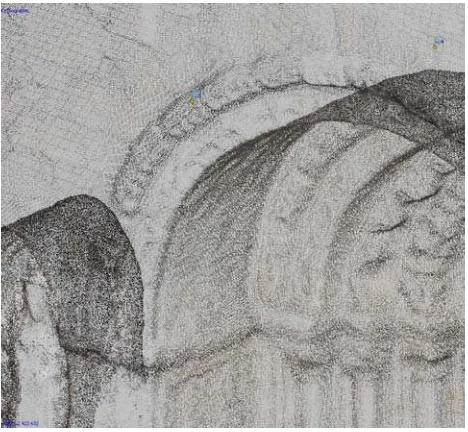
Figure 16. Doorway detail: orthographic perspective of the Textured Model getting from the DSM (from decimated Mesh).
Figure 17. Ortho-perspective: doorway top and rose window.
2.6 Export model, export orthoimages
Having done correctly the process to convert the coordinates system from relative to local, the software used allows easily to export orthoimages of different projection planes.
Figure 18. “PhotoScan Pro” Export Orthophoto window.
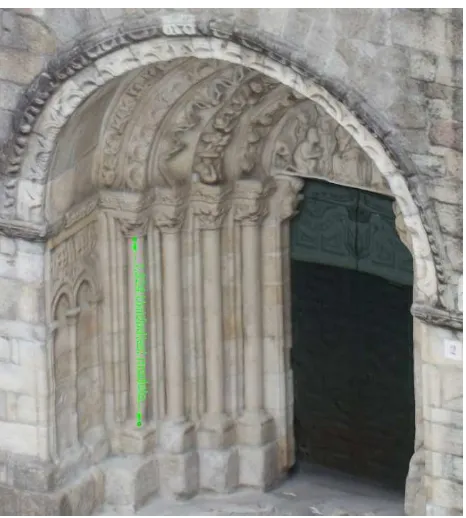
On the other hand, the model could be exported from “Agisoft PhotoScan Pro” to “Adobe PDF 3D” file which allows everybody to explore the model through zoom, rotate and move functions, as well as to get measurements directly from the model (that was exported in a properly scale).
Figure 19. PDF-3D model exported from “Agisoft PhotoScan Pro”: measurement in first left column (annotation in green).
3. CONCLUSIONS
By combining different techniques, mainly topography and photogrammetry, it was possible to obtain dense point clouds of a complex architectonic element that by traditional methods would have been impossible, by inaccessible and complexity.
The reached accuracy was 0.008702m (8.702mm) with a medium error = 0.02972m and maximum error = 0.009369m. It was considered an accuracy enough: being greatest distance between GRP/GRC 7.19m (P.1 and P.9), the accuracy was 0.13% (0.009369/7.19 * 100) = 1.3‰.
The GCP n.10 had to be refused because of his high error (0.02668m), probably due to the long distance to him (at the base of the bell tower) it was necessary the point was visible on photos so this point was so big to obtain better accuracy.
Thus, this methodology can be considered a reliable tool for the graphical representation of architectonic elements (or others) with very complex geometry, and that another sophisticated methods would not be able to adequately solve or they could be unaffordable.
ACKNOWLEDGEMENTS
Liubov Rozhkova (Agisoft Sales manager) and Diana Ovod (Agisoft Tehcnical Support), the first for provide me a educational license of “PhotoScan Pro” and the second for reply all my questions.
Jorge Tomás Cuelli López, for his support, patience, numerous tips, resolution of doubts and lessons given to me along three (or more) last years about digital photogrammetry and photography for digital photogrammetry.
Department of Technology and Science of Graphical Representation (University of La Coruña), to which I belongs as a university teacher, for putting at my disposal available resources.
Department of Representation and Architectonic Theory (University of La Coruña) for lending me a laser total station and a laser distance meter.
REFERENCES
Agisoft LLC. Official website. Saint Petersbourg, Russia. http://www.agisoft.com (22 Jan. 2015).
Cueli López J.T. Fotogrametría práctica (Practical Photogrammetry). Edidiones Tantín. Santander 2011.
Esmaeili F., Varshosaz M., Mamid E., Displacement measurement of the soil nail walls by using close-range photogrammetry and introduction of CPD method. Measurement. 2013, n. 46, p. 3449-3459
Hui B et al. Accurate geometric camera calibration technique using multi-views of a non-metric planar grid. Optic and Lasers in Engineering. 2012, n. 51, p. 432-439.
Robleda Prieto G. Levantamientos Topográficos mediante técnicas fotogramétricas de bajo coste y corto alcance (Topographical Surveys through close-range and low-cost Photogrammetric Techniques). Proceedings of Graphic Expression applied to Building, XII International Conference – APEGA2014. Madrid, Spain.
Robleda Prieto G. Levantamiento Planimétrico de la portada de la Iglesia de Santiago en La Coruña mediante restitución fotogramétrica con métodos de bajo coste (Surveying of
Santiago’s Church Front in La Coruña, through Photogrammetric Restitution with low-cost methods). Proceedings of Graphic Expression applied to Building, XII International Conference – APEGA2014. Madrid, Spain.
Scherer M. About the synthesis of different methods in surveying. Proceedings of CIPA 2002 XVIII International Symposium. pp. 423-429 Postdam, Germany.