SEGMENTATION AND CROWN PARAMETER EXTRACTION OF INDIVIDUAL TREES
IN AN AIRBORNE TOMOSAR POINT CLOUD
M. Shahzad, M. Schmitt, X. X. Zhu
Helmholtz Young Investigators Group SiPEO, Technische Universitaet Muenchen (TUM), Munich, Germany [email protected], [email protected], [email protected]
KEY WORDS:Synthetic Aperture Radar (SAR), Multi-Aspect, TomoSAR Point Clouds ,Trees, 3D Reconstruction, Forested Areas
ABSTRACT:
The analysis of individual trees is an important field of research in the forest remote sensing community. While the current state-of-the-art mostly focuses on the exploitation of optical imagery and airborne LiDAR data, modern SAR sensors have not yet met the interest of the research community in that regard. This paper describes how several critical parameters of individual deciduous trees can be extraced from airborne multi-aspect TomoSAR point clouds: First, the point cloud is segmented by unsupervised mean shift clustering. Then ellipsoid models are fitted to the points of each cluster. Finally, from these 3D ellipsoids the geometrical tree parameters location, height and crown radius are extracted. Evaluation with respect to a manually derived reference dataset prove that almost 86% of all trees are localized, thus providing a promising perspective for further research towards individual tree recognition from SAR data.
1. INTRODUCTION
The analysis of individual trees in remote sensing data until now has mainly focused on the exploitation of aerial imagery or Li-DAR point clouds. In this framework, many studies have been published about the detection and localization of individual trees (Pollock, 1996, Wulder et al., 2000, Leckie et al., 2005, Chen et al., 2006, Chang et al., 2013) as well as the delineation of their tree crowns (Culvenor, 2002, Pouliot et al., 2002, Erikson, 2003, Koch et al., 2006, Jing et al., 2012). In contrast to that, the analy-sis of forested areas on the single-tree level by means of synthetic aperture radar (SAR) remote sensing has not yet met the interest of the community, although modern sensors have reached sub-meter resolutions down to the decisub-meter-range in recent years. However, recently it has been shown that it is possible to gener-ate almost fully layover- and shadow-free point clouds by means of airborne single-pass SAR tomography using millimeterwave sensors (Schmitt and Stilla, 2014). Therefore, in analogy to the approaches based on 3D LiDAR point clouds, in this paper an unsupervised segmentation of the TomoSAR point cloud aim-ing at the reconstruction of individual trees is proposed. While, for example, the studies of (Morsdorf et al., 2004) or (Gupta et al., 2010) are suggesting to employk-means clustering for tree segmentation in LiDAR point clouds, in the presented work the unsupervised mean-shift clustering algorithm is used. This way the need to know the number of expected clusters and an ini-tialization of their centersa prioriis avoided and a fully auto-matic procedure is enabled (Comaniciu and Meer, 2002), which has already been proven for the reconstruction of buildings in To-moSAR point clouds (Shahzad and Zhu, 2015). After clustering, rotational ellipsoids are used to model the individual segments in order to approximate the tree crown shapes. From these ellip-soids the tree positions, heights and crown diameters can be ex-tracted. This tree reconstruction strategy is evaluated using a 3D TomoSAR point cloud, which was generated from airborne mil-limeterwave InSAR data acquired from multiple aspect angles.
2. POINT CLOUD SEGMENTATION BY MEAN SHIFT CLUSTERING
The basis of the method proposed in this paper is the clustering of the 3D TomoSAR point cloud by the mean shift algorithm as
described by (Comaniciu and Meer, 2002). Since the tree crowns generally show a comparably high point density, the points are clustered in the spatial domain, i.e. the feature space is comprised of spatial coordinates in Euclidian space. The kernel density esti-mate at any pointpiof then3D points is given by the expression
Dpi =
wherebis the bandwidth parameter andg(x)is a non-negative, non-increasing, piecewise continuous function with definite in-tegral, i.e. R∞
0 g(x)dx < ∞. Based on the concept of kernels discussed by (Cheng, 1995) and (Comaniciu and Meer, 2002), the functiong(x)is defined as the profile of the radially symmetric kernelG(x)satisfying
G(x) =cg kxk2, (2)
wherecis a normalization constant ensuring thatG(x)integrates to 1. Different kernels, such as the Epanechnikov kernel and the Gaussian kernel can be used to define the densityDpi. Mean
shift clustering essentially seeks modes of the kernel density es-timates and works iteratively by shifting every data point toward the weighted mean of points within its neighborhood (defined to be cylindrical in the presented case). The shift vectorm(pi)
al-ways points towards the direction of the maximum increase in the densityDpiand is computed as
m(pi) =
The iteration process continues until there is no or only little shift in m(pi) anymore, i.e. the length of the shift vectorm(pi)
is close to 0. Due to the gradient ascent nature, the mean shift algorithm returns clusters using the conceptattraction of basin, i.e. those points whose trajectories lead to the same mode form the basin of attraction for that mode and are clustered into one group. The clustering procedure is repeated until all points are assigned to their respective modes.
nor does it need any pdefined model for the shape of the re-sulting clusters. Nevertheless, it still does require a bandwidth parameter (corresponding to the radius of the kernel), which af-fects the number of clusters, i.e. the number of modes, that are returned by the algorithm. However, unlike other clustering algo-rithms such ask-means, fuzzy c-means, expectation maximiza-tion etc., the bandwidth parameter exhibits a physical meaning for variables in spatial coordinates and can be set based on prior knowledge as, e.g., the expected average radius of the tree crowns in the scene.
3. ROBUST MODELING OF ELLIPSOIDIC TREE CROWNS
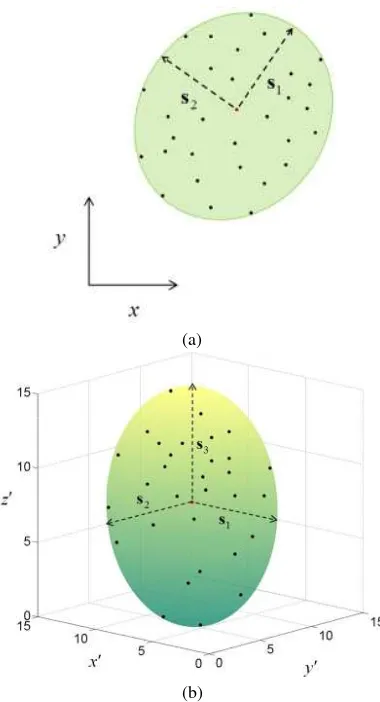
Since three-dimensional rotational ellipsoids can be seen as a good approximation of deciduous tree crowns, the individual tree clusters are modeled using generalized tri-axial ellipsoids. For this purpose, parameters of an arbitrarily oriented minimum vol-ume enclosing ellipse (MVEE) are estimated by first projecting points belonging to individual tree clusters onto thexy-plane fol-lowed by extruding the 2Dxy-ellipse inz-direction to form a 3D ellipsoid. The motivation for expanding the ellipsoid along the z-axis is based on geometrical considerations: It is assumed that correct tree models may have an arbitrary orientation in the xy-plane, but remain upright or vertical with respect to the ground (cf. Fig. 1). This is based on the light prior that tree trunks are modeled to be vertical to the ground surface.
Computation of the MVEE
If K = {ki|i = 1, . . . , m} denotes m clusters returned by
the mean shift algorithm, and Q = {qu|u = 1, . . . , r}
de-notes the set ofrpointsqubelonging to a particular clusterkf
(f∈i), then any arbitrarily oriented ellipseεcan be a candidate for MVEE(Q), if and only if all points inQlie on or inside its boundary, i.e. if the following condition is satisfied (Kumar and Yildirim, 2005):
qu−ckf T
A qu−ckf≤1 foru= 1, . . . , m. (4)
In this equation,Ais ad×dpositive definite matrix, whered refers to the dimension 2 in the presented case, andckfis the
cen-ter of the ellipse surrounding the cluscen-tered pointsQ. The semi-axessiof such an ellipse are given as
si=λ−
1 2
i vi, (5)
wherevidenote the eigenvectors ofA, which correspond to the
directions of the semi-axes. λi denotes the eigenvalues ofA,
which are related to the length of these axes: The length of each axis is equal to √1
λi
. The area of an ellipse or volume of an
ellipsoid, respectively, is thus directly proportional todet 1 √ minimized such that (4) is satisfied in conjunction withAbeing positive definite. In order to solve this minimization, Khachyan’s first order algorithm is used, which formulates the problem as optimization using Lagrangian duality (Khachiyan, 1996).
The computed MVEE(Q) is extended to the third dimension by extruding it inz-axis in order to form a 3D ellipsoid. The z-coordinate of the ellipsoid center and its semi-axis lengths3in
(a)
(b)
Figure 1. Illustration of the ellipsoid modeling: (a) MVEE com-puted using 3D points projected onto thexy-plane;s1ands2are the computed semi-axes of the MVEE. (b) The MVEE of (a) is extruded inz-direction both upwards and downwards forming a 3D ellipsoid with a third semi-axis denoted ass3. x′,y′andz′ in (b) represent axes of the local coordinate system aligned to the ellipsoid semi-axes. The red points in both (a) and (b) represent the ellipsoid centersckf.
z-direction are estimated by
heights and theN largest heights of all points in the clusterkf,
respectively.
4. EXPERIMENTS AND RESULTS
4.1 Test and Reference Data
The input data for the experiments presented in this paper is a multi-aspect TomoSAR point cloud generated from an airborne millimeterwave SAR dataset acquired during a flight campaign over the city of Munich, Germany, in 2013 (Schmitt and Stilla, 2014). Using two opposing viewing directions, four images from four simultaneously receiving antennas per pass, and a discretiza-tion of 50 cm×50 cm×50 cm during processing, the resulting 3D point cloud consists of about 1.66 mio. points, corresponding to an average point density of about 22 points/m2. As comparison to helicopter-borne LiDAR point cloud showed (point density ca. 3 points/m2
), the three-dimensional localization accuracy of the TomoSAR points lies between 0.7 m and 1.4 m – negatively bi-ased by systematic errors in the comparison due to different point densities.
The test scene consists of the “Alter Nordfriedhof”, an abandoned cemetery, which is used as a public park today. As can be seen in Fig. 2, it is mainly characterized by a light planting of deciduous trees, resembling a grove or little wood. The TomoSAR point cloud is displayed in Fig. 3 (a).
Figure 2. Orthophoto of the test scene “Nordfriedhof” in Munich, Germany.
As a reference dataset, a helicopter-borne LiDAR point cloud containing approximately 0.16 mio. points (i.e. 3 points/m2
) in conjunction with a co-registered orthophoto was analyzed by a human operator, who extracted tree positions, diameters and heights manually. The result can be seen in Fig. 4. In total, the reference consists of 570 trees with average height of 14.56 m (median) or 12.33 m (mode), respectively, and an average radius of 3.70 m (median) or 3.32 m.
4.2 Clustering Results
Fig. 5 compiles the clustering results for varying kernel band-width parameter. Obviously, the optimal bandband-width parameter is 3.2 m, giving an optimal detection of 70.88% of the trees, plus oversegmented detections (i.e. more than one cluster center for a reference tree) at the rate of 14.91%. Thus, in total 85.79% of all reference trees are discovered, only 14.21% are missed. In this context, it is interesting to note that while the median tree radius of the reference trees is 3.70 m, the mode of the tree radii is 3.32 m. That means that only light prior knowledge about the expected tree radii of the scene of interest is sufficient to tune the clustering process, while keeping it otherwise fully unsupervised.
The result of the mean shift clustering of the point cloud with the thus-determined bandwidth parameter of 3.2 m is displayed in
(a)
(b)
(c)
Figure 3. The scene shown in different processing stages: (a) The 3D point cloud as derived by multi-aspect TomoSAR data fusion; (b) the clustered point cloud; (c) the reconstructed tree models.
Fig. 3 (b). It can be seen that the points have been segmented into 595 clusters, which already resemble individual trees by visual impression.
4.3 Ellipsoid Modelling Results
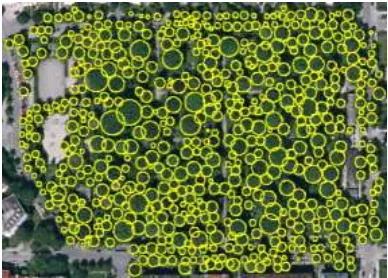
The final result of the ellipsoid modeling process can be assessed in Fig. 3 (c), including tree crowns of different shape and hypo-thetical stem positions. A projection of the ellipsoids onto the 2D reference data is shown in Fig. 6. A summary of the tree param-eter reconstruction errors is given in Tab. 1. In addition, the error distributions for tree heights and crown radii are shown in Fig. 7.
Figure 5. Determination of the optimal bandwidth parameter by analysis of tree segmentation accuracy for all 570 reference trees. Green indicates perfect matches of one cluster to one reference tree, red missed reference trees. Blue indicates oversegmented reference trees, i.e. reference trees which are connected to at least two cluster centers.
Figure 6. Ellipsoid models projected onto the 2D reference dataset for one-to-one comparison.
5. DISCUSSION
Although the results of this study are already very promising, they also show there is still room for further improvement: First of all, it is obvious that the clustering is dependent on choosing the opti-mal bandwidth parameter. Although this can be handled by using some light prior knowledge, an adaptive setting of the bandwidth parameter could possibly enhance the segmentation accuracy, in particular concerning the case of oversegmented trees. Secondly, the ellipsoid model of course is only a coarse approximation of real-life tree crowns, and only useful for deciduous trees at that. Here, e.g. a generalized ellipsoid model also accounting for vary-ing crown curvature could help to create a more universal ap-proach and more detailed results. In addition, a more robust es-timation of the tree heights and the crown radii is expected to reduce the over-estimation bias in these parameters significantly.
Concerning the number of missed trees, there is unfortunately al-ways the sensor-inherent limitation: If a small tree is surrounded by large trees on all sides, not even multi-aspect SAR data will
MAE
Height 2.64 m
Radius 0.72 m
2D localization 1.43 m
Table 1. Mean absolute errors (MAEs) of reconstructed tree pa-rameters.
(a)
(b)
Figure 7. Distributions of (a) the tree height errors and (b) the crown radii errors. It can be seen that both tree heights and crown radii tend to be slightly overestimated.
help to avoid missing that tree due to the side-looking nature of the SAR imaging process. In such a case, only approaches based on volume tomography might provide a viable solution.
Last but not least, it has to be mentioned that the reference data also provides some potential for erroneous modeling, since no analysis of any kind of data can replace in-situ observations. For example, the smallest tree in the reference data is only 0.25 m high, i.e. in a real ground truth dataset, it would possibly not have been included at all.
6. CONCLUSION
the side-looking SAR imaging geometry serves as a system-inherent limitation and leads to the fact that particularly small trees fully surrounded by large trees will always be missed, the results pre-sented in this paper are expected to further stimulate the research interest in exploiting SAR imagery for forest remote sensing on the individual tree level.
REFERENCES
Chang, A., Eo, Y., Kim, Y. and Kim, Y., 2013. Identification of individual tree crowns from LiDAR data using a circle fitting algorithm with local maxima and minima filtering.Remote Sensing Letters4(1), pp. 30–38.
Chen, Q., Baldocchi, D., Gong, P. and Kelly, M., 2006. Isolating indi-vidual trees in a savanna woodland using small footprint LiDAR data. Photogrammetric Engineering & Remote Sensing72(8), pp. 923–932.
Cheng, Y., 1995. Mean shift, mode seeking, and clustering.IEEE Trans-actions on Pattern Analysis and Machine Intelligence17(8), pp. 790–799.
Comaniciu, D. and Meer, P., 2002. Mean shift: a robust approach to-ward feature space analysis.IEEE Transactions on Pattern Analysis and Machine Intelligence24(5), pp. 603–619.
Culvenor, D. S., 2002. TIDA: an algorithm for the delineation of tree crowns in high spatial resolution remotely sensed imagery.Computers & Geosciences28(1), pp. 33–44.
Erikson, M., 2003. Segmentation of individual tree crowns in colour aerial photographs using region growing supported by fuzzy rules. Cana-dian Journal of Forest Research33(8), pp. 1557–1563.
Gupta, S., Weinacker, H. and Koch, B., 2010. Comparative analysis of clustering-based approaches for 3-D single tree detection using airborne fullwave LiDAR data.Remote Sensing2(4), pp. 968–989.
Jing, L., Hu, B., Li, J. and Noland, T., 2012. Automated delineation of individual tree crowns from LiDAR data by multi-scale analysis and segmentation.Photogrammetric Engineering & Remote Sensing78(12), pp. 1275–1284.
Khachiyan, L., 1996. Rounding of polytopes in the real number model of computation.Mathematics of Operations Research21(2), pp. 307–320. Koch, B., Heyder, U. and Weinacker, H., 2006. Detection of individual tree crowns in airborne LiDAR data. Photogrammetric Engineering & Remote Sensing72(4), pp. 357–363.
Kumar, P. and Yildirim, E., 2005. Minimum volume enclosing ellipsoids and core sets. Journal of Optimization Theory and Applications126(1), pp. 1–21.
Leckie, D. G., Gougeon, F. A., Tinis, S., Nelson, T., Burnett, C. N. and Paradine, D., 2005. Automated tree recognition in old growth conifer stands with high resolution digital imagery. Remote Sensing of Environ-ment94(3), pp. 311–326.
Morsdorf, F., Meier, E., Ktz, B., Itten, K. I., Dobbertin, M. and Allgwer, B., 2004. LiDAR-based geometric reconstruction of boreal type forest stands at single tree level for forest and wildland fire management. Re-mote Sensing of Environment92(3), pp. 353–362.
Pollock, R. J., 1996. The Automatic Recognition of Individual Trees in Aerial Images of Forests Based on a Synthetic Tree Crown Image Model. PhD thesis, The University of British Columbia.
Pouliot, D., King, D., Bell, F. and Pitt, D., 2002. Automated tree crown detection and delineation in high-resolution digital camera imagery of coniferous forest regeneration. Remote Sensing of Environment82(2-3), pp. 322–334.
Schmitt, M. and Stilla, U., 2014. Generating point clouds of forested areas from airborne millimeterwave InSAR data. In: Proceedinigs of IEEE International Geoscience and Remote Sensing Symposium, pp. 1– 4.
Shahzad, M. and Zhu, X., 2015. Robust reconstruction of building fa-cades for large areas using spaceborne TomoSAR point clouds. IEEE Transactions on Geoscience and Remote Sensing53(2), pp. 752–769.
Sheng, Y., Gong, P. and Biging, G. S., 2001. Model-based conifer-crown surface reconstruction from high-resolution aerial images. Photogram-metric Engineering & Remote Sensing67(8), pp. 957–965.