ACCURACY ASSESSMENT OF PROFESSIONAL GRADE UNMANNED SYSTEMS FOR
HIGH PRECISION AIRBORNE MAPPING
M. M. R. Mostafa
Microdrones, 2911 Rue Du Meunier, Vaudreuil-Dorion, J7V 8P2 Quebec, Canada – [email protected]
KEY WORDS: UAV, Unmanned Systems, Camera, GNSS, Inertial, Photogrammetry, Airborne, mapping, Orthophoto, DSM, Georeferencing, Accuracy, Calibration
ABSTRACT:
Recently, sophisticated multi-sensor systems have been implemented on-board modern Unmanned Aerial Systems. This allows for producing a variety of mapping products for different mapping applications. The resulting accuracies match the traditional well engineered manned systems. This paper presents the results of a geometric accuracy assessment project for unmanned systems equipped with multi-sensor systems for direct georeferencing purposes. There are a number of parameters that either individually or collectively affect the quality and accuracy of a final airborne mapping product. This paper focuses on identifying and explaining these parameters and their mutual interaction and correlation. Accuracy Assessment of the final ground object positioning accuracy is presented through real-world 8 flight missions that were flown in Quebec, Canada. The achievable precision of map production is addressed in some detail.
1. INTRODUCTION
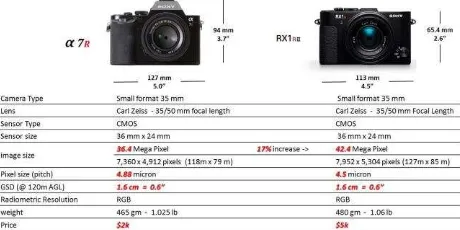
Eight flights have been flown using Microdrones mdMapper1000DG equipped with Sony RX1RII and Sony αR7 integrated with Trimble APX-15 as shown in Figure 1 and Figure 2. The flights took place in Montreal, Canada on September 20th, 2016.
Figure 1: Microdrones mdMapper1000DG
Figure 2: Camera Configuration and Specifications
Multiple flight heights were flown in order to examine the different Ground Sample Distance (GSD) effect on geometric accuracy. All flights have been flown at an 80x80 overlap/sidelap. They were reduced to 80x60, 80x40, and 60x40
at the processing stage in order to examine the effect of overlap/sidelap on geometric accuracy.
Figure 3 Base Station location in the proximity of the Area of Interest (AOI)
A new dedicated base station was accurately established 900 m away from the centre of the Area of Interest (AOI) as shown in Figure 3. Additionally, CORS stations where used for accuracy and Quality Control Purposes. Furthermore, the Canadian Spatial Reference System (CSRS) online processing tool was used. The new base station was used to establish 14 Ground Control Points (GCP’s) as well as being used as the main base station for all the flights. This guaranteed that all the positional components of the entire test flights including trajectory and GCP’s are referenced to the same basestation. All GCP’s have been accurately established and signalized using geodetic GNSS receivers coupled with Geodetic antennas for multipath mitigation and proper noise and antenna phase centre handling.
The GNSS data acquisition technique was designed in order to achieve the best possible positioning accuracy of the GCP’s. A total of 891 configurations were used for data processing. A summary of the results is presented in this paper. The conclusions and recommendations for this paper summarize the findings from the analysis done herein.
2. THE BASE STATION
The base station is a critical component for accuracy assessment. Therefore, the following configuration has been devised in order to achieve the project goals, including: The base station is used for both flights and for
establishing the Ground Control Points (GCP’s)
The base station must have a geodetic accuracy in an absolute sense that is equivalent or higher to the highest resolution of the data acquired in this project
The base station coordinates must be computed independently from multiple sources in an absolute sense in order to confirm their validity.
As a result the base station has been established within 1 km of the Area of Interest (AOI) as shown in Figure 3.
The Base station data acquisition has been done using Trimble BD930 GNSS receiver equipped with a Zephyr II Geodetic antenna for multipath mitigation purposes. A double-clamp heavy duty tripod has been also used in order to avoid any small motion of the tripod during the long hours of data acquisition. Sand bags have been used to secure the legs of the tripod in order to avoid any motion because of winds during any of the base station data acquisition sessions.
Table 1: Base Station Date Acquisition Sessions
ID Session Date GPS Local Time Duration acquisition time durations while Figure 4 shows their location relative to the AOI.
Figure 4: Base Station Location Relative to Cansel Permanent Tracking GNSS Stations
The aforementioned Base Station data has been processed 8 different times using different configuration. The Average coordinates of the eight processing results was used as a reference. The statistics of the residuals for the eight solutions compared to the reference are listed in Table 3.
Table 2: SHER & DRUM Data Acquisition Timing
ID Session Duration Comments
[hh:mm:ss] observation configuration have been designed in order to satisfy a number of conditions, including:
GCP coverage for different testing scenarios including different image strips, blocks, etc.
Highest possible absolute positioning accuracy
Figure 5: Ground Control Point Layout
A total of fourteen (14) Ground Control Points (GCP’s) were established in the DOMTAR test flight area as shown in Figure 5.
All GCPs were painted on the ground as shown in Figure 6. The data acquisition configuration was devised to collect data in a static mode at each GCP.
The project base station was simultaneously and continuously collecting GNSS data during the entire GCP data acquisition time.
Figure 6: Ground Control displayed on Imagery
Table 4: GCP Statistics
ID RMS
Easting [m]
RMS Northing [m]
RMS Height [m]
GCP01 0.007 0.009 0.018
GCP02 0.007 0.008 0.013
GCP03 0.006 0.011 0.017
GCP04 0.006 0.009 0.017
GCP05 0.006 0.010 0.016
GCP06 0.007 0.009 0.012
GCP07 0.006 0.009 0.012
GCP08 0.005 0.007 0.014
GCP09 0.007 0.009 0.013
GCP10 0.006 0.009 0.017
GCP11 0.007 0.015 0.018
GCP12 0.006 0.009 0.014
GCP13 0.006 0.009 0.012
GCP14 0.011 0.020 0.032
4. ACCURACY ASSESSMENT RESULTS
This Section is dedicated to briefly demonstrate the accuracy assessment results using different flights flown in this project.
Each flight contained an average of twenty image strips and 30 images per strip to cover the entire Area of Interest at a certain flight altitude. In order to produce multiple image blocks and multiple overlap/sidelap combinations, the following was carried out:
A number of 4-strip blocks have been extracted from the data
Different levels of overlap and sidelap have been extracted from the data
This resulted in a variety of 4-strip blocks with different levels of overlap and sidelap at two different flight altitudes; namely 60m and 120 m, respectively. Some flights have been flown using Microdrones new gravity-based Nadir mount that is designed to allow for roll and pitch real time compensation while other flights have been flown using a fixed mount. The effect of these two mounts is also analysed.
Further, two cameras have been flown namely, Sony a7R and Sony Rx1RII. The latter has better weight, power consumption and ground coverage. The effect of the two cameras on the results is also analysed. Camera lab calibration versus airborne calibration is also analysed.
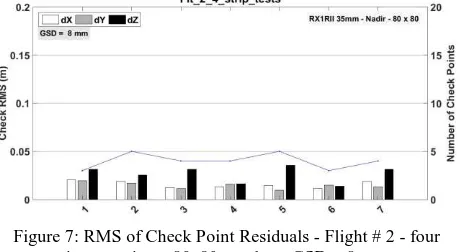
Figure 7 shows the RMS of Check Point Residuals for flight # 2 flown at 60 m Above Ground Level (AGL) which when coupled with the RX1RII 35 mm focal length resulted in a Ground
Sample Distance (GSD) of 8 mm. Seven 4-strip blocks are shown in Figure 7 extracted from flight # 2 at 80x80 endlap/sidelap. Figure 8 shows the same results at 80x40 endlap/sidelap.
Figure 7: RMS of Check Point Residuals - Flight # 2 - four image strips - 80x80 overlap - GSD = 8 mm
Figure 8: RMS of Check Point Residuals - Flight # 2 - four image strips - 80x40 overlap - GSD = 8 mm
Figure 9 and Figure 10 show the RMS of Check Point Residuals for 3-strip blocks at 80x80 and 80x40 endlap/sidelap.
Figure 9: RMS of Check Point Residuals - Flight # 2 - Three image strips - 80x80 overlap - GSD = 8 mm
Figure 10: RMS of Check Point Residuals - Flight # 2 - Three image strips - 80x40 overlap - GSD = 8 mm
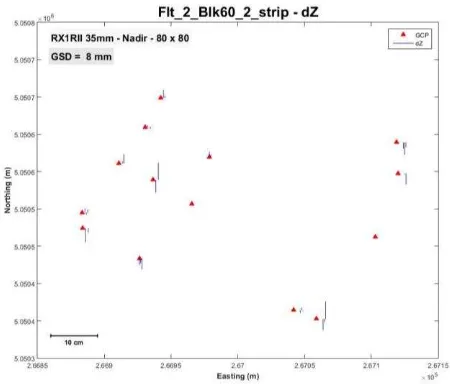
Figure 11 and Figure 12 show the RMS of Check Point Residuals for 2-strip blocks at 80x80 and 80x40 endlap/sidelap. Figure 13 shows the planar pictorial plot depicting the horizontal residuals of the check point residuals for the 2-strip block at 80x80 overlap/sidelap. Similarly, Figure 14 shows the same plot for the vertical residuals of the check point for the same 2-strip block at 80x80 overlap/sidelap.
Figure 11: RMS of Check Point Residuals - Flight # 2 - Two image strips - 80x40 overlap - GSD = 8 mm
Figure 12: RMS of Check Point Residuals - Flight # 2 - Two image strips - 80x40 overlap - GSD = 8 mm
Figure 13: Horizontal (X & Y) Check Point Residuals - Flight # 2 - Two image strips - 80x80 overlap - GSD = 8 mm
Figure 14: Vertical (Z) Check Point Residuals - Flight # 2 - Two image strips - 80x80 overlap - GSD = 8mm
Figure 15 shows lens distortion differences when in-flight calibration is done. The differences shown are between the lens distortion profiles calibrated using different 4-strip blocks of flight 2.
Figure 15: Radial Lens Distortion Difference between sub-blocks - Flight 2 (4-strip sub-blocks 80x40 overlap)
The above listed accuracy figures addressed an AGL of 60 m and a GSS of an 8 mm. Figure 16 shows the accuracy of a 3-image block flown at 120 m AGL resulting in a GSD of 16 mm.
Figure 16: RMS of Check Point Residuals - Flight # 1 - Three image strips - 80x80 overlap - GSD = 16 mm
CONCLUSIONS
The results presented in the preceding Section are interpreted in order to draw the following conclusions,
Using 2, 3, or 4 strips of image blocks always lead to an accurate image georeferencing resulting in ground object positioning accuracy of about 2 cm (2-3 pixels) in horizontal and about 3-4 cm (4-5 pixels) in height absolute accuracy when independently evaluated using Check Points.
2-strip blocks resulted in a repeatable accuracy of better than 5 cm in both horizontal and height components of ground objects at the 60 m AGL (8 mm GSD). This confirms that using GNSS/Inertial in conjunction with airborne imagery successfully allows for accurate mapping for corridor mapping applications. This is a clear differentiator between Direct Georeferencing and the traditional Aerotriangulation or Shape from Motion Overlap and sidelap of 80x80 and 80x40 resulted in the
same accuracy within the measurement noise level. This confirms repeatable and consistent accuracy amongst different image block configurations.
The horizontal and vertical planar pictorial plots depict random error vectors in different directions which confirms that there are no left-over biases of a significant magnitude. In other words, it confirms randomness which is a healthy phenomenon in any survey measurements.
In-flight lens distortion calibration using a 4-strip block consistently results in a lens distortion accuracy of about 2 to 5 pixels at image corners. Image edges and corners are where tie points are measured. Which implies that the lens distortion in-flight calibration alone could contribute to a major part of the remaining errors on the ground, when independently evaluated using Check Points. This confirms the decision made by most of the UAV photogrammetric processing software to do self-calibration for data sets to accommodate for lens distortion in-flight calibration.
For a 120 m flying altitude above ground resulting in a 16 mm GSD, the accuracy is of a similar nature of about 2-3 pixels (4-5 cm) in horizontal and 4-5 pixels (up to 8 cm) in height. When accuracy is measured in pixels, it is similar to that of the 60 m AGL flying altitude. This shows a linear relationship between the final absolute ground object positioning accuracy and the drone flying altitude. This could be used as a role of thump for mission planning purposes.
ACKNOWLEDGEMENTS
The R&D contribution of Vi Huynh, Jaume C. Mila, and Ivan E. Estruch of Navmatica Corporation is highly appreciated. Joe Hutton, Omer Mien and Harsil Jani of Applanix Corporation are acknowledged for their guidance in this project. Mike Hogan of Microdrones is gratefully acknowledged for his coordination and participation in this project. Sebastien Borghini of Microdrones is acknowledged for conducting the flights and facilitating the logistics during the course of this project.
The collective efforts of the abovementioned personnel of Navmatica, Applanix, and Microdrones led to the success of this project and resulted in the research findings shared in this paper.
REFERENCES
Casella, V., K. Jacobsen, M.M.R. Mostafa, and M. Franzini, 2006. A European Project on Direct Georeferencing, Proceedings, ASPRS Annual conference, Reno, Nevada, May 1-5, 2006
Farrell, J.A. and M. Barth, The Global Positioning System and Inertial Navigation, McGraw-Hill, New York, 1999.
Fraser, C.S. 1997. Digital camera self calibration. ISPRS Journal of Photogrammetry and Remote Sensing 52(4), 149-159.
Ip, A., N. El-Sheimy, and M.M.R. Mostafa, 2007. Performance Analysis of Integrated Sensor Orientation. PE&RS, 73 (1): 89 – 97.
Mostafa, M.M.R. and K.P. Schwarz, 2000. A Multi-Sensor System for Airborne Image Capture and Georeferencing. PE&RS, 66 (12): 1417-1424.
Mostafa, M.M.R. and K.P. Schwarz 2001. Digital Image Georeferencing from a Multiple Camera System by GPS/INS. ISPRS Journal of Photogrammetry and Remote Sensing 56(1), 1-12.
Mostafa, M.M.R., 2001. Boresight Calibration without Ground Control, Proceedings of OEEPE Workshop: Integrated Sensor Orientation, Hanover, Germany, September 17-18, 2001.
Mostafa, M.M.R., 2001. Boresight Calibration of Integrated Inertial/Camera Systems. Proceedings of the International Symposium on Kinematic Systems in Geodesy, Geomatics and Navigation, Banff, Canada, June 5-8.
Mostafa, M.M.R., 2003. Using Integrated GPS/Inertial Data to Directly Georeference Digital UAV Payload Data, Proceedings UAV Workshop – VITO, Belgium, March 17-18.
Mostafa, M.M.R., 2003. High Precision GPS for Aerial Surveys, Proceedings, The ASPRS Annual Meeting Anchorage, Alaska, USA, May 5-9.
Mostafa, M.M.R., 2004. Airborne GPS Positioning Using Continuously Operating Reference Stations For Mapping Applications. Proceedings of the 4th International Symposium on Mobile Mapping Technology (MMT2004), Kuming, China, March 29-31.
Mostafa, M.M.R., and J. Hutton, 2004. A Fully Integrated Solution for Aerial Surveys: Design, Development, and Performance Analysis, PE&RS, 71 (4): 391-399.
Mostafa, M.M.R., 2005. Optimizing the Digital Processing Workflow Using Direct Georeferencing. Proceedings FIG Working Week 2005 and GSDI 8, Cairo, Egypt, 16-21 April, 2005.
Mostafa, M.M.R., E. Roy and X. Zhang, 2007. SmartBaseTM— An Efficient New Tool for Aircraft Positioning using Continuously Operated Reference Stations for Mapping Applications. Proceedings, the ASPRS Annual Fall Conference, Ottawa. Canada, October 28 – November 1, 2007.
Mostafa, M.M.R., 2013. Calibration in Multi-Sensor System Environment. Optech Imaging and LiDAR Solutions Conference, held in Toronto, Canada, June 25-27, 2013.
Schwarz, K.P., M.A. Chapman, M.E. Cannon, and P. Gong, 1993. An Integrated INS/GPS Approach to the Georeferencing of Remotely Sensed Data, PE& RS, 59(11): 1167-1674.