Leaf nitrogen concentration of wheat subjected to
elevated [CO
2
] and either water or N deficits
T.R. Sinclair
a,∗, P.J. Pinter Jr.
b, B.A. Kimball
b, F.J. Adamsen
b, R.L. LaMorte
b, G.W. Wall
b,
D.J. Hunsaker
b, N. Adam
b, T.J. Brooks
b, R.L. Garcia
d, T. Thompson
c, S. Leavitt
c, A. Matthias
caUSDA-ARS, Agronomy Physiology&Genetics Laboratory, University of Florida, Gainesville, FL 32611 0965, USA bUSDA-ARS, U.S. Water Conservation Laboratory, Phoenix, AZ, USA
cUniversity of Arizona, Tucson, AZ, USA dLI-COR, Inc., Lincoln, NB, USA
Received 7 January 1999; received in revised form 21 September 1999; accepted 27 October 1999
Abstract
Leaf N concentration is important because it is associated with the CO2assimilatory capacity of crops, and in grasslands,
it is an important determinant of forage nutritive value. Consequently, the productivity of both domestic and native animals in future global environments may be closely linked to possible changes in leaf N concentration of grasses. Since grasslands are frequently subjected to water-deficit or N-deficit conditions, it is important to investigate the interactive responses between elevated [CO2] and these stress conditions. Therefore, this 4-year research program was undertaken with wheat (Triticum
aes-tivumL.) as a model system for forage grasses, to document the potential changes in leaf N concentration in response to global environment changes. Wheat crops grown under field conditions near Phoenix, AZ, USA, were subjected to elevated [CO2]
and either water-deficit or N-deficit treatments using large Free Air Carbon dioxide Enrichment (FACE) arrays. Surprisingly, the elevated [CO2] treatment under optimum conditions resulted in little change in leaf N concentration. Therefore, no change
in the nutritive value of forage from highly managed pastures would be expected. Further, water-deficit treatment had little influence on leaf N concentration. To some extent, the lack of response to the water-deficit treatment resulted because severe deficits did not develop until late in the growing seasons. Only on one date late in the season was the water-deficit treatment found to result in decreased leaf N concentration. The low N treatment in combination with elevated [CO2], however, had a
large influence on leaf N concentration. Low levels of applied N resulted in decreased leaf N concentration under both [CO2]
treatments, but the lowest levels of leaf N concentration were obtained under elevated [CO2] through much of the growing
season. These results point to a potential problem with grasslands in that the nutritive value of the forage consumed by animals will be decreased under future global environment changes. © Published by Elsevier Science B.V.
Keywords:CO2enrichment; Forage quality; Leaf nitrogen; Nitrogen deficit; Water deficit
∗Corresponding author. Tel.:+1-352-392-6180; fax:+1-352-392-6139.
E-mail address:[email protected] (T.R. Sinclair)
1. Introduction
In consideration of the impact on plants of global environment changes, including atmospheric CO2 in-creases, alterations in leaf N concentration may be
especially critical. Leaf N concentration is an impor-tant variable for at least two reasons: (1) The nutritive value of the forage is dependent on leaf N content. When plant foliage is directly consumed by animals, leaf protein content is an important component in determining forage nutritive value. High leaf N con-centration is important in obtaining high growth rates in both domestic and wild animals when forage is their sole source of protein. (2) Carbon assimilation is dependent on leaf N. The dependence of leaf CO2 assimilation rate on leaf N content has been shown in a number of plant species, including wheat. Evans (1983) found in wheat a common relationship be-tween CO2assimilation rate and leaf N concentration for plants grown under a wide range of conditions. At a higher level of integration, crop growth character-ized by radiation use efficiency (RUE) is also closely linked to leaf N concentration. Fischer (1993) found that a considerable amount of the variability in wheat RUE within specific growth periods was attributed to differences in shoot N concentration. Previously, Green (1987) and Garcia et al. (1988) had found that wheat RUE increased with increasing N fertility.
It has been predicted that increased photoassimilate accumulation in plants as a result of elevated [CO2] will result in a dilution of plant N such that the N concentration in the leaves will decrease (e.g., Field et al., 1992). Indeed, a number of studies in which atmospheric [CO2] has been increased has reported a decrease in leaf N concentration (see Luo et al., 1994). This response was found explicitly in wheat by Hock-ing and Meyer (1991), Rogers et al. (1993), McKee and Woodward (1994), and Rogers et al. (1996).
Unfortunately, nearly all past studies on changes in leaf N concentration in response to increasing [CO2] have been done under optimum fertility and water con-ditions, and these situations rarely describe the growth conditions for most grasslands. That is, many man-aged pastures, and certainly all native grasslands, are characterized by soils with low N fertility and they are commonly subjected to at least intermittent periods of drought. In fact, with predicted alterations in the temporal and spatial variability of precipitation (e.g. Hansen et al., 1988) drought stress may occur more frequently and/or more intensively than under current conditions. Therefore, to understand the changes in productivity of grasslands, which represent a consid-erable fraction of the earth’s land surface, as a result
of global environment change, it is important to un-derstand the interactive influence of increased [CO2] and water-deficit and nitrogen-deficit on leaf N con-centration. Changes in leaf N concentration in wheat under elevated [CO2] and these stresses may be a use-ful model system, particularly prior to anthesis, for indicating the response of grasslands. Further, wheat itself is sometimes grown as a pasture and forage crop (Cherney and Marten, 1982).
Hocking and Meyer (1991) grew wheat in glasshouses on sand culture at five levels of applied nitrate and under ambient and elevated [CO2]. The elevated [CO2] in their experiment was 1500ml l−1 so that it was substantially greater than the level generally considered for global environment change. In any case, for each N treatment total N per plant increased under elevated [CO2], but leaf reduced-N concentration at an early stage of plant development (Feekes Stage 10.3) decreased with CO2enrichment. The smallest decrease in leaf reduced-N concentra-tion with elevated [CO2] occurred at the lowest nitrate application. The decrease in leaf reduced-N was the greatest at nitrate applications, only slightly greater than the lowest nitrate treatment.
Free Air Carbon dioxide Enrichment (FACE) arrays that subjected the plants to either 350 or 600mmol CO2mol−1. In each year, the N concentrations of the total harvested material were decreased by both low amounts of N fertilization and elevated [CO2] treat-ments. The lowest N concentration occurred in the combined treatments of low N fertility and elevated [CO2].
Unfortunately, there is virtually no information on the interaction of elevated [CO2] and water-deficit stress on N concentration in leaves. Akin et al. (1995) measured crude protein at only two times during a single growing season for wheat leaves sampled from a FACE experiment with wet and dry treatments. For both harvests, the crude protein of the leaves from the dry plots were not significantly different from the wet plots in each of the respective [CO2] treatments. The simulations of Seligman and Sinclair (1995) indicated a substantial increase in leaf N concentration under dry conditions as compared to irrigated wheat, and elevated [CO2] decreased leaf N concentration under both watering regimes. To some extent, the affects of elevated [CO2] and water-deficit cancelled each other. Considering the importance of leaf N concentration on productivity and quality of grasses, the specific objective of this study was to document the response of leaf N to interactive treatments of elevated [CO2] with water deficits and with N deficits. The results reported here contrast with most previous studies in that the experiments were done under natural growing conditions using FACE arrays rather than in con-trolled enclosures involving pot grown-plants under an artificial environment. Results on wheat leaf N con-centrations through the growing season are reported for 2 years each on the interaction of elevated [CO2] and water-deficit, and elevated [CO2] and N-deficit.
2. Materials and methods
2.1. FACE
These experiments were conducted in FACE arrays established at the Maricopa Agricultural Center lo-cated about 40 km south of Phoenix, AZ, USA (Pinter et al., 1996). Each FACE array consisted of a 25 m di-ameter toroidal plenum ring that was laid on the soil surface after sowing the crop. CO2-enriched air was
released through 32 vertical vent pipes inserted on the plenum. The release of CO2-enriched air was restricted to those vent pipes that were upwind and the amount of release was regulated so as to achieve a fixed [CO2] at the center of each FACE ring (Pinter et al., 1996). In the first 2 years involving the water-deficit ex-periments, the elevated [CO2] treatment was fixed at 550mmol CO2mol−1. In the second 2 years involving the N experiment, the elevated [CO2] treatment was set at a fixed 200mmol CO2mol−1 above ambient. Since ambient [CO2] was about 360mmol CO2mol−1, the elevated [CO2] treatment across the 4 years was approximately equal.
Four replicate, elevated [CO2] plots were estab-lished in the FACE arrays in each year by the time of crop emergence. In addition, four identical plots surrounded by toroidal plenum rings plots were es-tablished as control plots subjected to ambient [CO2]. No air was flowed through the rings in the drought experiments but in the N experiments air was released from the rings at the same volume as used in the CO2-enriched plots.
The experimental treatments of water-deficit or N-deficit were achieved by dividing the crop within each CO2-treatment ring in half. Half of each ring received the complete management treatment (i.e. control) of irrigation or N, and the other half received the deficit treatment. Therefore, there were in each year four replicates of each of the four treatments (2[CO2]×2 management levels).
2.2. Crop culture
The soil at this location was described in detail by Kimball et al. (1992). It was classified as a Trix clay loam [fine-loamy, mixed (calcareous), hyperthermic Typic Torrifluvents; FAO, Fluvisol]. The top 70 cm layer had a sand, silt, and clay content of 350, 310, and 340 g kg−1, respectively. Below 70 cm the soil had a higher sand content. The estimated plant available water within a potential root zone of 1.3 m depth was 130 mm (Hunsaker et al., 1996). The organic carbon concentration of the top 10 cm was only about 4 g kg−1 and essentially 0 below 30 cm.
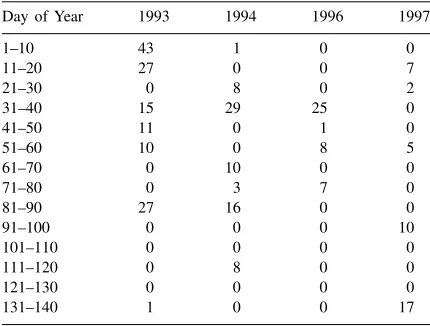
sea-Table 1
Rainfall (mm) for 10-day intervals during each of the four growing seasons at the Maricopa Agricultural Centre, AZ
Day of Year 1993 1994 1996 1997
1–10 43 1 0 0
sons the wheat cultivar Yecora Rojo was sown in rows spaced 0.25 m apart. Maricopa has a desert climate generally with only a few winter rain storms (Table 1). Consequently, the crops were irrigated using drip tubes positioned at a depth of 0.2 m in the soil and between alternate crop rows. Fertilizer was applied in split ap-plication with a presowing apap-plication and three or four subsequent applications during the season.
2.3. Water-deficit experiments
The experiments with irrigation as a variable were sown on 15 December 1992 (1993 experiment) and 7–8 December 1993 (1994 experiment). Following sowing, the soil was irrigated to insure seed germina-tion. In each season, the crop emerged on or near 1 January.
The well-watered treatment was irrigated when 30% of the available soil water was depleted and then, the soil was irrigated to fully replenish the soil water. In the 1993 experiment, the water-deficit treatment was irrigated at the same time as the well-watered plots but with only 50% the amount of water. In the 1994 experiment, the water-deficit treatment was irrigated only every other time that the well-watered treatment was irrigated, but with the same amount of water as applied to the well-watered plots per irrigation. The irrigation scheme in both years resulted in an increase in the severity of the soil water-deficit as the season progressed (Hunsaker et al., 1996).
2.4. Nitrogen-deficit experiments
The experiments with N fertility as a variable were sown on 14–15 December 1995 (1996 experiment) and on 16 December 1996 (1997 experiment). In each season, the crop emerged near 1 January. The soil was irrigated following sowing and subsequent irri-gations were done according to the methods used for the well-watered plots in previous years with the ex-ception that the low-N treatment matured earlier and required one less irrigation than the high-N treatment in both years.
In the 1996 experiment, soil analysis showed that the soil had 8 gm−2 of ammonium plus nitrate in the top 0.9 m, so no presowing application of N was made. The N treatment was imposed by applying dif-fering amounts of ammonium nitrate on 30 January, 22 Febuary, 30 March, and 18 April 1996. The high-N treatment received on each date respectively, 5, 12.5, 12.5, and 5 g N m−2 for a total of 35 g N m−2. The low-N treatment received on each date respectively, 1.5, 3.0, 2.5, 0 g N m−2for a total of only 7 g N m−2. Additionally, nitrate in the irrigation water resulted in the application of 3.3 and 3.0 g N m−2for the high-N and low-N treatments, respectively.
At the onset of the 1997 experiment, about 14.5 g m−2 N as ammonium plus nitrate were found in the top 0.9 m of soil in the high-N plots. Appli-cations of NH4NO3 were applied through the drip irrigation system to the high-N treatments on 30 January (5 g m−2), 5 March (12.5 g m−2), 18 March (12.5 g m−2), and 22 April 1997 (5 g m−2) for a to-tal of 35 g N m−2 of supplemental N. In the low-N treatments, preplant concentrations of ammonium plus nitrate were about 6.9 g m−2N. The low-N treat-ments were fertilized with NH4NO3 on 30 January (0.5 g m−2), 5 March (0.5 g m−2), and 18 March 1997 (0.5 g m−2) for a total of 1.5 g m−2additional N. Ni-trate in the irrigation water added a further 4.3 and 3.8 g N m−2 for the high-N and low-N treatments, respectively.
2.5. Leaf N analysis
were sampled at each harvest. The plants from the four areas were combined to constitute a sample of 24 plants from each replication. The plants were stored on ice and transported to the laboratory for cold storage. Usually within 4–5 days the plants were processed by removing the leaves from the plants. Any samples that were not processed within 9 days were discarded, but this situation occurred only in the 1993 experiment.
Leaf blades were detached from the plant at the ligule and the tissue was separated into two cate-gories based on their appearance: (1) ‘green’ tissues which were presumed to be physiologically active, and (2) ‘nongreen’ tissues (brown or yellow) which were senescent. When both categories were present within a blade, tissues were cut apart into the respective frac-tions. Nitrogen analysis reported here was obtained for the green leaf tissue only.
Leaves were dried at 65–70◦C and stored. Subse-quently, the green leaf material was ground and a N analysis was done by the micro-Kjeldahl proce-dure. Biweekly samples were analyzed for N con-centration from the water-deficit experiments, and the weekly samples were analyzed from the N-deficit ex-periments. A 250 mg sample was digested using an aluminum block digestion (Gallaher et al., 1975). Leaf N concentration was expressed on a dry weight basis. A statistical analysis was done to compare treat-ments over specific experimental periods within each season. A repeated-measure analysis was conducted in which the experiments were treated as a split-plot design (main plot=treatments; subplots=time) and analyzed using the MIXED procedure of SAS release 6.11 (SAS Institute, 1996).
3. Results and discussion
The overall patterns of changes in wheat leaf N concentration through the growing season were sim-ilar across the 4 years of experimentation (Figs. 1 and 2). Shortly after emergence leaf N concentration was in the range of 40–50 mg N g−1. Leaf N concen-tration then tended to increase reaching a maximum approximately 30–40 days after emergence. This in-crease in leaf N likely reflects the rapid exploration of the soil by the roots and high N uptake rates rela-tive to shoot growth. Following the maximum leaf N concentration, there was a steady decrease in leaf N
concentration through the rest of the growing season. At the end of the season, green leaf N concentration had decreased to less than 20 mg N g−1, with some values being less than 10 mg N g−1. This overall seasonal pattern in wheat leaf N is consistent with previous reports (Harper et al., 1987).
Comparison of leaf N concentration under the op-timum management treatment (control) revealed lit-tle difference between [CO2] treatments in 3 of the 4 years. In contrast to many previous reports, leaf N concentration in the 1993, 1996, and 1997 experi-ments were essentially unchanged by elevated [CO2] on many sampling dates (Figs. 1 and 2). The insensi-tivity of leaf N concentration to elevated [CO2] under the high soil N fertility imposed in the control
Fig. 2. Seasonal leaf N concentration for wheat plants subjected to ambient [CO2] (control) and enriched [CO2] (FACE) during two seasons (1996 and 1997) that included low and high levels of nitrogen application. The vertical bars on each datum are the standard errors of the mean.
ments is consistent with the small change in shoot N concentration at high N supply reported by Rogers et al. (1996). The 1994 experiment may have been an exceptional case because the available soil N may not have been as high as in other years. There was substan-tial rain storm (29 mm) in mid-February 1994, which may have resulted in a large loss of soil N. There-fore, even for the control treatment in the 1994 there may have been a low N supply such that a decreased leaf N concentration resulted from the elevated [CO2] treatment (Fig. 1b).
3.1. Water-deficit experiments
Water-deficits as determined by volumetric soil water contents did not develop until about 60 days
following crop emergence in each year (Hunsaker et al., 1996). Therefore, a response to the water-deficit treatment could be expressed in these experiments only during the latter part of the seasons. Water-deficit tended to have little influence on leaf N concentration except on one sampling date in each year (DOY 118 in 1993 and DOY 116 in 1994). On this one day in each year, leaf N concentration under both CO2 treat-ments were decreased in the water-deficit treattreat-ments relative to the well-watered treatments. An important possibility in this case is that transfer of N from the leaves to the grain may have been accelerated by limited N uptake from the dry soil, so that on these individual dates a decreased leaf N was observed. Overall, however, these results did not indicate a large interaction between elevated CO2 and water-deficit on leaf N concentration.
Seligman and Sinclair (1995) simulated leaf N concentration at the beginning of grain fill for wheat crops grown under ambient and elevated [CO2]. Their simulation results in a warm, dry year showed that irrigation resulted in a slightly lowered leaf N concentration. These results were obtained because decreased growth with drought allowed a slight con-centrating of N in the leaves. The lack of such a response in the FACE experiments may be due to the fact that little drought stress developed in these experiments during the vegetative phase of devel-opment. Booting (Zadoks growth stage 40) in these crops occurred at about DOY 70 (Pinter et al., 1996), which was only about 10 days following the develop-ment of soil water-deficits. Neither the results from the FACE experiment nor the simulations indicated a major change in leaf N concentration as a result of interactions between elevated [CO2] and water-deficit.
3.2. Nitrogen-deficit experiments
N concentration may have reflected a dilution resulting from high CO2assimilation associated with elevated [CO2]. This appears to be the situation with virtually all previous reports of leaf N concentration response to increased [CO2].
After the initial crop growth, the relative leaf N concentrations among treatments shifted so that leaf N concentration was lower in the low soil N fertility treatment regardless of the [CO2] treatment (p<0.01) (Fig. 2). The depression in leaf N concentration in the low fertility treatment relative to the high fertil-ity treatment increased through the season until the late stages of crop development. The cumulative ef-fect of N deprivation through the season as crop mass increased apparently resulted in the relatively greater decrease in leaf N concentration under the low soil N fertility treatment.
Under low soil N fertility, elevated [CO2] resulted in decreased leaf N concentration relative to ambient [CO2] on a number of sampling dates during the sea-son (Fig. 2). These results are likely to have happened because of the dilution effect (Luo et al., 1994). Accu-mulation of dry matter was facilitated by the elevated [CO2] but there was no additional N available from the soil in the low N fertility treatment, and conse-quently, the increase in plant mass was not matched by a greater uptake of N. These data highlight the impor-tant finding that the interaction of elevated [CO2] and low soil N fertility resulted in lower leaf N concen-tration (p<0.01) than resulted from either treatment independently. The greater decrease in leaf N con-centration with elevated [CO2] and low soil N supply is consistent with the glasshouse studies of Rogers et al. (1996) and the FACE studies withL. perenneof Zanetti et al. (1997).
4. Conclusions
Leaf N concentration is important in setting poten-tial plant CO2 assimilation rate and in determining the quality of the plant mass as animal forage. An important question under possible global environment changes is the interaction of elevated [CO2] with ei-ther water-deficits or N deficits. The results of these experiments under field conditions using a FACE ar-ray provided data on the expected interaction of these variables in a study with wheat.
Elevated [CO2] by itself under well-watered condi-tions and adequate soil N resulted in a decrease in leaf N concentration early in the season as has been ob-served in many experiments (Luo et al., 1994). This difference was small and essentially disappeared after the early stages of crop development. Consequently, these results indicate that highly managed pastures may have virtually no change in forage protein value as a result of elevated [CO2].
Little interaction between elevated [CO2] and water-deficit was detected in these experiments. The fact that there was no drought stress early in the cropping season may have influenced these results. This, of course, may be similar to many situations where there is a winter recharge of soil water that allows early season growth to occur in the absence of water-deficit. Although there is still a need for more data on the interaction of [CO2] and water-deficit on leaf N concentration, the results from these experi-ments indicated that this interaction is not likely to be a major factor in determining forage N content under global environment change.
Soil N fertility had a substantial influence on leaf N concentration with low soil N fertility resulting in decreased concentration. Importantly, the interaction of elevated [CO2] and low soil N resulted in a leaf N concentration that was lower than what resulted from either factor by itself. This result is particularly sig-nificant because native grasslands that support a con-siderable portion of domestic animal production, and all of native grazing animals, are unfertilized. There-fore, these results indicate that the nutritive value of native grasslands as reflected by leaf N concentration may decrease under global environment change. As a consequence, animal production and grazing patterns may be negatively influenced by global environment changes associated with decreased quality of the grass forages.
Acknowledgements
Ecology and Global Change. Additional operational support was contributed by the Potsdam Institute for Climate Impact Research, Potsdam, Germany; the NASA Goddard Space Flight Center, Greenbelt, MD; the Natural Resource Ecology Laboratory, Colorado State University, Ft. Collins, CO; and the Department of Soil Science, University of Alberta, Edmonton, Alta., Canada. Technical assistance in plant process-ing was provided by C. O’Brien and K. West. We acknowledge the cooperation of Dr. Roy Rauschkolb and his staff at the University of Arizona, Maricopa Agricultural Center. The FACE apparatus was fur-nished by Brookhaven National Laboratory, and we are grateful to Mr. Keith Lewin, Dr. John Nagy, and Dr. George Hendrey for assisting in its installation and operation. This work contributes to the Global Change Terrestrial Ecosystem (GCTE) Core Re-search Programme, which is part of the International Geosphere–Biosphere Programme (IGBP).
References
Akin, D.E., Kimball, B.A., Windham, W.R. et al., 1995. Effect of free-air CO2 enrichment (FACE) on forage quality of wheat. Animal Feed Sci. Tech. 53 29–43
Cherney, J.H., Marten, G.C., 1982. Small grain crop forage potential I. Biological and chemical determinants of quality and yield. Crop Sci. 22, 227–231.
Evans, J.R., 1983. Nitrogen and photosynthesis in the flag leaf of wheat (Triticum aestivumL.). Plant Physiol. 72, 297–302. Field, C.B., Chapin III, F.S., Matson, P.A., Mooney, H.A., 1992.
Responses of terrestrial ecosystems to the changing atmosphere: a resource-based approach. Ann. Rev. Ecol. Syst. 23, 201– 235.
Fischer, R.A., 1993. Irrigated spring wheat and timing and amount of nitrogen fertilizer II. Physiology of grain yield response. Field Crops Res. 33, 57–80.
Gallaher, R.N., Weldon, C.O., Futral, J.G., 1975. An aluminum block digester for plant and soil analysis. Soil Sci. Soc. Am. Proc. 39, 803–806.
Garcia, R., Kanemasu, E.T., Blad, B.L. et al., 1988. Interception and use efficiency of light in winter wheat under different nitrogen regimes. Agric. For. Meteorol. 44, 175–186
Green, C.F., 1987. Nitrogen nutrition and wheat growth in relation to absorbed solar radiation. Agric. For. Meteorol. 41, 207–248. Hansen, J., Fung, I., Lacis, A. et al., 1988. Global climate changes as forecast by the GISS 3-D model. J. Geophys. Res. 98, 9341–9364
Harper, L.A., Sharpe, R.R., Langdale, G.W., Giddens, J.E., 1987. Nitrogen cycling in a wheat crop: soil, plant, and aerial nitrogen transport. Agron. J. 79, 965–973.
Hocking, P.J., Meyer, C.P., 1991. Effects of CO2 enrichment and nitrogen stress on growth, and partitioning of dry matter and nitrogen in wheat and maize. Aust. J. Plant Physiol. 18, 339– 356.
Hunsaker, D.J., Kimball, B.A., Pinter Jr, P.J., LaMorte, R.L., Wall, G.W., 1996. Carbon dioxide enrichment and irrigation effects on wheat evapotranspiration and water use efficiency. Trans. Am. Soc. Agric. Eng. 39, 1345–1355.
Kimball, B.A., LaMorte, R.L., Peresta, G.J., Mauney, J.R., Lewin, K.F., Hendrey, G.R., 1992. Appendix 1: weather, soils, cultural practices, and cotton growth data from the 1989 FACE experiment in IBSNAT format. Crit. Rev. Plant Sci. 11, 271– 308.
Luo, Y., Field, C.B., Mooney, H.A., 1994. Predicting responses of photosynthesis and root fraction to elevated [CO2]: interactions among carbon, nitrogen, and growth. Plant, Cell Environ. 17, 1195–1204.
McKee, I.F., Woodward, F.I., 1994. CO2 enrichment responses of wheat: interactions with temperature, nitrate, and phosphate. New Phytol. 127, 447–453.
Pinter, P.J., Kimball, B.A., Garcia, R.L., Wall, G.W., Hunsaker, D.J., LaMorte, R.L., 1996. Free-air CO2enrichment: responses of cotton and wheat crops. In: Koch, G.W., Mooney, H.A. (Eds.), Carbon Dioxide and Terrestrial Ecosystems. Academic Press, San Diego, pp. 215–249.
Rogers, G.S., Milham, P.J., Gillings, M., Conroy, J.P., 1996. Sink strength may be the key to growth and nitrogen responses in N-deficient wheat at elevated CO2. Aust. J. Plant Physiol. 23, 253–264.
Rogers, G.S., Payne, L., Milham, P., Conroy, J., 1993. Nitrogen and phosphorus requirements of cotton and wheat under changing atmospheric CO2 concentrations. Plant Soil 156, 231–234. SAS Institute, 1996. SAS/SATA software: changes and
enhancement through R 6.11. SAS Institute, Cary, NC. Seligman, N.G., Sinclair, T.R., 1995. Global environment change
and simulated forage quality of wheat II. Water and nitrogen stress. Field Crops Res. 40, 29–37.
![Fig. 1. Seasonal leaf N concentration for wheat plants subjected toambient [CO2] (control) and enriched [CO2] (FACE) during twoseasons (1993 and 1994) that included well-watered or water-deficitirrigation treatments](https://thumb-ap.123doks.com/thumbv2/123dok/3163273.1386652/5.612.313.523.277.580/seasonal-concentration-subjected-toambient-twoseasons-included-decitirrigation-treatments.webp)
![Fig. 2. Seasonal leaf N concentration for wheat plants subjectedto ambient [CO2] (control) and enriched [CO2] (FACE) duringtwo seasons (1996 and 1997) that included low and high levelsof nitrogen application](https://thumb-ap.123doks.com/thumbv2/123dok/3163273.1386652/6.612.76.285.51.368/seasonal-concentration-subjectedto-duringtwo-included-levelsof-nitrogen-application.webp)
