FULLY AUTOMATED GENERATION OF ACCURATE DIGITAL SURFACE MODELS
WITH SUB-METER RESOLUTION FROM SATELLITE IMAGERY
J. Wohlfeil 1, H. Hirschmüller 2, B. Piltz 1, A. Börner 1, M. Suppa 2
German Aerospace Center (DLR), Institute of Robotics and Mechatronics, 1
Dept. of Data Processing for Optical Systems, Rutherfordstr. 2, 12489 Berlin, Germany 2 Dept. of Perception and Cognition, Münchner Str. 20, 82234 Wessling, Germany
(juergen.wohlfeil, anko.boerner, heiko.hirschmueller, michael.suppa)@dlr.de
Commission III, WG III/1
KEY WORDS: Camera Orientation, Digital Surface Model, Satellite Images, Bundle Adjustment
ABSTRACT:
Modern pixel-wise image matching algorithms like Semi-Global Matching (SGM) are able to compute high resolution digital surface models from airborne and spaceborne stereo imagery. Although image matching itself can be performed automatically, there are prerequisites, like high geometric accuracy, which are essential for ensuring the high quality of resulting surface models. Especially for line cameras, these prerequisites currently require laborious manual interaction using standard tools, which is a growing problem due to continually increasing demand for such surface models. The tedious work includes partly or fully manual selection of tie- and/or ground control points for ensuring the required accuracy of the relative orientation of images for stereo matching. It also includes masking of large water areas that seriously reduce the quality of the results. Furthermore, a good estimate of the depth range is required, since accurate estimates can seriously reduce the processing time for stereo matching. In this paper an approach is presented that allows performing all these steps fully automated. It includes very robust and precise tie point selection, enabling the accurate calculation of the images’ relative orientation via bundle adjustment. It is also shown how water masking and elevation range estimation can be performed automatically on the base of freely available SRTM data. Extensive tests with a large number of different satellite images from QuickBird and WorldView are presented as proof of the robustness and reliability of the proposed method.
1. INTRODUCTION
Data from imaging remote sensing systems is a primary source for a huge variety of geo-spatial products and services. New technologies permit the generation of high resolution digital surface models (DSM). These products allow the generation of highly accurate orthophotos. In combination, these two types of products provide a standardized three-dimensional spatial reference for each pixel including all spectral information (e.g. red, green, blue, height). This information is a prerequisite for most geo-spatial data products and services. Especially if their spatial resolution is in the sub-meter range, they offer a huge number of applications in the fields of change detection, urban noise modeling, radio propagation, flooding simulation, opencast mining, etc. Moreover, the new and quickly growing market of public on-line geo-information services (e.g. Google Earth, Bing Maps 3D, etc.) currently creates a very strong demand on these products in order to provide detailed landscape and city models.
For the creation of such high resolution DSMs, Semi-Global Matching (SGM) (Hirschmüller, 2005 and 2008) turned out to achieve better results in many cases than other stereo matching methods (Hirschmüller and Bucher, 2010) and other technologies, e.g. LIDAR (Gehrke, 2010) or Radar. Moreover, stereo matching can be performed much more economically than its technological alternatives, as it does not require additional sensors. The images used for matching are required anyway in most cases. Despite of its relatively high computational complexity, the computation time can be handled very well by parallelization and/or optimization for special hardware like graphic cards (Ernst and Hirschmüller, 2008) and FPGAs (Gehrig et al., 2009; Hirschmüller, 2011). But in order to achieve optimal results there are some prepro-cessing steps, needed to meet the algorithm’s prerequisites.
While the computation time was drastically reduced, the time consumption for these laborious steps became the critical part of the whole procedure. Therefore, during the last years, many different components have been developed to solve this problem (Hirschmüller, 2005 and 2008; Wohlfeil, 2010 and 2012). Their combination leads to a very operational solution for highly automated generation of high resolution digital surface models with high throughput. As most of the current imaging sensors with spatial high resolution are line scanners, using the pushbroom principle (e.g. WorldView 1/2, GeoEye, QuickBird, Pleiades), it is focused on this type of sensors.
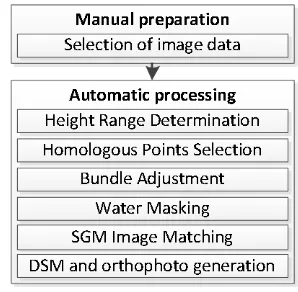
Figure 1: Overview of the processing steps
Since dense matching is typically slow, the search range should be limited. The search range in the images can be computed from the height range of the terrain. An automatic solution of this problem is presented in Section 3.6.
For computing geometrical reconstructions from images, the intrinsic and extrinsic geometry of cameras must be known. The intrinsic camera geometry (interior orientation) is International Archives of the Photogrammetry, Remote Sensing and Spatial Information Sciences, Volume XXXIX-B1, 2012
typically known due to camera calibration. For line cameras the extrinsic parameters (exterior orientation) essentially consists of 6 degrees of freedom for every captured camera line. Dense stereo matching requires that the remaining geometric error is less than 1 pixel in image space. However, if possible it should be below 0.5 pixels. Since the absolute pointing accuracies of satellites are much worse, the exterior orientation must be optimized with respect to a precise relative orientation, using homologous points (also called tie points). Especially for line imagery there was a lack of software for performing this task robustly and reliably. With an integrated approach, presented in the Sections 3.1 to 3.3 of this paper, this problem is solved.
If the requirements in terms of relative orientation cannot be met, the resolution of the DSM has to be reduced. This task is also being automatized with the help of a suitable accuracy measure, introduced in Section 3.4.
Another problem is water, which cannot be matched, since images are taken at different times, causing different textures in every image based on the movement of waves. Thus water should be identified, ignored while matching and smoothly interpolated from the shore, later on. The automatic water masking is described in Section 3.5.
An overview of the processing chain is given in Figure 1. The only manual interaction that remains is the selection of the suitable stereo imagery and its housekeeping data (initial exterior and interior orientation, etc.), described in the following Section.
2. PREPARATION
For the generation of DSMs one or more groups of images are specified. Each group contains two or more images that are to be matched via SGM. If possible, the images of each group should be captured
- with a large overlap, in which matching can be performed - with different along-track viewing angles (pitch angles) - at similar seasons and daytimes in order to avoid large
differences of shadows and vegetation, which can reduce the quality of the result
If it is not possible or not economic to meet these conditions, processing is possible as well, but the quality and resolution of the resulting products will be suboptimal, but still very useful for many application.
The images of different groups should partly overlap. This is important to enable the generation of one large and continu-ous DSM of the entire captured area. The homologcontinu-ous points, found in the overlapping areas, allow a global alignment of the images, reducing spatial discontinuities of the DSM between the areas in a high degree. It is also recommendable to use groups with different across-track viewing angles (roll angles) for the same area in order to resolve most of the occlusion in urban areas. At the current stage of development the selection of the images is performed manually because this only takes a few minutes. There are very good prospects to automatize even this step as well (see Section 5).
3. PROCESSING 3.1 Height Range Determination
One important parameter for SGM process is the maximal
occurring disparity i.e. the size of the search range for
matching. This parameter negatively influences the result of the algorithm if set too low, which results in the search for matches being cancelled too early. If – on the other hand - it is set unnecessarily high, it slows down processing, since the
computation time of the process depends on the size of the search range.
Finding the right value for this parameter is essentially a matter of finding the maximum and minimum height in the scene being processed. We achieve this by consulting the digital elevation data of the Shuttle Radar Topography Mission (SRTM) of the year 2000.
The SRTM data is freely available on the web from the U.S. Geological survey1, providing an elevation model of the world in 3 arc-second resolution. This information is downloaded and evaluated when needed and a safety buffer of 400 meter is added to allow for buildings and other deviations from the model.
3.2 Automatic and robust tie point selection
The relative orientation of images is optimized by bundle adjustment, which requires a sufficient number of homolo-gous points visible in two or more images. Several ap-proaches for automatic point selection were developed in the last decades. The general approach is to select small salient image regions (features) in one image and to find the corresponding image regions in the other images. This can be performed via cross correlation or the efficient implementa-tion (Bouguet, 2000) of the KLT feature tracker (Tomasi and Kanade, 1991). In case of unknown scale and rotation differ-ences between images, approaches like SIFT (Lowe, 2004) and SURF (Bay et al., 2008) are preferable. However, satellite images are typically provided with a good initial orientation and the KLT feature tracker is by far more efficient than the other options.
Independent of the approach used for feature matching, there is always the problem of mismatches that can occur under suboptimal conditions. Especially if several difficulties like moving objects and shadows, repetitive patterns, changing vegetation and illumination, specular reflections, water sur-faces, perspective distortion etc. come together, the number of mismatches easily exceeds the number of correct matches, even by multiples. In such cases almost all approaches for automatic point selection fail miserably.
Two steps are vital to successfully process such difficult imagery. First, possible radiometric differences between images due to different spectral band characteristics of sensors, changed vegetation and sun angle have to be compensated as far as possible. This is performed by adaptive radiometric balancing (as explained in A.2.4 of Wohlfeil, 2011). Second, the majority of mismatches have to be determined and eliminated already during tie point selection by a consistency check of redundant matches. Therefore, image features are being matched redundantly from every image to any other image in all possible directions. The consistency of different matches can then be checked.
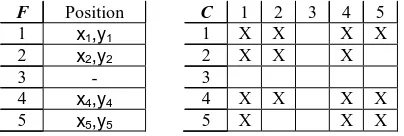
F Position C 1 2 3 4 5
Table 1: Exemplary information associated with one feature in N = 5 possible images. The feature is apparently not visible in image 3 and it couldn't be tracked between images 5 and 2. The score associated with this feature is 56% (14/25)
1
http://dds.cr.usgs.gov/srtm/
If SIFT or SURF feature descriptors are used it can be checked if corresponding features match each other better than any other feature (as explained in Wohlfeil, 2010). Much better performance has been achieved using the above mentioned KLT feature tracker and a special matching algorithm that is explained in this contribution.
3.2.1 Redundant Matching with Consistency Check First, in all of N possibly overlapping images, features are determined according to Shi and Tomasi (1994). A given minimum distance between features limits their number and ensures a good distribution. For each of the selected features an N×N connectivity matrix C is created with one single positive entry at C(i, i), denoting that the position of the feature is yet only known in image i. All other entries are initialized negative. Also a vector of feature positions F is created for every feature with F(i) set to the feature’s position in image i. Next, the following algorithm is performed, written in pseudo code: for which the corresponding element C(j,i) is negative (Table 1). The number c of the remaining positive elements of C is then used to calculate the rating �=� �⁄ 2 for every feature.
3.2.2 Multi Resolution Matching Approach
In mountainous areas the displacement of features can differ by many hundreds or thousands of pixels in different images. For the KLT feature tracker such large displacements lead to many mismatches. With a simple approach this can be avoided. The previously explained feature matching algorithm is performed at two levels of image resolution. All images are scaled down to a manageable size (~10 Megapixel) and are matched, resulting in a feature list Fglobal, providing information about the rough relative alignment of the different image regions.
With this information, corresponding image tiles with a reasonable size and full resolution can be extracted from the original images. The algorithm is then repeated with each of these tiles. For all of the performed test it was enough to process only 30% well distributed tiles of the whole image area to retrieve enough homologous points for a reliable and accurate bundle adjustment. More points do not improve the results significantly, but unnecessarily increase the calculation time
All features whose offset is larger than the maximum possible disparity (according to the limited height range), are regarded
as outliers and removed from the list. Features showing a relatively high deviation (>2σ) are removed as well.
Finally all features are sorted by descending rating and only the best are kept. Despite of the consistency check and statistical analysis there can still be a relevant amount of incorrect matches among the remaining features. But even in challenging situations their number is low enough to detect and eliminate them during the bundle adjustment.
3.3 Bundle Adjustment
As the positions of the center of projection can be determined with sufficient precision via GNSS for every captured line, only the errors in orientation determination – the rotational offsets between the measured and the real camera rotation - have to be determined together with the 3D-positions of homologous points. Depending on the platform and the orientation measurement system these rotational offsets drift slowly over time. These drifts are modeled by an orientation correction function, consisting of �= 1. .� sets of rotational offsets, defined for equidistant points in time and interpolated over time via quadratic Bezier curves (Wohlfeil, 2010). The temporal distance between the correction parameter sets is chosen according to the drift characteristics of the orientation measurement error.
Similar to the adjustment of frame images, the appropriate parameters of all rotational offsets are determined with the help of the selected homologous points. While the correction of a frame image’s orientation is typically expressed by a single spatial rotation, the orientation correction function of a line image has more correction parameters. In both cases correction parameters have to be found that meet best the collinearity constraints for all homologous points.
The C implementation of sparse bundle adjustment from (Lourakis and Argyros, 2004) is used for performing this task. Due to errors in the automatically determined homologous points, bundle adjustment must be performed repeated in order to detect and eliminate incorrect points. They are detected due to their residuals, which are significantly larger than the RMS of all residuals. In practice, a threshold of three times the RMS worked well in all cases.
3.4 Preventing loss of the absolute orientation
After bundle adjustment with homologous points, the relative orientation of the involved images is optimal. But if no information about the measured absolute orientation of the images is given to the bundle adjustment, the accuracy of this orientation can get lost. This is especially the case for remote sensing satellites with a small field of view, such as most high resolution sensors with a narrow swath (i.e. few kilometers). Due to the small field of view and the large distance of the satellite from the earth, the rays of light corresponding to different pixels of the image are almost parallel. Due to that, the error function is very flat in terms of the absolute orientation. As a result, very small errors in the positions of the homologous points cause the absolute orientation to drift far away.
This can be prevented by integrating ground control points (with known positions in object space) in the bundle adjustment. But the measurement of their positions is very laborious and not always possible.
The problem is solved by using a small subset of homologous points remaining after bundle adjustment as pseudo ground
control points. Their position is determined by spatial
intersection of corresponding lines of sight, using the directly measured orientation. Finally, one additional bundle International Archives of the Photogrammetry, Remote Sensing and Spatial Information Sciences, Volume XXXIX-B1, 2012
adjustment is performed including both, homologous points and pseudo ground control points. In this way, the accuracy of absolute orientation can be retained at the level of direct geo-referencing capabilities of the remote sensing system while the relative orientation is improved without any ground control points.
3.5 Accuracy Determination
After bundle adjustment, the accuracy of the relative orientation is optimized. However, due to small errors in the determination of points, but also due to errors in the interior orientation, insufficiently uncorrected atmospheric effects, etc. the accuracy is limited and varies from scene to scene. SGM requires a relative orientation that allows the prediction of epipolar lines with less than one pixel of divergence in image space. In order to assure that this requirement is met, the resolution of matched images, and so the resulting DSM, must be reduced, if necessary.
In order to check and reduce the DSM resolution automatically a special measure is introduced. It measures how accurate the epipolar curves (they are actually curves in line images, instead of lines) can be predicted. The epipolar curve is predicting possible locations of a point of image i in image j according to the given (interior and) exterior orientation of both images. As the images of one scene can be captured with different sensors, their resolution and geometry can differ. Therefore, the epipolar curve is projected onto a plane at mean terrain height, resulting in the curve ���. �(���,��) is defined to be the minimum distance between ���, and the line of sight li corresponding to the point in image i. This distance can be calculated for all homologous points for any tuple of images i and j being matched. Finally, the RMS of all distances calculable for the given set of homologous points is defined to be the epipolar error ee. It represents the overall-accuracy of a set of images in terms of SGM. The epipolar error should not exceed half the GSD, in order to meet the constraints of SGM Matching. If it exceeds half the GSD of any of the involved images, the images have to be down-sampled to a GSD of 2∙ ��. At the same time, this GSD is the resolution of the resulting DSM (GSDDSM). This means that, after calculating the epipolar error from homologous points used for bundle adjustment, the GSDDSM can automatically be chosen to achieve both, the best possible resolution and quality of the result.
3.6 Water Masking
There have been numerous research efforts into water body extraction from satellite imagery. (Zhaohui, 2003) relies on water bodies having a smooth untextured surface and can only detect large bodies. (Bovolin et al, 2006) suggest using the IR spectral band. Unfortunately, there exists no general solution to segment all sorts of water bodies in a limited number of spectral bands or even a panchromatic image. Fortunately, the U.S. Geological survey provides data on water bodies and coastlines in the resolution of the SRTM elevation data. The contours are downloaded for the given area. As both, the accuracy of the water mask and absolute pointing accuracy of the satellite is limited, water areas are dilated a suitable distance. The resulting contours are then simplified to facilitate processing (Figure 2).
The SRTM data has already been manually processed and contains all types of water bodies, but it has the obvious disadvantage of not always being up to date, due to the volatile nature of coastlines. As a fall back mechanism, the user is provided the option to manually correct the mask.
Figure 2: Dilated water mask generated from SRTM. The simplified water polygons are drawn white with blue edges.
3.7 SGM Image Matching
As soon as the mentioned requirements are met, stereo matching can be applied to overlapping images for computing a dense reconstruction of the scene. For a long time, local, correlation based methods dominated photogrammetry. Due to the size of the correlation window, resulting surface models have a lower spatial resolution than the input images. Fine structures are lost and object boundaries are smoothed. In contrast, global methods permit pixel-wise matching, which is guided by a global smoothness constraint. The resulting surface models have the same resolution as the input images, but global methods typically have a high processing time, which prevent their use for real world problems. The Semi-Global Matching (SGM) method provides a very good trade-off between accuracy and processing speed (Hirschmüller, 2005 and 2008).
SGM performs matching of corresponding pixels along epipolar lines. Since, in general, line images cannot be rectified such that epipolar lines are exactly aligned with image rows, line images are projected onto a horizontal plane and matching is performed along calculated epipolar lines (Hirschmüller et al., 2005). As matching cost, Census is used, for radiometric robustness (Hirschmüller and Scharstein, 2009), which is very important in satellite imagery, due to typically large time differences, which causes different shadows.
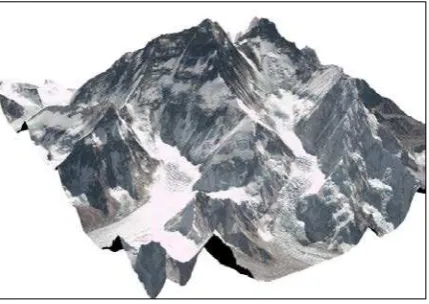
Figure 3: Reconstruction of Mt. Everest in 50 cm/pixel from World View satellite images, provided by DigitalGlobe International Archives of the Photogrammetry, Remote Sensing and Spatial Information Sciences, Volume XXXIX-B1, 2012
The SGM method itself uses a smoothness constraint that penalizes neighboring pixels with different depth values. The matching cost and the smoothness constraint are expressed in a global cost function that is minimized by pathwise approximation. SGM is not sensitive to the choice of parameters, which is very important in practice since hand tuning of parameter is avoided.
The inner processing loop of SGM is very regular and only compares and adds integer values: This allows very efficient CPU implementations using vector commands as well as implementations on graphic cards (Ernst and Hirschmüller, 2008) and FPGAs (Gehrig et al., 2009; Hirschmüller, 2011). SGM produces dense matching results in the resolution of the input images (Figure 3). Typically, fine structures as well as sharp object boundaries are precisely reconstructed. Therefore, the method is very well suited for matching airborne as well as satellite images (Gehrke et al., 2010; Hirschmüller and Bucher, 2010).
4. TESTS AND RESULTS
The presented method for automatic processing has been tested with many different sets of stereo imagery from QuickBird II (QB2), WorldView I (WV1) and WorldView II (WV02), kindly provided by DigitalGlobe. From many successfully processed scenarios from 16 different sites of the world, the results of four exemplary cases were selected to be presented in detail.
The first scenario consists of two WorldView I stereo triples of Berlin (Figure 4), an urban area with some small lakes and soft elevations. Every triple, consisting of a forward, nadir and backward scan, was taken within a few minutes from the same orbit. Experience has shown that with this configuration the best relative orientation between the images can be achieved. Indeed, the relative accuracy over all images was very high (Table 2), and the epipolarity error ee below half the GSD. This means that the DSM can be generated at the original resolution (GSDorig) of 0.55 m.
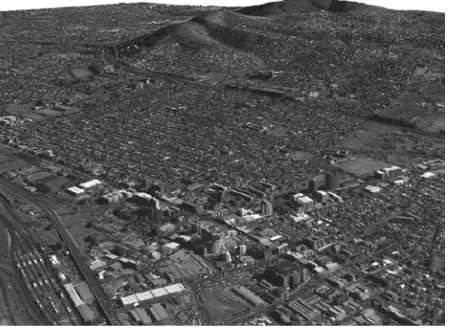
The second scenario is CapeTown (Figure 5), a mainly flat urban area with high elevations in between and a coastline to the sea. All nine images were captured at different seasons. Therefore, the relative accuracy is much lower than in the previous scenario. But at least a DSM with a GSDDSM of
2∙ ��= 0.83 m was achieved.
For the mountainous Dunedin scenario four stereo pairs were used. Two of them were taken by WorldView I and two by WorldView II. A similar accuracy as in as the Cape Town scenario was achieved.
Scene Berlin 1 Cape Town
Dunedin Berlin 2
Sensors 2*3 WV1 1 WV1, 8 WV2
2*2 WV1,
2*2 WV2 2*2 QB2 Area 500 km² 430 km² 580 km² 700 km² GSDorig 0.55 m 0.55 m 0.57 m 0.63 m
er 0.22 m 0.38 m 0.35 m 2.5 m
ea 4.46 m 1.84 m 10.1 m 4.24 m
ee 0.24 m 0.43 m 0.39 m 1.86 m
tPreparation 1.23 hours 2.15 hours 0.88 hours 0.25 hours GSDDSM 0.55 m 0.76 m 0.70 m 3.72 m tSGM 40 hours 41 hours 87 hours 0.17 hours Table 2: Results of the tests. er: The RMS of the spatial distances of corresponding lines of sight of independently selected homologous points (relative accuracy). ea: The RMS of the distances of the lines of sights from the GCP's absolute positions (absolute accuracy). ee: epipolarity error.
Finally, another scenario from Berlin was chosen, consisting of two Quickbird stereo pairs. All images were taken at different times and seasons. Despite of that, the automatic tie point selection worked very well. The achieved relative accuracy was much worse than with imagery of the WorldView satellites, also in other scenarios not included in this paper. Probably this is due to the generally lower geometrical precision of the QuckBird in compare to its successor WorldView.
The achieved absolute accuracy (ea), as shown in Table 2, is within the range of the absolute pointing accuracy of the corresponding satellites. Both, the absolute and relative accuracy have been checked with a set of precisely measured and manually selected check points not used for bundle adjustment in order to provide an independent reference. The tests were performed on a Dell PowerEdge T610 with two Intel Xeon X5570 Qudcore CPUs at 2.93GHz. For all scenarios the manual preparation could be performed in at most a half an hour. The automatic preparation time tPreperation needed until the SGM processing step requires relatively little time when compared to the actual SGM processing step on the same computer (see Table 2). The Dunedin scenario took the longest to process, due to the larger height range, caused by the mountains. Berlin 2 only took very little time as GSDDSM was chosen to be 3.72 m because of the low accuracy of the relative orientation.
The time consumption for SGM processing per square kilometer depends mainly on the GSDDSM, the number of matches and the height range. In Table 2 the processing times for the last two steps (SGM matching and orthophoto generation) are given for the different scenarios.
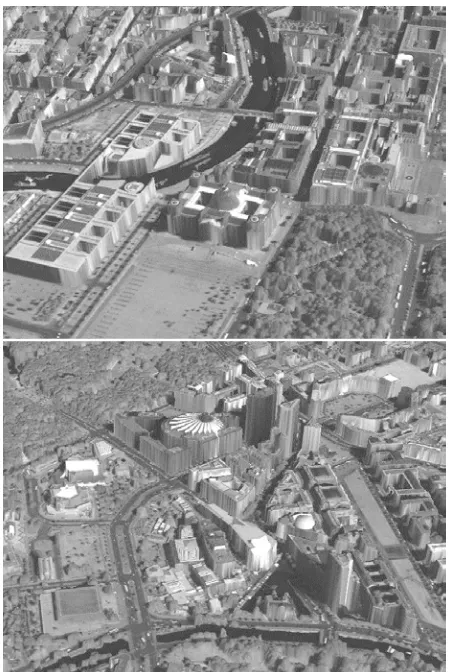
Figure 4: Reconstruction of a part of Berlin, textured by panchromatic images.
For aerial image processing, it has been shown (Hirschmüller and Bucher, 2010) that the height error of SGM is around half of the GSD, additional to the registration error. In our experience, the same quality can be reached with satellite images.
Figure 5: Reconstruction of a part of Cape Town
5. CONCLUSIONS AND OUTLOOK
It has been discussed that processing high resolution digital surface models from satellite images on a productive level requires a fully automatic and robust approach. This paper presented a solution to this problem. This results in a huge gain in productivity and cost-efficiency. From the large number of already processed scenes, examples were given with images from DigitalGlobe satellites. However, the developed method has also been tested with many datasets from an airborne line camera (Wohlfeil, 2010 and 2011). The processing times needed on the mentioned test machine can be reduced significantly to a very small fraction via parallelization since most time is consumed by SGM matching, which can run in parallel if more CPU cores or more computers are available.
The remaining manual interaction can be reduced further. Suitable parameters (orientation, season, etc.) from an image database will be subject of further investigation in order to select images automatically. We also see good chances in refining the SRTM-based water masks by existing or new image processing algorithms in order to get optimal results even in regions where water covered areas change fast. Besides water masking, it is also important to mask clouds. As only in one of all processed scenarios clouds occurred this issue was not treated yet. But it is regarded to be solved easily as there are many different algorithms available that are capable of segmenting clouds automatically due to their high intensity values and homogenous structure.
6. ACKNOWLEDGEMENTS
We would like to thank DigitalGlobe for kindly allowing us to use the imagery for our research.
7. REFERENCES
Bay, H., Ess, A., Tuytelaars, T., and Gool, L. V. 2008. “Surf: Speeded up robust features,” Computer Vision and Image
Understanding (CVIU) Vol. 110, No. 3, 346–359.
Bouguet, J-Y. 2000. Pyramidal Implementation of the Lucas Kanade Feature Tracker. Description of the algorithm. Tech.
Report, Intel Corporation Microprocessor Research Labs.
Bovolin, V., De Chiara, G., Migliaccio, M. and Villani, P., 2006. Remote Sensing Technique to Estimate the Water Surface of Artificial Reservoirs: Problems and Potential Solutions, IEEE GOLD Remote Sensing Conference Bari
Ernst, I. and Hirschmüller, H. (2008). Mutual Information based Semi-Global Stereo Matching on the GPU, International Symposium on Visual Computing, Las Vegas
Gehrig, S., Eberli, F. and Meyer, T. (2009). A Real-Time Low-Power Stereo Vision Engine using Semi-Global Matching, International Conference on Computer Vision Systems (ICVS), LNCS 5815
Gehrke, S., Morin, K., Downey, M., Boehrer, N. and Fuchs, T. 2010. Semi-Global Matching: An Alternative to LIDAR for DSM Generation?, In International Archives of the Photo-grammetry, Remote Sensing and Spatial Information Sciences, Vol. XXXVIII
Hirschmüller, H. 2005. Accurate and Efficient Stereo Processing by Semi-Global Matching and Mutual Information, Proc. of IEEE Conference on Computer Vision and Pattern Recognition, San Diego, Vol. 2, pp. 807-814
Hirschmüller, H., Scholten, F. and Hirzinger, G. 2005. Stereo Vi-sion Based Reconstruction of Huge Urban Areas from an Airborne Pushbroom Camera, Lecture Notes in Computer
Science: Pattern Recognition, Proceedings of the 27th DAGM
Symposium, Vienna, Austria, Vol. 3663, pp. 58-66
Hirschmüller, H. 2008. Stereo Processing by Semi-Global Matching and Mutual Information, IEEE Transactions on
Pattern Analysis and Machine Intelligence, 30(2), pp. 328-341
Hirschmüller, H. and Scharstein, D. 2009. Evaluation of Stereo Matching Costs on Images with Radiometric Differences, IEEE
Transactions on Pattern Analysis and Machine Intelligence,
31(9), pp. 1582-1599
Hirschmüller, H. and Bucher, T. 2010. Evaluation of Digital Surface Models by Semi-Global Matching, DGPF Vienna Hirschmüller, H. 2011. Semi-Global Matching - Motivation, Developments and Applications, Photogrammetric Week, September 2011, pp. 173-184
Lowe, D.G. 2004. Distinctive Image Features from Scale-Invariant Keypoints. International. Journal of Computer Vision, 60(2), pp. 91-110
Lourakis, M. and Argyros, A. 2004. The design and implementation of a generic sparse bundle adjustment software package based on the levenberg-marquardt algorithm. Technical report, ICS-FORTH, Heraklion, Greece.
Shi, J and Tomasi, C. 1994. Good Features to Track. Proc. of
IEEE Conference on Computer Vision and Pattern Recognition,
pp. 593-600.
Tomasi, C. and Kanade, T. 1991. Shape and Motion from Image Streams: a Factorization Method - Part 3: Detection and Tracking of Point Features. Tech. Rep. CMU-CS-91-132, Computer Science Dept., Carnegie Mellon University.
Wohlfeil, J. 2010. Completely optical orientation determination for an unstabilized aerial three-line camera. Proceedings of SPIE
Sensors, Systems, and Next-Generation Satellites XIV, 7826.
Wohlfeil, J. 2011. Dissertation: Optical Orientation Determi-nation for Airborne and Spaceborne Line Cameras, Humboldt Universität zu Berlin, Naturwissenschaftliche Fakultät II Wohlfeil, J. 2012. Determining fast orientation changes of multi-spectral line cameras from the primary images. ISPRS Journal of
Photogrammetry and Remote Sensing, 67, pp. 45-51
Zhaohui, Z., Prinet, V. and Songde, M., 2003 “Water body extraction from multisource satellite images”. IEEE,
0-7803-7929-2/03