MEASUREMENT OF LARGE-SCALE SOLAR POWER PLANT BY USING IMAGES
ACQUIRED BY NON-METRIC DIGITAL CAMERA ON BOARD UAV
R. Matsuoka a, *, I. Nagusa b, H. Yasuhara b, M. Mori a, T. Katayama c, N. Yachi c, A. Hasui c, M. Katakuse c, T. Atagi d
a
Research and Development Division, Kokusai Kogyo Co., Ltd., Japan
{ryuji_matsuoka, masaru_mori}@kk-grp.jp
b
Geospatial Information Engineering Division, West Japan Department, Kokusai Kogyo Co., Ltd., Japan
{issei_nagusa, hirotaka_yasuhara}@kk-grp.jp
c
Civil Engineering Department, General Environmental Technos Co., Ltd., Japan
{katayama_tatsuo, yachi_nobuhisa, hasui_akinori, katakuse_maiko}@kanso.co.jp
dAsago Power System Center, Himeji Branch, Kansai Electric Power Co., Inc., Japan
atagi.takao@b5.kepco.co.jp
Commission I, ICWG I/V
KEY WORDS: Measurement, Non-Metric, Camera, Calibration, Orientation, Application, Engineering, Experiment
ABSTRACT:
This paper reports an experiment conducted in order to investigate the feasibility of the deformation measurement of a large-scale solar power plant on reclaimed land by using images acquired by a non-metric digital camera on board a micro unmanned aerial vehicle (UAV). It is required that a root mean squares of errors (RMSE) in height measurement should be less than 26 mm that is 1/3 of the critical limit of deformation of 78 mm off the plane of a solar panel. Images utilized in the experiment have been obtained by an Olympus PEN E-P2 digital camera on board a Microdrones md4-1000 quadrocopter. The planned forward and side overlap ratios of vertical image acquisition have been 60% and 60% respectively. The planned flying height of the UAV has been 20 m above the ground level and the ground resolution of an image is approximately 5.0 mm by 5.0 mm. 8 control points around the experiment area are utilized for orientation. Measurement results are evaluated by the space coordinates of 220 check points which are corner points of 55 solar panels selected from 1768 solar panels in the experiment area. Two teams engage in the experiment. One carries out orientation and measurement by using 171 images following the procedure of conventional aerial photogrammetry, and the other executes those by using 126 images in the manner of close range photogrammetry. The former fails to satisfy the required accuracy, while the RMSE in height measurement by the latter is 8.7 mm that satisfies the required accuracy. From the experiment results, we conclude that the deformation measurement of a large-scale solar power plant on reclaimed land by using images acquired by a non-metric digital camera on board a micro UAV would be feasible if points utilized in orientation and measurement have a sufficient number of bundles in good geometry and self-calibration in orientation is carried out.
1. INTRODUCTION
Solar power energy would become more and more important in Japan. However, there are few suitable areas for a large-scale solar power plant except for land reclaimed from the sea in Japan. Since reclaimed land is easy to subside and a great uneven subsidence of the reclaimed land destroys a solar panel on the reclaimed land, periodical deformation measurement of solar panels is essential. The periodic deformation measurement of solar panels requires that a root mean squares of errors (RMSE) in height measurement should be less than a half of one decimeter. Conventional aerial photogrammetry by using images acquired by a manned aircraft cannot achieve the required accuracy, because the scale of the images is too small.
In the meantime, various unmanned aerial vehicles (UAVs) have been utilized for photogrammetry (Eisenbeiss, 2011). The photogrammetric potential of an UAV has been recently evaluated in several studies (Gülch, 2011, Haala et al., 2011, Küng et al., 2011, Vallet et al., 2011, Rosnell and Honkavaara, 2012). Küng et al. (2011) reported photogrammetric experiments by using a fixed wing type micro UAV. Their report showed that they achieved a highly accurate result that a RMSE in height measurement at 12 control points were 17 mm
by using 12 control points and 73 images which were collected from a flying height of 130 m above the ground level. Rosnell and Honkavaara (2012) reported photogrammetric experiments by using a quadrocopter type micro UAV as well. They reported that they obtained an accurate result that a RMSE in height measurement at 24 check points were 10.6 cm by using 31 control points and 251 images which were collected from a flying height of 110 – 130 m above the ground level. These reports suggested that it would be possible to measure deformation of solar panels with sufficient accuracy by means of UAV photogrammetry.
Since a camera on board an UAV is not a large format camera owing to the payload limitation of the UAV, the flight attitude of the UAV should be low enough to acquire images with sufficient ground resolution for the deformation measurement of solar panels. It is thought that a micro UAV is a desirable platform to acquire large-scale images suitable for the deformation measurement of solar panels. This paper reports an experiment to investigate the feasibility of the deformation measurement of a large-scale solar power plant on reclaimed land by using images acquired by a non-metric digital camera on board a micro UAV.
2. OUTLINE OF THE EXPERIMENT
Two teams engaged in the experiment. One carried out orientation and measurement following the procedure of conventional aerial photogrammetry, and the other executed those in the manner of close range photogrammetry. We name the former Team-A, while we name the latter Team-C in the paper.
2.1 Target solar panels
The experiment was conducted in the 1/64 part of the Sakai Solar Power Station of the Kansai Electric Power Co., Inc. consisting of 113152 solar panels on reclaimed land with an area of 0.3 km2 on the coast of Osaka Bay. The experiment area was a rectangle 54 m wide (East–West) and 75 m long (North– South) and had 1762 solar panels of 52 columns (East–West) by 34 rows (North–South). Each solar panel was a rectangle 1.01 m wide and 1.36 m long. Figures 1 and 2 show the target solar panels in the experiment area.
Figure 1. Target solar panels
Figure 2. Solar panels on reclaimed land
Since the critical limit of deformation of a solar panel is 78 mm off the plane, it is required that a RMSE in height measurement should be less than 26 mm that is 1/3 of the critical limit of deformation.
2.2 Image acquisition
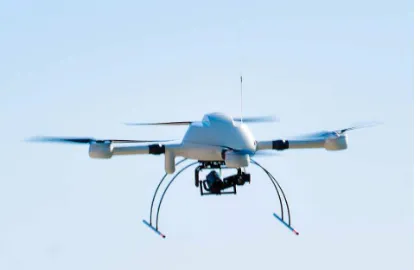
We obtained images by a non-metric digital camera on board a Microdrones 1000 quadrocopter, which is called md4-1000 for short from now on. The md4-md4-1000 shown in Figure 3 is an AUMAV (Autonomous Unmanned Micro Aerial Vehicle),
and has a GPS navigation system and a lens interchangeable digital camera Olympus PEN E-P2 with Olympus M.ZUIKO DIGITAL 17 mm F 2.8 lens, which is called E-P2 for short from now on. The maximum payload and the dimensions of the md4-1000 are 1200 g and 1030 mm from rotor shaft to rotor shaft respectively. The flight time of the md4-1000 with the maximum payload 1200 g is approximately 20 minutes. The sensor size of the E-P2 is 17.3 mm by 13.0 mm and the number of recording pixels of the E-P2 is 4032 pixels by 3024 pixels. Accordingly the pixel size on the focal plane of the E-P2 is 4.3 m by 4.3 m.
Figure 3. Microdrones md4-1000
Vertical image acquisition in the experiment was carried out similarly to that in an ordinary aerial survey by the Team-A. The planned forward and side overlap ratios of the vertical image acquisition were 60% and 60% respectively. The planned flying height of the md4-1000 was 20 m above the ground level and the ground resolution of an image was approximately 5.0 mm by 5.0 mm.
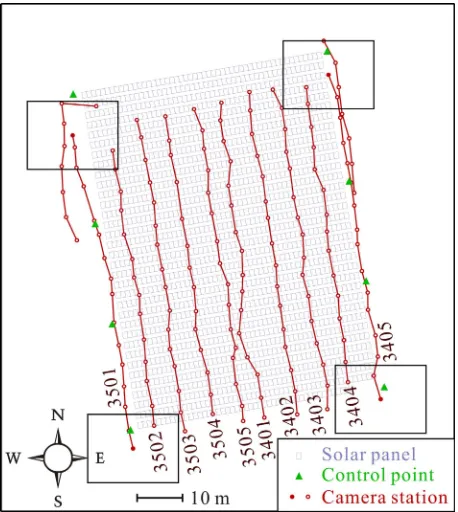
3 flights were carried out in the experiment. The first flight consisting of 5 courses (#3401 – #3405) covered the east half of the experiment area, while the second flight consisting of 5 courses (#3501 – #3505) covered the west half of the experiment area. The third flight consisting of 9 courses (#4101 – #4109) covered the whole of the experiment area. Images acquired in the first and second flights were utilized by the Team-A, while images acquired in the third flight were utilized by the Team-C. The Team-A employed several images acquired in the third flight in order to apply 2 control points located at the northeast and northwest of the experiment area. Figure 4 shows a pair of stereo images acquired in the experiment. Figures 5 and 6 show the camera stations of images utilized by the Team-A and the Team-C respectively.
Figure 4. A pair of stereo images International Archives of the Photogrammetry, Remote Sensing and Spatial Information Sciences, Volume XXXIX-B1, 2012
Figure 5. Camera stations of images utilized by Team-A
Figure 6. Camera stations of images utilized by Team-C
2.3 Camera calibration
Since the E-P2 is a non-metric digital camera, it is necessary to estimate its image distortion model accurately when it is used for measurement. We adopted an image distortion model that consists of a principal distance, offsets from the principal point to the center of the image frame, radial and decentering distortion components. The image distortion model adopted in the experiment is widely used in close range photogrammetry (Luhmann, 2006).
We estimated the image distortion model of the E-P2 by two calibration methods: a pre-calibration method and a self-calibration method. The pre-self-calibration was carried out by using images which were acquired following the procedure of PhotoModeler Pro 5 software (EOS Systems Inc., 2003). A set of calibration points distributed on a 2D plane was applied in the pre-calibration. We utilized 10 by 10 black filled circles on a white sheet as calibration points. A round of camera calibration utilized a set of 16 convergent images acquired from 4 different directions with 4 different camera frame rotation angles of 0°, +90°, +180°, and −90° around the optical axis of the E-P2. On the other hand, the self-calibration was conducted by the Team-A and the Team-C individually.
2.4 Orientation and measurement
We placed 8 control points around the experiment area. Measurement results by the UAV photogrammetry were evaluated by the space coordinates of 220 check points which were corner points of 55 solar panels selected from 1768 solar panels in the experiment area. The reference space coordinates of the check points were measured by a total station, and the approximate accuracy of the measurement was expected to be 3 mm in height on the average. Figure 7 shows the arrangement of the control points and the check points on the selected solar panels.
Figure 7. Control points and check points on solar panels
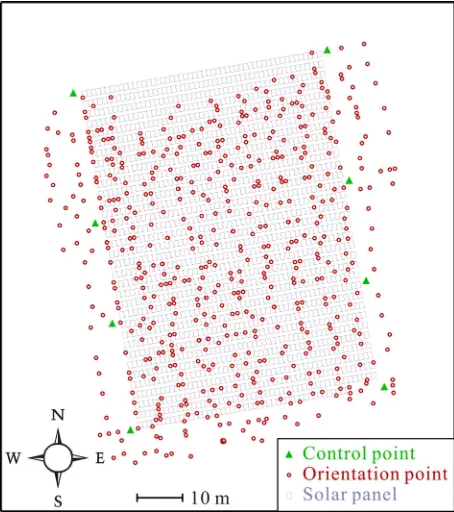
The Team-A selected pass points and tie points on image automatically by Intergraph’s ImageStation Automatic Triangulation (ISAT) software which performs fully automated aerial triangulation. On the other hand, the Team-C selected points to be utilized in orientation manually without distinction between a pass point and a tie point so that selected points were distributed uniformly in the experiment area. Points except control points utilized in the orientation are called orientation points from now on. Figures 8 and 9 show the points utilized in the orientation by the Team-A and the Team-C respectively. Tables 1 and 2 show the statistics of the orientation and the measurement respectively.
The Team-A measured image coordinates of the orientation points automatically by the ISAT, while the Team-C measured those manually on each image. Figures 10 and 11 show the locations of image points on image utilized in the orientation by the Team-A and the Team-C respectively. Figures 12 and 13 show the locations of image points on image utilized in the measurement by the Team-A and the Team-C respectively as well.
Figure 8. Points utilized in orientation by Team-A
Figure 9. Points utilized in orientation by Team-C
Team-A Team-C
Number of images 171 126
Number of control points 8 8
Number of orientation points 583 307 Number of points utilized in orientation 591 315
Number of image points 2342 1896
Average of numbers of image points
on an image 13.70 15.05
Average of numbers of bundles
of a control point 4.63 4.25
Average of numbers of bundles
of an orientation point 3.95 6.07
Table 1. Statistics of orientation
Team-A Team-C
Number of check points 220 220
Number of image points 460 1228
Average of numbers of bundles
of a check point 2.09 5.58
Table 2. Statistics of measurement
Figure 10. Image points utilized in orientation by Team-A
Figure 11. Image points utilized in orientation by Team-C International Archives of the Photogrammetry, Remote Sensing and Spatial Information Sciences, Volume XXXIX-B1, 2012
Figure 12. Image points utilized in measurement by Team-A
Figure 13. Image points utilized in measurement by Team-C
3. RESULTS AND DISCUSSION
The Team-A got the poor result that a RMSE of the check points in height measurement was 1235 mm by using the ISAT with calibration. The Team-A considered that the self-calibration in the ISAT did not work well. Accordingly, the Team-A decided to apply a piece of close range photogrammetry software developed by the Team-C for orientation and measurement in the experiment.
Table 3 shows RMSEs obtained in the experiment. The measurement by using the orientation parameters estimated by the orientation with self-calibration by the Team-C was the only measurement that satisfied the required accuracy that a RMSE in height measurement should be less than 26 mm.
Team-A Team-C
Calibration Pre- Self- Pre-
Self-Image points (pixel) 0.67 0.64 0.78 0.74
Horizontal 2.0 1.1 2.6 2.0
Control points
(mm) Vertical 8.3 1.1 7.2 3.2
Horizontal 20.1 17.2 10.6 10.6 Check points
(mm) Vertical 45.6 122.4 108.4 8.7
Table 3. RMSEs on image and in space
All the RMSEs on image in the orientation were less than 0.8 pixels, and all the RMSEs in space of the 8 control points in the orientation were less than 9 mm. On the contrary, the RMSEs in space of the 220 check points in the measurement ranged widely from 8.7 mm to 122.4 mm. From these results, we concluded that either a RMSE on image in the orientation or a RMSE in space of the control points in the orientation cannot suggest the accuracy of the height measurement in the experiment.
The measurement results shown in Table 3 indicate that the pre-calibration would be unable to estimate the image distortion model of the E-P2 accurately. We guessed that the difference in image scale between the pre-calibration and the measurement might produce the low measurement accuracy. As for camera calibration in UAV photogrammetry, Pérez et al. (2011) compared two camera calibration methods: a laboratory calibration method and a field calibration method. Although the difference in image scale between the two calibration methods in their experiment was large, the difference in RMSE on image between the two calibration methods was small enough. Unfortunately, they did not report the difference in measurement accuracy between the two calibration methods. We are planning to conduct additional calibration to investigate the effect of the difference in image scale between pre-calibration and measurement on measurement accuracy.
We wondered whether the result that the RMSE in height measurement of the check points by the Team-A was much larger than that by the Team-C would be brought by the following differences between the Team-A and the Team-C:
The difference of the images utilized in the orientation and the measurement as Figures 5 and 6 show.
The difference of the arrangement of the orientation points as Figures 8 to 11 show.
The difference of the number of the bundles of an orientation point as Table 1 shows.
The difference of the arrangement of the check points on image as Figures 12 to 13 show.
The difference of the number of the bundles of a check point as Table 2 shows.
As for the difference of the images utilized in orientation and measurement, we conducted additional orientation and measurement by using the images utilized by the Team-A in the same manner as the Team-C did. We obtained the result that a RMSE in height measurement by using the orientation parameters estimated by the orientation with self-calibration was 14.8 mm, which satisfied the required accuracy. Therefore we concluded that the difference of the images utilized in the experiment did not make the difference in measurement accuracy in the experiment.
We have been conducting studies in order to clarify the cause of the difference in measurement accuracy between the Team-A and the Team-C. The arrangement of the orientation points of the Team-A looks quite different from that of the Team-C as Figures 8 to 11 show. Moreover, the average number of the bundles of a orientation point of the Team-C was one and a half times as many as that of the Team-A. We doubt that the difference of the arrangement of the orientation points and the difference of the number of the bundles of an orientation point would make the difference of the accuracy in height measurement.
As for the difference of the number of the bundles of a check point, almost all the check points of the Team-A were measured only on two adjacent images, while the check points of the Team-C were measured on more than five images on the average. We wonder whether the difference of the number of the bundles of a check point would make the difference of the accuracy in height measurement of the check points. We guess that the difference of the locations of the image points on image utilized in the measurement between the A and the Team-C shown in Figures 12 and 13 might make the difference of the accuracy in height measurement of the check points as well.
Furthermore, we wonder whether the 8 control points located around the experiment area might be fewer in number and be arranged in a bad location. We are going to plan to investigate the effect of the number and the arrangement of control points on measurement accuracy to find an appropriate number and an appropriate arrangement of control points.
4. CONCLUSION AND FUTURE WORKS
From the experiment results, we concluded that the deformation measurement of a large-scale solar power plant on reclaimed land by using images acquired by a non-metric camera on board a micro UAV would be feasible if points used in orientation and measurement have a sufficient number of bundles in good geometry and self-calibration in orientation is carried out.
We have been performing studies in order to clarify the cause of the difference of the measurement accuracy between the Team-A and the Team-C. We are planning to conduct additional calibration to investigate the effect of the difference in image scale on measurement accuracy to find an appropriate calibration method. Furthermore, we are going to plan to investigate the effect of the number and the arrangement of control points on measurement accuracy to find an appropriate number and an appropriate arrangement of control points.
ACKNOWLEDGEMENTS
The authors are grateful to the Sakai Solar Power Station of the Kansai Electric Power Co., Inc. for assistance with the experiment.
REFERENCES
Eisenbeiss, H., 2011. The Potential of Unmanned Aerial Vehicles for Mapping, Photogrammetrische Woche 2011, Dieter Fritsch (Ed.), Wichmann Verlag, Heidelberg, pp. 135– 145.
EOS Systems Inc., 2003. PhotoModeler Pro 5 User Manual,
25th Edition, EOS Systems Inc., Vancouver, Canada, pp. 127–
134.
Gülch, E., 2011. Photogrammetric Evaluation of Multi-Temporal Fixed Wing UAV Imagery, Proceedings of the International Conference on Unmanned Aerial Vehicle in
Geomatics (UAV-g), The International Archives of the
Photogrammetry, Remote Sensing and Spatial Information
Sciences, Zurich, Switzerland, XXXVIII-1/C22.
Haala, N., Cramer, M., Weimer, F., Trittler, M., 2011. Performance Test on UAV-Based Photogrammetric Data Collection, Proceedings of the International Conference on
Unmanned Aerial Vehicle in Geomatics (UAV-g), The
International Archives of the Photogrammetry, Remote Sensing
and Spatial Information Sciences, Zurich, Switzerland,
XXXVIII-1/C22.
Küng, O., Strecha, C., Beyeler, A., Zufferey, J.-C., Floreano, D., Fua, P., Gervaix, F., 2011. The Accuracy of Automatic Photogrammetric Techniques on Ultra-Light UAV Imagery , Proceedings of the International Conference on Unmanned
Aerial Vehicle in Geomatics (UAV-g), The International
Archives of the Photogrammetry, Remote Sensing and Spatial
Information Sciences, Zurich, Switzerland, XXXVIII-1/C22.
Luhmann, T., Robson, S., Kyle, S., Harley, I., 2006. Close
Range Photogrammetry, Whittles Publishing, Caithness, pp.
114–122.
Pérez, M., Agüera, F., Carvajal, F., 2011. Digital Camera Calibration Using Images Taken from an Unmanned Aerial Vehicle, Proceedings of the International Conference on
Unmanned Aerial Vehicle in Geomatics (UAV-g), The
International Archives of the Photogrammetry, Remote Sensing
and Spatial Information Sciences, Zurich, Switzerland,
XXXVIII-1/C22.
Rosnell, T., Honkavaara, E., 2012. Point Cloud Generation from Aerial Image Data Acquired by a Quadrocopter Type Micro Unmanned Aerial Vehicle and a Digital Still Camera,
Sensors, Vol. 12, Issue 1, pp. 453–480
Vallet, J., Panissod, F., Strecha, C., Tracol, M., 2011. Photogrammetric Performance of an Ultra Light Weight Swinglet “UAV”, Proceedings of the International Conference
on Unmanned Aerial Vehicle in Geomatics (UAV-g), The
International Archives of the Photogrammetry, Remote Sensing
and Spatial Information Sciences, Zurich, Switzerland,
XXXVIII-1/C22.