THE EFFECTIVENESS OF PANORAMIC MAPS DESIGN:
A PRELIMINARY STUDY BASED ON MOBILE EYE-TRACKING
R. Balzarini a*, M. Murat b
aINRIA Grenoble Rhône-Alpes, 655 Avenue de l’Europe, 38334 Montbonnot, France -[email protected] bMaxime Murat, Département de Psychologie, Université Grenoble Alpes, BP 5338041 Grenoble - [email protected]
Commission II, TeS: WG II/6 Geovisualization and Virtual Reality
KEY WORDS: use and user representation, mobile eye-tracking experiments, effectiveness and efficiency in map design, mountain cartography.
ABSTRACT:
This paper presents preliminary results from an ongoing research based on the study of visual attention through mobile eye-tracking techniques. The visual-cognitive approach investigates the reading-comprehension of a particular territorial representation: ski trails maps. The general issue of the study is to provide insights about the effectiveness of panoramic ski maps and more broadly, to suggest innovative efficient representation of the geographic information in mountain. According to some mountain operators, the information provided by paper ski maps no longer meets the needs of a large part of the customers; the question now arises of their adaptation to new digital practices (iPhone, tablets). In a computerized process perspective, this study particularly focuses on the representations, and the inferred information, which are really helpful to the users-skiers to apprehend the territory and make decisions, and which could be effectively replicated into a digital system. The most interesting output relies on the relevance of the panorama view: panorama still fascinates, but contrary to conventional wisdom, the information it provides does not seem to be useful to the skier. From a socio-historical perspective this study shows how empirical evidence-based approach can support the change: our results enhance the discussion on the effectiveness of the message that mountain operators want to convey to the tourist and therefore, on the renewal of (geographical) information in ski resorts.
* Corresponding author
1. INTRODUCTION
1.1 General context
The study presented in this paper is part of a multidisciplinary research (MECOMO – MEmory, COgnition and MOdelling of mountain landscape,) carried out by historians, GIS scientists and cognitive scientists of the Grenoble Alps University, around the evolving design of a particular territorial model: the panoramic ski maps. This study is user-oriented and aims to provide insights about the effectiveness of this type of maps, by analyzing what and how ski map information is processed by users, when performing ordinary tasks in a skiing-day. More broadly, the goal of the study is to suggest innovative and efficient representation of the geographic information in mountain, in order to respond more adequately to the new practice in winter sports.
1.2 Background
The study fits into current researches coordinated mainly by the International Society of Alpine History and by the Commission on Mountain Cartography of the International Cartography Association. It is based on findings about semiotic categorization of mountain panoramas (Patterson, 2000, Tait, 2010).
Trails maps for ski areas are iconic images of the sport of skiing and its relation to the terrain on which ski resorts are built. The combination of bigger areas to map and an increase in money in the sport led to a shift from simple way-finding maps to more
elaborate mountain portrayals (Tait, 2010).
Since the 1930s ski resorts, tourist and sporting innovations for mountain economies have needed cartographic representations in print, binding with fixed dimensions. Painter artists have been involved in producing ski maps with painting techniques and panoramic views, which are oblique perspectives of any angle and they often are not topographically accurate. Panoramic maps are by far the most common type of map, because they respond to the desire for resorts to look impressive to potential visitors (Tait, 2010). Ski resorts often ask for the mountain to “look bigger”: this request can pose a serious challenge to the artist who, in some cases, resolves by local distortion of the mountain terrain and camera views (Patterson, 2000). Local distortions are unreal and necessarily invented by the artist: they’re spatial decisions at a specific time in a specific situation. They are made by rotation, exaggeration, reduction and replication of shapes, etc… and the resulting graphical objects are visible in the 2D scene, while they are invisible in the real scene (Balzarini et al., 2015).
Thus, panoramic ski maps have the originality of combining realistic and imaginary representations of the mountain, which enabled them to assume a role of “map” without being a real map ...Nevertheless, the talent of artists, able to use specific manual techniques to solve problems of occlusion, foreshortening and unfavorable orientation of landscape elements to the map viewer, inspired recent work in 3D map design. Using digital means, the painters’ techniques may be translated into geometry deformation algorithms for digital panorama creation. Based on the observation of Berann’s techniques, this solution should help the cartographer to deform
a digital terrain model by intuitively manipulating the surface in a 3D display (Jenny et al., 2011). Digital imitation of the techniques of panorama painters have been also improved by combining local terrain deformation and progressive bending algorithms with painterly rendering methods for panoramas (Bratkova et al., 2009).
Relying on these findings, our approach looks rather to the evolution of the usability of ski maps by skiers and this according to a cognitive perspective. In this sense, the study presented in this paper falls within map use research and it is based on empirical evaluation of map.
From a thematic point of view, this study fits into the works that evaluate the effectiveness of panoramic maps (Spengler and Räber, 2014), the 2D vs 3D map attractiveness (Schobesberger and Patterson, 2008) and the symbology relevance (Petrovic and Masera, 2005). It differs however from these studies in the development of a visual attention-based approach.
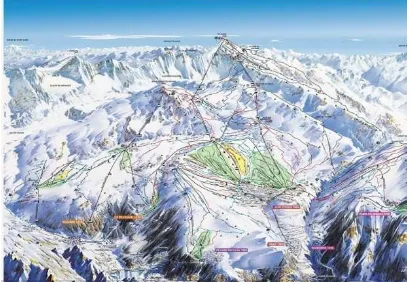
From a methodological point of view, it relies on the current Swiss works on mobile eye-tracking for spatial decision making and wayfinding in lab and real world (Keifer et al., 2014) (Hirtle and Raubal, 2013). This study modestly fits with these works in the use of gaze data as main data source and in the analysis of individual geographic objects depicted on the map. It differs in the fact that the stimulus falls within the representation of a natural environment and not the urban one. Our case study concerns mountain representations according to the artistic style of the “Atelier Novat”, the ski mapmaker French pioneer who uses the panoramic view. Likewise other “panoramic” artists, the “Atelier Novat” artists bring their expertise to combine in a single mountain panorama, the objects of the landscape which are not visible in a real angle of view: the panorama is realistic but subtly distorted. Figure 1 shows an example of ski trail maps in French Alps, Alpes d’Huez ski resort; it is made by Arthur Novat from Atelier Novat.
Figure 1. Alpes d’Huez ski trails maps, made by Atelier Novat
1.3 Overall issue
Ski maps are built from land morphology, local knowledge, and marketing requirements. They are related to practices of space and sport activities which are ever changing in time and which require regular adaptations to their representations.
According to some mountain operators, the information provided by paper ski maps no longer meets the needs of a large part of the customers; the question now arises of their adaptation to new digital mapping practices (iPhone, tablets). At present, ski paper maps coexist with high technology digital mapping (GIS and mobile Apps, 3D ski maps), but for all these
solutions, there is a common issue about the representation of geographic information: which one? And how?
In a perspective of innovative GI design for ski resorts, this study particularly focuses on the representations, and the inferred information, which are really helpful to the users-skiers to apprehend the territory and make decisions, and which could be effectively replicated into a digital system.
This overall issue can be investigated through two main research questions:
1.What geographic information (and its representation) make ski paper maps effective to perform a user-skier’s task?
2. What is the impact of (the paper representation of) mountain local distortion on user-skier’s comprehension?
2. METHODOLOGY
In order to answer to these questions we set up an empirical evaluation of panoramic ski maps, based on experimental design standards from cartography and cognitive sciences. The methodology relies on theoretical frameworks about mental representations. Human activity is based on mental representations that are actually personal reconstructions of the "reality" made by the subject, based on his perceptual systems and previous knowledge. The internal spatial representation for handling spatial images in the brain requires spatial skills such as visualization, orientation and spatial relations (Hegarty et al., 2006). The external spatial representation refers to the organization, interpretation and communication of information with maps, charts or images (NRC, 2006). In our case study, mental representations refer to the natural and anthropogenic elements (objects) depicted in the ski map. The study investigates the user’s capacity to recognize these objects and to extract the relevant information. representations, and the resulting design of graphic objects, were identified while observing the artist making a ski map. The user-skier’s mental representations and the resulting reading of graphic objects, were identified while observing the user making decision for route and navigation on the ski map. All the graphics objects were organized in 5 categories taxonomy: Geography, Geomorphology, Tracing, Structures and Nomenclatures (Balzarini et al., 2015). These preliminary results provided an inventory on ski-users’ concepts and graphics representations as well as it highlighted some difficulties in reading-comprehension of a ski map. In order to get deeper insights, a more detailed approach was necessary to measure the use of graphic objects.
This can be implemented through the study of visual attention. This approach can be carried out with eye-tracking techniques which consist in recording human eye movements (Ware, 2008). Human visual system is very powerful and the perception allows the detection of useful information from a visual scene. A simple heuristic strategy appears to be employed by the brain to plan a sequence of eye movements. For example, if we are scanning a supermarket to look for oranges, regions of space with the color orange will be set up for searching. Millions of features are processed simultaneously to create objects. An object describes the temporary grouping of a collection of visual features together with other links to
propositional information (Ware, 2008). Thus, if we can track someone’s eye movements, we can follow along the path of attention deployed by the observer.
We applied visual-attention approaches in our exploratory “pilot” experiment to observe and analyze just few individuals’ behavior and for this reason, the expected outcomes could not be generalized. As a consequence and in order to see if a common trend could be identified, a quantitative approach, in the form of a large-scale survey, was set up. Its main purpose was to provide statistical feedback on the use of ski maps and on their functions.
While with qualitative approach we tried to focus on the context of the phenomenon, with quantitative approach we sought to develop generalizations that can be applied to a range of contexts (Libarkin et Kurdziel, 2002).
The two successive phases of the experiment, the eye-tracking protocol and the survey, are detailed hereinafter.
3. EXPERIMENT
3.1 The gaze data protocol
Eye trackers measure a person’s visual attention on a stimulus. In our experiment the stimuli consist of ski map which is the result from assembling a plurality of graphic-geographic objects: ski trails and colored slopes tracing, vegetation, peaks, rocks, shadows and light, buildings, etc... Ski map was reproduced in real dimension as that of a display panel that can be found at ski tracks departures.
Visual attention is measured by recording eye movements on the stimulus and, in our case study, the recording was set up with wearable eye-tracking because the subject was standing up face to stimulus and he/she was free to make natural and spontaneous motions.
The basic recordings of eye movements are called gazes. It is generally assumed that perception takes place only if gaze remains almost still for a minimum amount of time. Thus, gazes are often aggregated spatio-temporally to fixations. A transition between two fixations is called a saccade, which is caused by a rapid movement of the eye. In a visual search task the eye moves rapidly from fixation to fixation. The dwell period is generally between 200 and 600 msec and the saccade takes between 20 and 100 msec.
A comprehensive overview on eye tracking hardware and methodology can be found in Holmqvist et al. (2011) and Duchowski (2007). Eye tracking studies for cartographic stimuli range back to the 1970s and 1980s. Recent work in GIScience research with eye-tracking has focused on usability aspects of interactive maps, such as effectiveness and efficiency of different map designs (Çöltekin et al., 2010) or for spatial decision making and way-finding in the lab (Kiefer et al., 2014). While many studies have been conducted in virtual reality simulation (Spiers and Maguire, 2008) (Wiener et al., 2011), only few wayfinding studies have used mobile eye-tracking in the real world. In this perspective, our pilot experiment, performed in laboratory, aims to be replicated in the natural environment.
3.1.1 Protocol. Experimental questions: what areas of the ski map are explored by the gaze? What are the most gazed graphic objects and why? What areas of ski map pose difficulties?
Participants: subjects were between 25 and 55 years old, 5 women and 5 men. They were distributed into 3 groups according to their ski level: 2 subjects in the novice skier group
(N), 5 subjects in the intermediate group (I) and 3 in the advanced group (A). Ski level was defined by auto-evaluation according to the “Ecole de Ski Français’ standards”.
Modalities: subjects were observed in controlled conditions: they were in labs, with stimuli, ski map backboard, in real dimensions. Subjects were asked to perform 2 ordinary tasks of a skiing day: exploring the ski resorts features and assessing the adequacy with its own level (T1); creating a route between two fixed locations, explaining decision making on the path to take (T2). Each subjects’ session took about 15 minutes.
Figure 2 shows a participant during eye-tracking experience.
Figure 2. Participant during the eye-tracking experience, wearing Tobii Glasses.
Material:
- the interview grid to control the session;
- Ecole de Ski Français website to define by auto-evaluation subjects’ alpine ski level;
- 1 copy of a ski map pocket-sized tracks (Les 3 Vallées resort), to introduce the session;
- Alpes d’Huez ski trails map backboard (size A0, 119 x 84 cm);
- the Tobii Pro Glasses 2: this mobile binocular eye-tracking system includes four eye cameras, a wide-angle HD scene camera (90 deg.) for peripheral viewing, a sampling rate of 50 Hz.
Data collection: gaze data from 3036 video frames for T1 and 2120 for T2. 60 minutes of total video-audio recordings.
Metrics: Fixation count and Fixation duration, with respect to the independent variables (alpine ski level and graphic categories).
3.1.2 Gaze data analysis. Gaze data were processed by Tobii Analyzer software with Custom I-VT filter. This filter refers to the Velocity-Threshold Identification (I-VT) fixation classification algorithm that is a velocity based classification algorithm (Salvucci and Goldberg, 2000). The general idea behind an I-VT filter is to classify eye movements based on the velocity of the directional shifts of the eye. The velocity is most commonly given in visual degrees per second (°/s). If it is above a certain threshold the sample for which the velocity is calculated is classified as a saccade sample and below it is seen as part of a fixation (Olsen and Matos, 2012).
Filter: The Tobii Custom I-VT filter we applied had the main following settings:
-I-VT fixation classifier: 100 degrees/second; - Minimum fixation duration: 100 ms.
Techniques: Gaze data were analyzed with classical techniques: a) Heatmaps: a heatmap uses different colors to illustrate the number of fixations participants made within certain areas of the snapshot1 or for how long they fixated within that area. Red usually indicates the highest number of fixations or the longest time, and green the least, with varying levels in between. Tobii Heat Map calculates the distribution of color values around a fixation point by using an approximation to the Gaussian curve (cspline). The radius of this function is set by default at 50 pixels. Heat maps were rendered with absolute count and absolute duration of fixations.
b) Areas of interest (AOI): an AOI is a polygonal area in the stimulus the researcher considers relevant for the research question at hand. If a fixation occurs in an AOI, it is generally assumed that the participant perceived the object surrounded by the AOI (Kiefer et al., 2014). AOI enable numerical/statistical analysis based on regions or objects of interest in the snapshot images.
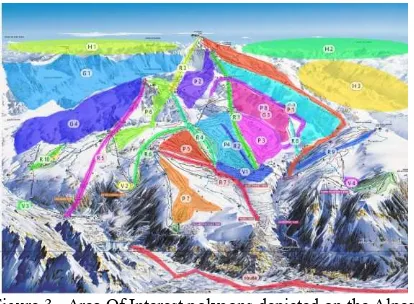
30 AOI were defined to analyze the task of exploration-valuation of the ski resort (T1). Each polygon includes one or more objects depicted in the map. Polygons G (1 to 4) and polygons H (1 to 3) roughly encompass some large areas of the landscape that can be part of the “visit” of the resort as well as peaks on the horizon; polygons P (1 to 8) enclose the main ski run areas and polygons R (1 to 10) enclose the main ski trail tracks; polygon ‘route’ surrounds the main road down the valley and polygons V (1 to 4) include the four main villages of the resort.
Figure 3 shows AOI polygons depicted on the snapshot of Alpes d’Huez ski map for task 1.The polygons roughly cover the exploration area of the ski map.
Figure 3 . Area Of Interest polygons depicted on the Alpes d’Huez ski map for task1.
According to the taxonomic categories of geographic objects described earlier, polygons G and H refer to the Geomorphologic category, polygons P and R refer to the Tracing category and polygons ‘route’ and V refer to the Structure category.
20 AOI were defined to analyze the task of creating a route (T2). Polygons IGeo (1 to 4) roughly encompass some large areas of the landscape that can be part of the route; polygons Ip
1
Fixed reference image of the visual scene (Tobii Analzyer Real World Mapping software)
(1 to 8) enclose the main ski run areas and polygons Ir (1 to 10) enclose the main ski trail tracks.
According to the taxonomic categories of geographic objects described earlier, polygons IGeo refer to the Geomorphologic category while polygons Ip and Ir refer to the Tracing category. Figure 4 shows AOI for task 2.
Figure 4. Areas Of Interests for routing task (Task 2). The black line indicates the (ideal) route linking the starting and the
arrival points.
c) Correlation between Heatmaps, AOI and verbal annotations. Verbal annotations are fundamental to define whether the duration of fixations is related to misunderstanding or interest.
3.1.3 Limitations of the protocol. The main limitation of the protocol was in the time allotted to subjects to perform their tasks (T1 et T2). The time was approximately 100 seconds for each task: this interval was necessary to facilitate image processing, which would otherwise have been too heavy. Therefore this limit does not allow having insights on longer ski maps consultations, which is normally the case in real life situations.
Another limit was reducing to 3 classes of objects for defining AOI. Initially 5 (see Methodology,) the categories of geographic objects were grouped and simplified into 3 categories of polygons comprising : geomorphology and geography (especially Horizons) for the category Geomorphology, ski runs and ski trails for the category Tracing and building and roads for the category Structures. This has been defined because of the difficulty of isolating gaze data collection on objects with very small area such as pictograms or proper names.
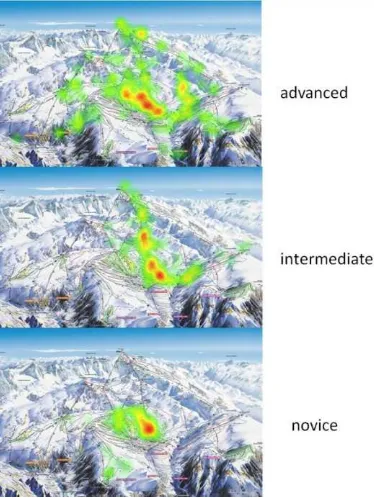
3.1.4 Preliminary results from gaze data. Preliminary qualitative results, and more specifically Heatmaps, allow us to answer to the first experimental question. Heatmaps show that in (the first 100 seconds of) a ski area valuation task (T1) subjects explore essentially the central area of the map. 3 types of behavior, corresponding to the ski level, can be easily recognized: advanced skiers sweep the area within the boundaries of ski areas, with greater intensity in the central axis of the domain; intermediate focus on the central axis of the domain to reach the highest peaks; novices are limited to the very central area of the ski resort.
The most striking result is that Heat maps show an overall lack of interest on horizons and panoramic borders of the panoramic map, and this for the different subjects’ ski level. Figure 5 shows an excerpt of Heatmps for T1.
Figure 5 Examples of heatmaps for exploring and assessing the ski resort task (T1)
In a way-finding task (T2) subjects explore the main ski trails and runs connection points. Unlike the results from T1, the HM corresponding to the gaze data of the 3 ski levels are rather uniform. This is due to the zones imposed by the route, but also from the fact that the 3 levels allocate the same visual attention in the same places of the route. Verbal annotations help us understand why (see below in the text).
Figure 6 shows an excerpt of Heatmps for T2.
Figure 6. Examples of heatmaps for creating a route task (T2).
Preliminary quantitative results from AOI analysis allow us to address the second experimental issue. They show that the
graphic objects representing ski trails and ski runs tracing are the most gazed to perform a ski area evaluation (T1) and a way-finding task (T2). The total fixation count for T1 clearly states that the linear, structural objects of the Tracing category are by far the most gazed. Figure 7 shows the total fixation count per objects category and per subjects’ ski level.
Figure 7 Total fixation count for graphic objects gazed during the visual exploration of the ski map (T1)
Figure 8 Total fixation duration for graphic objects gazed during the visual exploration of the ski map (T1)
We get almost the same result if we consider the time spent observing objects, as shown in Figure 8. Graphics objects representing the geomorphology and the relief (Geomorphology) are very poorly observed, so they seem not to be very relevant for the area evaluation.
Figure 4 shows the T2’s AOI on the snapshot; the black line indicates the “ideal” itinerary that the participants had to find to link the two locations. Naturally, the participants made ramblings and have not forthwith found the right path. AOI techniques allowed us to calculate in which area participants had more gazed while making decision. Graphics objects representing the geomorphology and the relief (i.e.: peaks and ridges, slopes, rocks, snow and ice, sunlight exposure, horizon...) seem to be very lightly focused by the user-skier in decision-making. Figure 9 shows the distribution of the total fixations count for T2 by participant’s ski level.
Figure 9 Total fixation count for graphic objects gazed during a creating route task (T2)
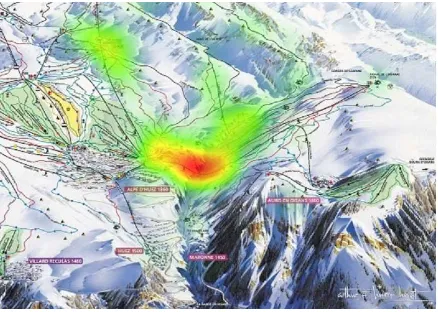
Finally, combining gaze data and verbal data notations, we could answer to the third experimental question and identify the "critical areas" of the map, those who generate the misunderstanding, doubt, uncertainty ... Notably in task 2, they correspond to highly deformed areas with important connection nodes. These areas have very high visual attention rate. A significant example is the crossing area from the central site of Alpes d’Huez to Auris en Oisans domain: all the heatmaps related to the route task, show a high focus of gaze in this passage and speeches express significant difficulties in understanding the information. Figure 10 show one of the heatmaps of the crossing area, correlated with some Verbatim.
Verbatim
"I can go by here, but it looks a bit confusing, I do not know why, maybe it's closeness to the slopes, the mountain ..."
“This passage troubles me because I do not understand with this shadow, if the only way to cross is that track…I do not know in which direction goes this curve. I hesitate to venture
out there”
Figure 10 Excerpts of Heatmap and Verbatim from the crossing area between Alpes d’Huez and Auris en Oisans.
At that stage of the study, we identified the geographic objects that seem used by skiers to perform tasks and those which pose problems of misunderstanding. Since these preliminary results are based on analyzes of just a few individuals’ behaviors, we needed to validate them on a greater and more composite sample of subjects. This was achieved through the investigation of large scale audience, by means of an on line survey.
3.2 The large scale survey
In the second part of the experiment, we designed a survey to measure opinions with a sufficient number of participants and thus to assess previous results. In addition, the survey provided an opportunity to also explore practices and broad functions associated with the ski map.
The survey investigates 3 main topics: 1) during a skiing-day, in which tasks the ski map is (most) used; 2) in which moments of day when ski maps are (most) used, 3) what depicted information is (more) useful on a map.
In order to answer at these questions a picture of ski map of Alpes d’Huez has been provided to the participant. Answers were evaluated according to Likert summative scaling (very useful, quite useful, useless, I don’t know). Some others questions are designed to control sample of survey: 1) knowledge about Alpes d’Huez, 2) level of skiing practices 3) knowledge about cartography and 4) socio-demographics
features. Survey has been administered on line during 15 days. 92 answers have been gathered. Although sample size is less than 100, results are presented in percentage to ease reading. Sample includes 48% of men and 52% women. 67,5% of participants are experienced skiers. 66,3% practice a profession related to cartography. 57% of participants do not know Alpes d’Huez ski resort.
3.2.1 Limitations of the protocol. The main limitation of this protocol was the small number of responses. A larger number of replies would have been advisable to validate the qualitative results. Another limitation was the mode of administration of the survey: on-line. Indeed, to obtain a result with a better quality the survey should be administered in vivo in a real context of a ski resort.
3.2.2 Preliminary results from survey. A synthesis of preliminary results is presented hereinafter. Concerning the display type for geographic information used to organize a skiing day, 83% of participants assert they rely on ski paper map; only 23% of them used web sites and 9, 4% use mobile Apps.
Paper ski maps are useful to perform 4 tasks in ski days: to find the starting point (66,7%), to identify levels of ski runs (56,8%), to identify connections between ski trails (56,8%), to choose ski runs (55,6%). For the others tasks proposed by the survey, ski maps seem not to be really useful (percentage less than 25%). Figure 11 presents the percent of ‘very useful’ responses by task.
Figure 11. Percent of response “very useful” ski map when making a task in a ski resort.
Ski paper maps are being used at specific moments of the day: mostly when skiers arrive at the lift departures, during the breaks or when making decision is necessary (topic 2). Figure 12 shows the percent of responses according to the moments of a skiing-day.
Figure 12 Percent of response “Very useful” ski map in different moments of a skiing-day.
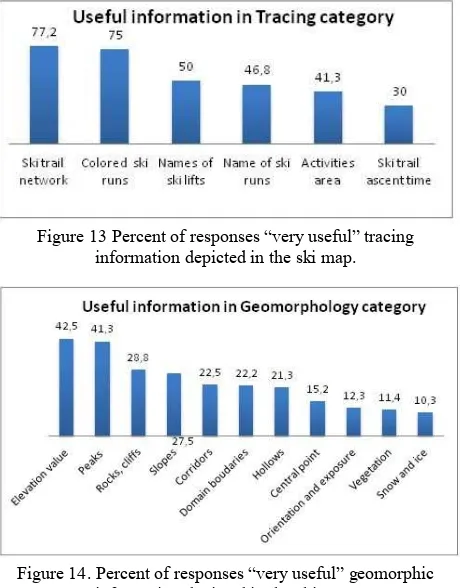
During a typical skiing-day, the most useful information (topic 3) to move through the ski area seem to be those related to the Tracing category, then those from Geomorphology and the last ones those from the Structure category. About Tracings information, as Figure 13 shows, ski trail network and colored ski runs are considered as ‘very useful’ (percent greater than 75%). Two geomorphological information, as Figure 14 shows, are more important than the others, Elevation value and Peaks (percentage greater than 40%). Once again, the information related to the landscape description is poorly mentioned. Information from the other categories seem not to be relevant, except Pictograms (31,3%) and Place names (27,8%).
Figure 13 Percent of responses “very useful” tracing information depicted in the ski map.
Figure 14. Percent of responses “very useful” geomorphic information depicted in the ski map.
These quantitative results fully confirm the insights overviewed in the analysis of gaze data verbal annotations about the information that is used by skiers to make decisions. Such complementarity in findings will be discussed in the following section.
4. DISCUSSION AND OUTLOOK
The visual-cognitive approach, based on mobile eye-tracking and on-line survey techniques, allowed highlighting the information necessary to a user to grasp a natural environment and to assess whether it is suited to his practice.
In response to our first research question, for ski area valuation and path definition tasks, the most helpful information seem to be those referring to mainly ski trails, ski runs and their connection points. Tracks located in the focal point of the map, which corresponds to the central area of the resort with the major ski trails axes, are those that attract the greatest attention. The interest in tracks is not surprising if one refers to Field (2010)’s outcome. His work shows that schematic map of Breckenridge ski resort (as London Tube map!) was better at supporting navigating transit and easier to interpret than the panoramic version (at least for advanced skiers). Users’ trend to
focus their attention on the main (linear) structuring elements on the map is also highlighted by the recent work from Ooms (2015) about complex map designs. The author indicates that in order to be able to create more effective maps it is essential to visualize data in a structured way. Linear geographic objects, as rivers and road network, also are the preferred information suggested by users in the survey carried out by Petrovic and Masera (2005) about 3D map content.
Information related to the landscape seems very poorly exploited. This leads us to discuss the second research question. The most interesting output relies on the relevance of the panorama view which has impacted the ski maps representation for decades and has led to the representation of local distortions of the mountain. The panorama seems to be relatively unexplored and the terrain draws attention if there is a trouble in comprehension: our preliminary results show that troubles in interpretation seem to be more evident in locations where there has been significant distortion (see Fig.10). The panorama view still fascinates, but contrary to conventional wisdom, the information it provides does not seem to be useful, at least in the context of the tasks that we observed.
Today, in a concern for improving ski map display, immersive environments coexist with the panorama views. With the latest generation of 3D ski map (i.e. Fatmap Apps) we can see the real mountain area views represented at different scales, which no longer include the whole horizon, but which are limited and detailed in space, providing more functional information. However, cognitive research on the impact that these technological solutions have on user behaviors, needs to be enriched. Methodological challenges and deeper insights will be expected from future works. These will involve experiments in the real world on visual matching process between objects in the natural environment and objects in the map, as well as experiments on visual attention in digital ski map prototypes. In self-location tasks effective visual exploration can be identified analyzing the switches between landmarks (i.e., peaks, rocks, cliffs) and useful map symbols. Experiments in real conditions (in winter ski resorts) compared to labs experiences would be worthwhile to investigate the balance between ecological validity and controllability (Kiefer et al., 2015).
In this perspective, future works should be based on exploratory methodologies, which can bring relevant tools for further analysis of digital ski resort mapping, for innovative geo-visualization design, according to new practices in mountain.
5. CONCLUSION
This paper reports the cognitive study which initiates a French research on the effectiveness of a particular geographic information representation: ski paper maps.
The main issue was to get insights about what and how information is processed by users, when performing ordinary tasks in a skiing-day. This approach allowed highlighting identifying the main functions of the ski map, the main geographic objects used in decision making, the main area gazed in the map and the main objects which cause problems in comprehension. The most unexpected outcome concerns the role of panorama.
The panoramic view has been a legacy of over 40 years of ski mapping and it has formatted the landscape reading of generations of mountain operators and practitioners. From a socio-historical perspective the MECOMO Project is a significant example of how empirical evidence-based approach can support the change. Based on human-subjects experiments, our results enhance the discussion on the effectiveness of the message that mountain operators want to convey to the tourist
and therefore, on the renewal of (geographical) information in ski resorts.
The main contribution of our approach is in terms of methodology: while analyzing the finer to the most general, this approach can be extended to other issues of geographic information’s effective design for mountain (and not only) in the digital era.
ACKNOWLEDGEMENTS
This work has been supported by national grants LABEX ITEM ANR-10-LABX-50-01and ANR-11-EQPX-0002. Access to the facility of the MSH-Alpes SCREEN platform for conducting the research is gratefully acknowledged.
REFERENCES
Balzarini, R., Dalmasso, A. and Murat, M., 2015. A study on mental representations for realistic visualization. The particular case of ski trail mapping. ISPRS Archives, Vol. XL-3/W3.
Bratkova, M., Shirley, P. and Thompson, W.B., 2009. Artistic rendering of mountainous terrain. ACM Transactions on Graphics, 28(4), pp. 1–17.
Chi, T.H.M., 1997. Quantifying Qualitative analyses of verbal data: a practical guide. The Journal of the Learning Sciences, 6(3), pp. 271–315.
Çöltekin, A., Fabrikant, S. I. and Lacayo, M., 2010. Exploring the efficiency of users' visual analytics strategies based on sequence analysis of eye movement recordings. International Journal of Geographical Information Systems, 24(10), 1559-1575.
Duchowski, A. T., 2000. Eye Tracking methodology: theory and practice. (2nd ed.), London: Springer.
Ericsson, K. A., 2006. Protocol analysis and expert thought: concurrent verbalizations of thinking during experts’ performance on representative tasks. The Cambridge Handbook of Expertise and Expert Performance. Cambridge University Press, NY, pp. 223-241.
Field, K. S., 2010. Gravity is your friend but every turn is a leap of faith: design and testing a schematic map for ski resort trails. The Cartographic Journal, 47(3), pp. 222-237.
Kiefer, P., Giannopoulos, I. and Raubal, M., 2014. Where am I? Investigating map matching during self-localization with mobile eye tracking in an urban environment. Transactions in GIS, 18(5).
Hegarty, M., Montello, D.R., Richardson, A. E., Ishikawa, T. and Lovelace, K., 2006. Spatial abilities at different scales: Individual differences in aptitude-test performance and spatial-layout learning. Intelligence, 34(2), pp. 151-176.
Hirtle, S., and Raubal, M., 2013. Many to Many Mobile Maps. In M. Raubal, D. Mark & A. Frank (Eds.), Cognitive and Linguistic Aspects of Geographic Space - New Perspectives on Geographic Information Research. Berlin, Heidelberg: Springer, pp. 141-157.
Holmqvist, K., Nyström, M., Andersson, R., Dewhurst, R., Jarodzka, H. and Van De Weijer, J., 2011. Eye Tracking - A
comprehensive guide to methods and measures. New York: Oxford University Press.
Jenny, H., Jenny, B., Cartwright, W. E. and Hurni, L., 2011. Interactive local terrain deformation inspired by hand-painted panoramas. The Cartographic Journal, 48(1), pp. 11–20.
Libarkin, J. C. and Kurdziel, J. P., 2002). Research methodologies in science education: the qualitative-quantitative debate. Journal of Geoscience Education, v.50, n.1, p. 78-86.
Lloyd, R., 1993. Cognitive processes and cartographic maps. In: Garling, T. and Golledge, R. G. (eds), Behavior and environment: psychological and geographical approaches. Amsterdam: North-Holland, pp. 141–169.
MacEachren, A. M., 1995. How maps work: representation visualization and design. New York: Guilford Press.
Montello, D. R., 2002. Cognitive map-design research in the twentieth century: theoretical and empirical approaches. Cartography and Geographic Information Science, 29 (3), pp. 283–304.
National Research Council, 2006. Learning to Think Spatially: GIS As a Support System in the K-12 Curriculum. Washington DC, National Academies Press.
Olsen, A. and Matos, R., 2012. Identifying parameter values for an I-VT fixation filter suitable for handling data sampled with various sampling frequencies. ETRA ’12, Santa Barbara, CA, USA.
Patterson, T., 2000. A view from on high: Heinrich Berann's panoramas and landscape visualization techniques for the U.S. National Park Service. Cartographic Perspectives, N°36.
Petrovic, D. and Masera, P., 2005. Analysis of user’s response on 3D cartographic representations. In Proceedings of the 22nd ICA International Cartographic Conference, Coruna, Spain.
Salvucci, D. D. and Goldberg, J. H., 2000. Identifying fixations and saccades in eye-tracking protocols. Proceedings of the
symposium on eye tracking research & applications, ETRA ’00. Palm Beach Gardens, Florida, United States, pp. 71-78.
Spengler, M. and Räber, S., 2012. Panoramic maps-evaluating the usability and effectiveness. Proceedings of 8th ICA Mountain Cartography Workshop, Taurewa, New Zealand.
Schobesberger, D. and Patterson, T., 2008. Exploring of effectiveness of 2D vs. 3D trail-head maps. Proceedings of 6th ICA Mountain Cartography Workshop, Switzerland.
Tait, A., 2010. Mountain ski maps of North America: preliminary survey and analysis of style. Cartographic Perspectives, N° 67.
Ware, C., 2008. Visual Thinking for Design. Elsevier, Burlington, 197.
Wiener, J. M., Hölscher, C., Büchner, S. and Konieczny, L., 2011. Gaze behaviour during space perception and spatial decision making. Psychological Research, pp. 1-17.