SPATIAL-TEMPORAL DETECTION OF CHANGES ON THE SOUTHERN COAST OF
THE BALTIC SEA BASED ON MULTITEMPORAL AERIAL PHOTOGRAPHS
K. Michalowska a*, E. Glowienka b , A. Pekala c
a Faculty of Environmental Engineering and Land Surveying, University of Agriculture in Krakow, Poland -
b Faculty of Environmental, Geomatic and Energy Engineering, Kielce University of Technology – [email protected] c Department of Geodesy and Geotechnics, Rzeszow University of Technology - [email protected]
Commission II, WG II/1
KEY WORDS: Multitemporal data, airborne orthophotomap, change detection, coastal area, Baltic sea
ABSTRACT:
Digital photogrammetry and remote sensing solutions applied under the project and combined with the geographical information system made it possible to utilize data originating from various sources and dating back to different periods. Research works made use of archival and up-to-date aerial images, satellite images, orthophotomaps. Multitemporal data served for mapping and monitoring intermediate conditions of the Baltic Sea shore zone without a need for a direct interference in the environment. The main objective of research was to determine the dynamics and volume of sea shore changes along the selected part of coast in the period of 1951-2004, and to assess the tendencies of shore development in that area. For each of the six annual data sets, the following were determined: front dune base line, water line and the beach width. The location of the dune base line, which reflects the course of the shoreline in a given year was reconstructed based on stereoscopic study of images from each annual set. Unidirectional changes in the period of 1951-2004 occurred only within 10% of the examined shore section length. The examined shore is marked by a high and considerable dynamics of changes. Almost half of the shore, in particular the middle coast shows big changes, in excess of 2 m/year. The limits of shoreline changes ranged from 120 to -90 m, and their velocity from 0 to 11 m/year, save that the middle and west parts of the examined coast section were subjected to definitely more intense shore transformations. Research based on the analysis of multitemporal aerial images made it possible to reconstruct the intermediate conditions of the Baltic Sea shoreline and determine the volume and rate of changes in the location of dune base line in the examined period of 53 years, and to find out tendencies of shore development and dynamics.
* Corresponding author
1. INTRODUCTION
Data obtained from the aerial ceiling and satellite ceiling constitute an important source of information in the investigation of the shore zone. Examples of application of teledetection methods in the investigation of coastal processes, and of phenomena occurring in direct neighbourhood of the seashore, as well as their effects can be found in many reference books and papers (Leatherman 1993, McClennen et al. 2000, Schwarzer et al. 2003, Ricchetti et al. 2004, Friedman et al. 2007, Musielak 1991, Zawadzka-Kahlau 1999, Łabuz 2002 a, b, Furmańczyk et al. 2005, 2006a,b, Michałowska et al. 2007. The work by Ricchetti (2004) presents an investigation of changes in the shore zone with the use of satellite and aerial images dating from three periods and covering in total more than 50 years. It demonstrates methods of determination of erosion and accumulation areas, and the assessment of the impact of man's activity within last several decades. In research on coastal changes and morphological changes of dunes conducted by Friedman (2007), multitemporal air images and DTM from two annual data sets were utilized. Investigation of changes in the range of deflation and accumulation, and analyses of horizontal dislocation of the biggest active dune field on the US east coast (North Carolina) (Mitasova et al. 2005) made use of multitemporal DEM from the period of 1974-2004.
The research area extends at the length of 32 kilometres along the south coast of the Baltic Sea. The characteristic element of that landscape is the Mierzeja Łebska Sandbar that isolates coastal lakes from the sea. In the central part of the sandbar, on the area of more than 500 ha, there are migrating dunes that travel with the speed of 3-10 km/year, from the west to the east, in accordance with the direction of prevailing winds (Miszalski 1973). The geological composition of surface formations that affect the development of morphological processes in the investigated area is little diversified. There are mainly four types of sedimentary rocks there, which differ both in respect of their age, and genesis. The most common material, especially in the sandbar strip, are marine accumulation sands that have been accumulating since the late Pleistocene until the present day, and have been transported in an eolian way to the back of the shore.
That area is marked mainly by low dune shores of diversified configuration, which – when moving away from the sea – evolves into sand banks of different height and width. There exists a typical arrangement of zones situated parallel to the sea shore. Along the shoreline, in the direct vicinity of water, there extends a beach, which transforms into a strip of white front dunes that sometimes are overgrown with high seaside grasses. Within the area under investigation, a whole array of different eolian forms can be found, connected both with the The International Archives of the Photogrammetry, Remote Sensing and Spatial Information Sciences, Volume XLI-B2, 2016
accumulation, and deflation activities of the wind (Borówka 1980). The accumulation forms include seaside barkhans, barkhan and crescentic dunes, crescentic dunes, bank dunes, as well as irregular hills.
2. DATA AND METHODOLOGY
2.1 Data
Digital photogrammetry and remote sensing solutions applied under the project and combined with the geographical information system made it possible to utilize data originating from various sources and dating back to different periods. Research works made use of archival and up-to-date aerial images, satellite images, orthophotomaps. Multitemporal data served for mapping and monitoring intermediate conditions of the Baltic Sea shore zone without a need for a direct interference in the environment (Michałowska, 2007). The main objective of research was to determine the dynamics and volume of sea shore changes along the selected part of coast in the period of 1951-2004, and to assess the tendencies of shore development in that area. For each of the six annual data sets, the following were determined: front dune base line, water line (the so-called shoreline), and the beach width. The location of the dune base line, which reflects the course of the shoreline in a given year was reconstructed based on stereoscopic study of images from each annual set.
To reconstruct the location of selected morphodynamical elements of the sea shore profiles, i.e. front dune base line and ridge line, six series of aerial photos of the south Baltic Sea from dune base line to base line (reference line) was measured, perpendicularly to elevation line, at 10-metre intervals. The base line was marked out on the basis of coast kilometre marker data provided by the Maritime Office, as marked on topographic maps, scale 1:10 000.
On the basis of distance between the base line and dune base line, values of difference in the location of dune base lines in particular years were calculated, and also charts of shore changes in successive time intervals were drawn.
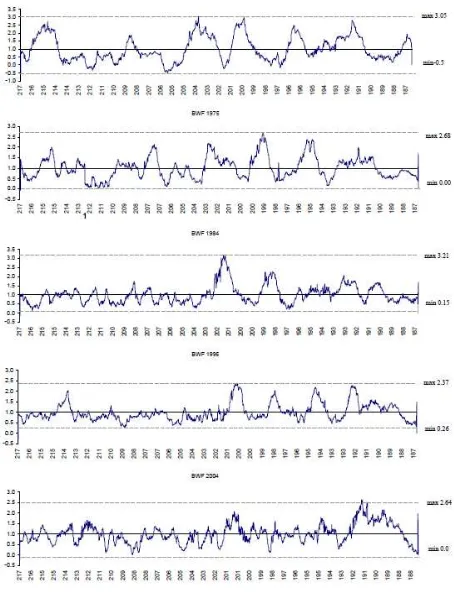
The beach width factor (BWF) was determined for the examined coast fragment. In order to establish the BWF value, average beach widths within the whole length of the coast section under consideration in successive years were calculated. By calculating the ratio of the beach width at each point (measured at 10-metre intervals) and the average beach width, the BWF values were obtained. Calculation results are displayed below (Fig. 4). Values higher than 1 (BWF>1) show places, in which the beach is wide, whereas values lower than 1 (BWF<1) show those beach sections, which are narrower than the average beach width. When the value equals one (BWF=1) this means that the beach width value amounts to the average beach width value (Furmańczyk 1994).
3. ANALYSIS OF RESULTS
3.1 Changes in dune base lines in particular time intervals
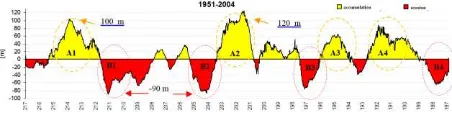
The analysis of the size of changes in dune base lines in the examined period of 1951-2004 demonstrates (Fig. 1) that in the investigated coast fragment dune base line has been subjected to considerable relocations, gaining, as a result of erosion, almost -90 m in the section near 211.1 (B1) and 204.0 (B2) coast kilometre marker points, while in the areas of 201.5 (A2) and 213.9 (A1) coast kilometre marker points it has gained, as a result of accumulation, 120 m and 100 m, respectively. When analysing Figure 38 in a greater detail, one can notice within the examined area the occurrence of a certain cyclicity of coast changes. One can also find out that areas A1, A2, A3 and A4 are, in a sense, equivalent, just like areas B1, B2, B3 and B4.
Figure 1. Changes in location of front dune base lines in the time period of 1951-2004 changes in the location of dune base line. The size of changes in dune base lines in individual periods falls within the range of 120 m to -88 m (Fig. 2). The biggest changes of an erosion (-88m, that is 8 m/year) and accumulation types (120m, that is 10.9 m/year) were recorded in the time period of 1964-1975. The period of 1984-1995 is also marked by high dune base line changes on the level of 90 m (8m/year). The amount of changes coincides with results obtained in the work that concerned a shorter piece of the coast (189th km-204th km) for the period of 1964-2004 (Dudzińska, Michałowska, 2008). Average values of changes of an accumulation type in successive time periods
Within the examined fragment of the south Baltic Sea coast, one can isolate characteristic zones of diversified nature and rate of ongoing geomorphological processes. The borders of those zones are relatively fixed ones, and can be found in the areas of 216 km, 213.5 km, 204 km, 196 km, and 190 km coast kilometre marker points. The biggest dune base line movement amounting to 96 m (>8 m/year) was identified in area IV in a section around 194.5-204.2 km coast kilometre marker points. The amplitude of change sizes in certain places amounts even to 170 m (in relation to 53 years), and has been shaped mainly by major accumulation and erosion changes in the period of 1964-1975, and also by significant transformations of the sea shore in successive time periods
Figure 2. Changes in location of dune base lines in particular time intervals (Y-axis shows dune baseline relocations in [m];
X-axis shows coast kilometre marker points).
3.2 The length of shore sections of an accumulation and erosion
On the basis of analysis of the total length of shore sections of accumulation and erosion types, performed for the coast fragment under examination in particular time periods, one can say that the length of accumulation sections and of erosion sections in four time periods, i.e. 1951-1964, 1964-1975, 1975-1984, and 1984-1995 is comparable.
Figure 3. Charts showing the length of particular shore sections [km] of accumulation and of erosion types in successive time
periods in the examined part of Baltic Sea coast
At the same time, in the first two time periods we can see that the total length of accumulation sections is slightly bigger, and differs by 0.9 and 0.4 km from that of erosion parts of the shore. On the other hand, in the successive years of 1975-1984 and 1984-1995, the situation is reverse: erosion sections are longer than accumulation sections by 1.6 and 0.4 km, respectively. In the last time bracket of 1995-2004 it can clearly be seen that the length of the coast sections of accumulation type has increased. Those sections constitute 66% of the length of the coast under examination. Accumulation processes are occurring within ca. 20 kilometres of the shore, while only 1/3 of the area (10 kilometres) are shore sections subjected to erosion. When analysing total lengths of accumulation and erosion sections in the whole multiannual period of 1951-2004, one can notice a slight (7%) predominance of accumulation type sections. Their length amounts to ca. 15 km (Fig. 3), whereas the length of the shore being destroyed by the sea constitutes 44% of the examined coast, and amounts to 13.1 km.
3.3 The beach width factor (BWF)
When analysing the BWF values in successive years (Fig. 4), one has to conclude that within the examined coast there occur, alternately, narrow and wide beach strips, and, at the same time, it is possible to isolate two characteristic areas: western, in which the BWF values is mainly lower than one, and eastern with the prevalence of wide beach sections. The border between those areas is relatively fixed, and is situated around the 201-204 km coast kilometre marker points (with a tendency of the border moving towards the east in successive years). The western area is marked by the prevalence of narrow beach sections and beach sections of variable width, in which, alternately, processes of beach destroying and rebuilding take place.
Figure 4. Beach width factor in successive years from 1964 to 2004 in the examined Baltic Sea coast
The average beach width in the western part is, in successive eastern coast beach in four consecutive annual data sets (1964-1995) exceeds 50 m, and amounts to 60 m (in 1964), and to 51 m and 55 m, respectively in the next two annual data sets. In 1995, the average beach width was the biggest, and amounted to 66 m. The lowest average value is that of the 2004 annual data set, when the average width of the beach (eastern) was only 44 m. The width of the beach in 1964 and in 1984 exceeded in some places 140 m around the 203rd kilometre and the 200th kilometre, as well as the 201st kilometre. Beach along the whole examined sections (187 km coast kilometre marker point to 217 km coast kilometre marker point) reached an average width of 49 m, 45 m, 46 m, 5 5m and 38 m.
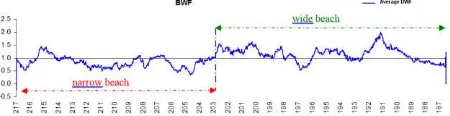
Figure 5. Average BWF value in the period of 1964-2004 in the examined part of Baltic Sea coast
On the basis of analysis of the chart that shows the average BWF value one can ascertain that the examined fragment of the part of Baltic Sea coast is split into two areas of narrow and wide beach, with a clearly identifiable border around the 203rd kilometre (Fig. 5). The western part of the beach is distinguished by BWF values being lower than 1 or sometimes approximating 1, except for the 215.3 km- 214.2 km section, where the BWF value does not exceed 1.5. The eastern part is marked by a definite prevalence of wide and very wide beach sections, as demonstrated by average BWF values over the unity line. An exception is the section around the 196 km-197 km coast kilometre marker points, and around 187 km-188.5 coast kilometre marker points, where average BWF values are lower than 1. By far, absolutely the highest value of the beach width factor amounting to 2 can be seen near the 191st kilometre, and in the section of 190 km-191.5 km coast kilometre marker
Digital photogrammetry and remote sensing solutions applied under the project and combined with the geographical information system made it possible to utilize data originating from various sources and dating back to different periods. Research works made use of archival and up-to-date aerial images, satellite images, orthophotomaps. Multitemporal data served for mapping and monitoring intermediate conditions of the Baltic Sea shore zone without a need for a direct interference in the environment.
The main objective of research was to determine the dynamics and volume of sea shore changes along the selected part of coast in the period of 1951-2004, and to assess the tendencies of observe accumulation and erosion processes taking place alternately. Unidirectional changes in the period of 1951-2004 occurred only within 10% of the examined shore section length. On the basis of dynamic shore classification for the examined part of Baltic Sea coast section in 1951-2004 it was found out that half of the examined section was of an accumulative nature, while more than 1/3 displayed erosional tendencies. Dynamic balance existed within only 14% of the examined shore area. The examined shore is marked by a high and considerable dynamics of changes. Almost half of the shore, in particular the middle coast (1/3 of the examined section) shows big changes, in excess of 2 m/year. No sections of stable shore occur within the selected part of coast The limits of shoreline changes ranged from 120 to -90 m, and their velocity from 0 to 11 m/year, save that the middle and west parts of the examined coast section were subjected to definitely more intense shore transformations. Research based on the analysis of multitemporal aerial images from 1951-2004 made it possible to reconstruct the intermediate conditions of the Baltic Sea shoreline and determine the volume and rate of changes in the location of dune base line in the examined period of 53 years, and to find out tendencies of shore development and dynamics. położenia linii brzegowej Mierzei Łebskiej w latach 1964-2004. Zintegrowane Zarządzanie Obszarami Przybrzeżnymi w Polsce – stan obecny i perspektywy. Morze – Ląd wzajemne relacje. Szczecin. pp. 151- 161.
Friedman S., Gao D., Newby R., 2007. Analysis of storm-induced geomorphic change of a Texas barrier headland using LIDAR and aerial photography. Proceedings of Coastal Zone 07, Portland Oregon.
Furmańczyk K., Benedyczak R., Dudzińska-Nowak J., Łęcka A., Szakowski I., Terefenko P., 2005. Zastosowania geoinformacji w analizie morskiej strefy brzegowej w Uniwersytecie Szczecińskim. Polskie Towarzystwo Informacji Przestrzennej. Roczniki Geomatyki 2005, Tom III, Zeszyt 4.
Furmańczyk K, Giza A., Terefenko P., 2006a. Dostępno ć plaży – wybrane przykłady rozwiązań. WŚ Furmańczyk K. (ed.) ZZOP Tom 2, Brzeg Morski – Zrównoważony. Uniwersytet Szczeciński, Szczecin.
Furmańczyk K, Dudzińska – Nowak J., 2006b. Przewidywanie wielko ci erozji brzegu w rejonie miejscowo ci Trzęsacz. WŚ Furmańczyk K. (ed.) ZZOP Tom 2, Brzeg Morski – Zrównoważony. Uniwersytet Szczeciński, Szczecin.
Leatherman S.P., 1993. Remote sensing applied to coastal changes analysis. Gurney. Foster. Parkinson [ed]. Global Change Atlas.
Łabuz T. A., 2002. Pokrycie plaż ro linno cią wydmotwóczą wskaźnikiem dynamiki wybrzeża Zatoki Pomorskiej. Czasopismo Geograficzne 73 (3), pp. 245-256
Łabuz T. A., 2002. Przykłady antropopresji na nadmorskich wydmach mierzei Bramy winy. [wŚ] P. Szwarczewski, E. Smolska (ed.), Zapis działalno ci człowieka w rodowisku przyrodniczym, Uniwersytet Warszawski, Warszawa, pp.75-84.
McClennen Ch., McCay H., Pearson M., 2000. Aerial Photography-Based GIS Analysis of the Eastern Lake Ontario Shore: Coastal zone change and processes 1938-1994. Report to The Nature Conservancy Central and Western New York Chapter Rochester, NY 14604.
Michałowska K. 2007. Analizy przestrzenno-czasowe zmian morfologicznych na terenie Słowińskiego Parku Narodowego latach 1964-2004. Archiwum Fotogrametrii, Kartografii i Teledetekcji, vol. 17, s. 473-484.
Michałowska K., Głowienka E., 2007. Integracja i przetwarzanie danych wieloczasowych w rodowisku GIS. Archiwum Fotogrametrii, Kartografii i Teledetekcji, vol. 17, s. 485-494.
Miszalski J., 1973. Współczesne procesy eoliczne na Pobrzeżu Słowińskim. Studium fotointerpretacyjne. Dokumentacja Geograficzna. IG PAN. Warszawa.
Mitasova H., Overton M., Harmon R., 2005. Geospatial analysis of a coastal sand dune field evolutionŚ Jockey’s Ridge, North Carolina. Geomorphology 72, pp. 204– 221.
Musielak S., Furmańczyk K., Osadczuk K., Prajs J., 1991. Fotointerpretacyjny Atlas Dynamiki Strefy Brzegu Morskiego. Lata 1958-1989. Odcinek winouj cie-Pogorzelica. Skala 1:5000. 21 sekcji. Instytut Nauk o Morzu US, OPGK Szczecin, pod red Musielaka. Wyd. Urząd Morski Szczecin.
Ricchetti E., Ricchetti G., Sani R., 2004. Environmental-Geological Study of Coastal Areas of Salento Peninsula (Southern Italy) using Multitemporal Aerial Photography and Satellite Imagery. Institute of Electrical and Electronics Engineers Digital Library.
Schwarzer K. , Diesing M., Larson M., Niedermeyer R.-O.,
Schumacher W., Furmańczyk K., 2003. Coastline evolution at different time scales. - Examples from the southern Baltic Sea (Pomeranian Bight) - Marine Geology, 194, pp. 79 - 101.
Zawadzka-Kahlau E. 1999. Tendencje rozwojowe polskich brzegów Bałtyku południowego. GTN. IBW. Gdańsk. 116.