Ž .
Atmospheric Research 53 2000 3–14
www.elsevier.comrlocateratmos
Response of the climatic temperature to dust
forcing, inferred from total ozone mapping
ž
/
spectrometer TOMS aerosol index and the NASA
assimilation model
qP. Alpert
a,), J. Herman
b, Y.J. Kaufman
c, I. Carmona
a aDepartment of Geophysics and Planetary Sciences, Tel-AÕiÕUniÕersity, POB 39040,
69978 Ramat AÕiÕ, Israel b
TOMS AerosolrUV Projects, Code 916, NASArGSFC, Greenbelt, MD, 20771, USA
c
Climate and Radiation Branch, Code 913, NASArGSFC, Greenbelt, MD 20771, USA
Abstract
Ž
Recently, Alpert et al. Alpert, P., Shay-El, Y., Kaufman, Y.J., Tanre, D., DaSilva, A., Schubert, S., Joseph, J.H., 1998. Quantification of dust-forced heating of the lower troposphere,
Ž . Ž . .
Nature 395 6700 , 367–370, 24 September . suggested an indirect measure of the tropospheric temperature response to dust aerosols by using model updates — roughly speaking model errors
Ž .
— of the NASA Goddard Earth Observing System version No. 1 GEOS-1 data assimilation system. They have shown that these updates, which provide information about missing physical processes not included in the predictive model, have monthly mean patterns, which bear a striking similarity to patterns of dust over the Atlantic. This similarity in the number of dusty days was used to estimate the atmospheric response to dust. Here, the study is extended for all the major
Ž .
subtropical deserts over Africa and Asia using the total ozone mapping spectrometer TOMS
Ž . Ž
aerosol index AI for dust recently derived by Herman et al. Herman, J.R., Bhartia, P.K., Torres, O., Hsu, C., Seftor, C., Celarier, E., 1997. Global distribution of UV-absorbing aerosols from
.
Nimbus 7rTOMS data, J. Geophys. Res. 102, 16911–16922. . It is shown that the TOMS dust is highly correlated with the model errors with a maximum at the altitude of about 580 hPa and for the month of June with average correlation coefficient of 0.69 reaching up to 0.8 for specific
q
Part of work was done while on sabbatical leave at Data Assimilation Office, code 910.3, NASArGSFC, Greenbelt, MD 20771, USA.
)Corresponding author. Tel.:q972-3-640-7380; fax:q972-3-640-9282.
Ž .
E-mail address: [email protected] P. Alpert .
0169-8095r00r$ - see front matterq2000 Elsevier Science B.V. All rights reserved. Ž .
( ) P. Alpert et al.rAtmospheric Research 53 2000 3–14
4
months. In contrast to the previous study where only dust over ocean was employed, here, much higher dust concentrations are detected and the linear heating for weak dust becomes quickly saturated for AI above 1.5, then drops for very high values of AI that exceed about 3. This result is consistent with the theoretical predictions.q2000 Elsevier Science B.V. All rights reserved.
Keywords: Dust; Dust aerosols; Climate forcing; TOMS; Data assimilation; Model errors; Climate change
1. Introduction
Aerosol particles may affect climate through absorption and scattering of solar radiation and, in case of the large dust particles, interact with the thermal radiation, e.g.,
Ž . Ž .
Charlson et al. 1992 and Tegen et al. 1996 . The question is whether the atmospheric temperatures respond significantly to this or to any other type of radiative forcing since feedback mechanisms can increase or decrease the effect down to zero. So far, the
Ž .
temperature response has not been detected. Alpert et al. 1998 proposed an indirect measure of the tropospheric temperature response using updates — roughly speaking, model errors — of the NASA Goddard Earth Observing System version No. 1
ŽGEOS-1 data assimilation system. These updates, which provide information about.
missing physical processes not included in the predictive model, have monthly mean patterns, which bear a striking similarity to patterns of dust over the Atlantic. This similarity, as well as the high correlations between latitudinal location of maximum heating in atmospheric modeling updates and that of the number of dusty days, suggests that dust aerosols are an important source of errors in numerical weather prediction models over the Atlantic Ocean. For the average dust event, dust has found to heat the lower troposphere at the 850–700 hPa layer by ;0.2 Krday corresponding to an annual rate of about 6 Kryear.
The above result is somewhat surprising in face of the common belief that cloud and
Ž .
water processes are predominant in prescribing the model errors Arking, 1991 . Although cloudy pixels were mostly filtered out in this study, some of the effects of dust may have been manifested through their influence on clouds. However, a reflectivity
Ž .
filter was put on the total ozone mapping spectrometer TOMS data to discriminate against clouds as discussed in Section 2.1. Most current atmospheric models do not include the aerosol processes because aerosols are not properly monitored on a global scale, and their spatial distributions are, therefore, not known as required for their
Ž .
incorporation in operational GCMs Prospero et al., 1995 .
Along with the increased awareness to the importance of dust and other aerosols in climate, enhanced efforts were done to better monitor the atmospheric aerosols on a more regular basis. Recent successes using remote sensing over oceans are striking
ŽHusar et al., 1997; Tanre et al., 1997 . Preliminary dust climatologies have been.
Ž .
performed as, for instance, the 5-year study by Jankoviak and Tanre 1992 over the E. Atlantic. Such climatologies, along with atmospheric dynamical data, also allow studies of the relationships between dust and synoptic systems like the North-Atlantic
Oscilla-Ž .
( )
P. Alpert et al.rAtmospheric Research 53 2000 3–14 5
water because of the requirement for low, nonvariable surface reflectivity. A new
Ž .
technique for detecting ultraviolet UV -absorbing aerosols in the atmosphere is based on the TOMS measurements and will be employed here.
The current study attempts to assess the temperature response of the atmosphere to aerosol forcing by studying the errors of a GCM without aerosol physics within a data
Ž .
assimilation system. In contrast to Alpert et al. 1998 where only aerosols above the Atlantic Ocean were investigated, here, the major subtropical deserts over Africa and
Ž .
Asia are targeted employing the TOMS aerosol index AI as introduced by Herman et
Ž .
al. 1997 . Section 2 describes the TOMS aerosols’ method and the model updates.
2. Methodology
2.1. Detection of aerosols by the TOMS instrument
For global remote dust detection, the AVHRR observations, e.g., by Husar et al.
Ž1997 and Jankoviak and Tanre 1992 , are mostly limited to over water because of the. Ž .
requirement for low, nonvariable surface reflectivity. A new technique for detecting
Ž
UV-absorbing aerosols in the atmosphere is based on the spectral contrast ratio of
.
340–380 nm radiance between two of the TOMS channels available from the
NIM-Ž .
BUS-7 satellite from November 1978 to May 1993 Herman et al., 1997 . The UV spectral contrast method does not suffer from the limitation of visible-wavelength techniques, since the UV surface reflectivity is low and nearly constant over both land and water. Hence, the global daily coverage for the UV-absorbing aerosols available through this technique for about 14 years are the major experimental component of the analysis in the current study. There is some cloud contamination that is unavoidable in the TOMS AI signal. The data are filtered for clouds by only including pixels for which the scene reflectivity is no more than 10% above the known surface reflectivity. Therefore, in the 100=100 km2, there can be a small amount of subpixel
contamina-tion. Large particle Saharan dust will decrease the reflectivity below the background by a few percent, while small particle dust can increase the reflectivity by 2% or 3%.
Ž .
Smoke or non-UV absorbing aerosols e.g., sulfate will increase the reflectivity by 3% to 5%. Another limitation of the TOMS AI is its inability to fully detect the aerosols
Ž .
within the 1–2 km above the surface Herman et al., 1997 .
The other component to be used in conjunction with the TOMS aerosol data in this study are the NASA reanalyzed datasets covering the period 1979–1993. This is described next.
( )
2.2. Model errors and incremental analysis updates IAU NASA reanalysis
In a data assimilation system, observational data is used to correct a short-term
Ž .
()
P.
Alpert
et
al.
r
Atmospheric
Research
53
2000
3
–
14
6
Fig. 1. Global dust AI distribution up to"608latitude for average July 1989–1990 as observed by the TOMS UV sensor that detects the presence of absorbing
Ž .
()
P.
Alpert
et
al.
r
Atmospheric
Research
53
2000
3
–
14
7
Ž .
Fig. 2. Global IAU NASA-GEOS1 field in Krday up to"608latitude for average July 1989–1990 for the temperature at sigma level 13, i.e., at about 580 hPa
Žequivalent to about 4 km . Since the IAU fields are calculated every 6 h, about 240 simulations were employed for the production of this figure of a 2-year monthly.
( ) P. Alpert et al.rAtmospheric Research 53 2000 3–14
8
A typical analysis equation is:
waswfqK w
Ž
oyH wf.
,Ž .
where w is the analysis state vector, w is the forecast state vector first guess , w isa f o the observation vector, H is the ‘‘interpolation’’ operator, and K is the weight matrix. Traditional intermittent data assimilation systems update the model state with the analysis w every synoptic time. In GEOS-1a rDAS, the analysis increments wayw aref
introduced every 6 h as forcing terms in a continuous model integration:
Ew waywf
sFadv
Ž .
w qFphysŽ .
w q .Et 6 h
These IAUs act as a low-pass filter eliminating the need for initialization, eliminate spin-up, etc. These field differences between the analysis and the first guess or the
Ž .
analysis increments or updates result, in part, from a complex combination of all model errors due to inadequate representation of physical processes, i.e., the model parameterizations, as well as due to numerical errors and processes that have been ignored. In brevity, these increments may be entitled as ‘‘model errors’’. We note that in
Ž .
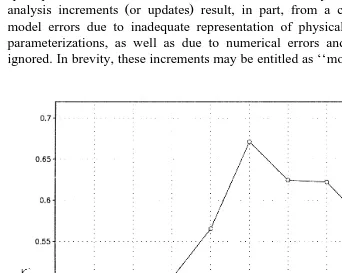
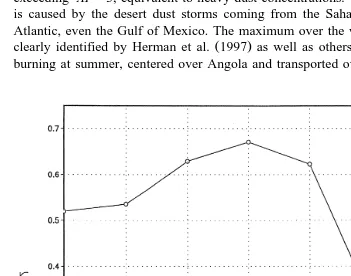
Fig. 3. The monthly variation in the correlation coefficients over the dusty region 14–308N, 0–1208E with an
Ž .
( )
P. Alpert et al.rAtmospheric Research 53 2000 3–14 9
the implementation of the GEOS-1 assimilation scheme, the analysis increments are not inserted fully at each analysis time but, instead, they are gradually inserted over the 6-h period straddling the analysis time. This process is called IAU. The IAU scheme avoids shocking the system, which can lead to spurious oscillations in the assimilating GCM
ŽDaley, 1991; Bloom et al., 1996 ..
3. Global dust and model updates — IAU
Ž .
Fig. 1 shows the global excluding near-polar regions dust AI distribution average for July 1989–1990 as observed by the TOMS UV sensor that detects the presence of
Ž .
absorbing aerosols over land and oceans Herman et al., 1997; the cover page picture . Maxima in the AI are over W. Sahara, Arabia Peninsula and S.W. Africa with values exceeding AIs3, equivalent to heavy dust concentrations. The most prominent feature is caused by the desert dust storms coming from the Sahara and reaching across the Atlantic, even the Gulf of Mexico. The maximum over the west coast of S. Africa was
Ž .
clearly identified by Herman et al. 1997 as well as others due to the strong biomass burning at summer, centered over Angola and transported over the Atlantic Ocean. For
Fig. 4. The variation with altitude of the correlation of the dust AI and the model errors. Altitude is given by
Ž .
( ) P. Alpert et al.rAtmospheric Research 53 2000 3–14
10
Ž .
Fig. 5. The TOMS dust AI shaded and dashed contours for June 1990 and at the altitude of 580 hPa. The
Ž .
region area is 14–308N, 0–1208E . Coast lines are indicated in full lines.
comparison, Fig. 2 shows the global IAU field for the temperature at about 580 hPa
Žequivalent to about 4 km . This level, as shown later, was found to be best correlated.
over the global region with the TOMS AI over the subtropics. The major centers of dust from Fig. 1 can be traced in Fig. 2 but with some significant variations. First, the IAU shows high centers of model errors over the mountainous regions of the Rockies and the Ands, which have nothing to do with dust but are caused mainly by errors in the high mountain representation in the models. This is common in most models, e.g., Alpert and
Ž .
Neumann 1984 . The dust plume off the Sahara coast and over the Atlantic is not well
Ž .
seen in this 580 hPa IAU map. In Alpert et al. 1998 , the corresponding 850–700 hPa layer temperature heating was better correlated with the dust as suggested by dust
Ž . Ž .
measurements, e.g., Prospero and Nees 1986 and Westphal et al. 1987 . Also, the IAU field is much smoother due to the wider range of values, which includes extremely high
Ž .
dust AI values over the Sahara as well as negative IAU errors in blue . However, the Arabian Peninsula maxima and somewhat also over the region west to the Thar desert in India and Pakistan seem to be captured by the additional heating missed by the model and represented by the IAU. In the following sections, focus will be given to the subtropical desert belt over Asia and Africa.
4. Monthly and altitude variation
Ž
The dusty region chosen for our further more detailed analysis is 14–308N,
.
0–1208E shown in Figs. 5 and 6. Over this region, other potential sources of model
Ž .
( )
P. Alpert et al.rAtmospheric Research 53 2000 3–14 11
errors, like topography, seem to be less pronounced, while the dust concentrations as represented by the AI index are relatively high. The fact that the model update field of IAU is four-dimensional allows the exploration of the optimally correlated altitude with the dust as well as other characteristics. For instance, Fig. 3 shows the monthly variation in the correlation coefficients over our dusty region with an average maximum of 0.67
Ž .
for the 8 years, 1985–1992 total of 3528 points . For each year, the correlation coefficient was computed based upon 441 points equal to 49 longitudinal by 9 latitudinal points; the IAU data has the horizontal resolution of 28N and 2.58E. The correlation oscillates between 0.62 to 0.80. In June 1990, the highest correlation coefficient of 0.8 was found and the corresponding figures are shown in Section 5. Fig. 4 shows the variation with altitude of the correlation of the dust AI and the model errors. Altitude is
Ž . Ž .
given by the sigma normalized pressure level in the model see caption and increases
Ž .
Fig. 7. Scatter plot for all the IAU temperature pixels in Krday vs. the dust AI pixels in the domain as in
Ž .
( ) P. Alpert et al.rAtmospheric Research 53 2000 3–14
12
downward. At sigma level 13, corresponding to about 580 hPa, correlation maximizes at 0.64 and drops quickly at lower elevations. This probably reflects the fact that at the lower half of the dust layer, the heating quickly drops as predicted, for instance, by
Ž .
theoretical model of Carlson and Benjamin 1980 ; such a drop in the heating rate is also predicted at altitudes beneath the top of heavy dust layers as is also found in the scatter
Ž .
plot presented in Section 5 i.e., Fig. 7 .
Figs. 5 and 6 show the TOMS dust index and the IAU heating in Krdays for the best-correlated month of June 1990 and at the altitude of 580 hPa. The coefficient of correlation is about 0.80. Here, the maxima in both figures look quite similar, suggesting that the dust is indeed a major contributor to the atmospheric model errors.
5. Scatter plot
Ž .
Fig. 7 shows the scatter plot for all the IAU temperature pixels i.e., 2=2.58 vs. the
Ž .
dust AI pixels about 1=18, i.e., 3528 points. There is a close to linear relationship indicating a linear increase of the heating with the increase of dust up to AI of about 1–1.5. For higher dust levels, the curve clearly indicates saturation as already suggested
Ž .
by Alpert et al. 1998 based on the Atlantic number of dusty days inferred from the
Ž .
AVHRR images, Jankoviak and Tanre 1992 . Here, we have the first opportunity to explore the heating relationship for high and very high dust concentrations since the TOMS AI allows estimations of dust over land, where AI values exceed the index of 3. It is interesting to point out that for very high dust levels, i.e., AI greater than 2.5–3, there is a clear drop in heating, which fits theoretical estimations for the reduced heating below dense layers of dust.
6. Summary
Ž
A major question regarding this study as raised by T.N. Krishnamurti, personal
.
communication is as follows. How come the IAU error correlation seems to show a preference to the exclusion of dust and not due to other effects like clouds, HadleyrWalker circulations, trade winds, radiation, resolution, etc. Next, four primary reasons are suggested for this .
First, the other effects on the model errors certainly do exist. Actually, the monthly correlations of the IAU with ISCCP cloudiness over the E. Atlantic do show even higher correlations in some months. However, the pixel-by-pixel overall correlation for the full year is close to zero. This complex IAUrcloud relationships are obviously strongly dependent on the cloud parameterizations and conclusive results are impossible. In contrast, the IAUrdust relationship is not interfered with any parameterization since
Ž .
dust is not incorporated yet in the assimilation system. The IAUrcloud relationships
Ž .
are discussed in regards to the E. Atlantic region by Shay-El et al. 1999 .
( )
P. Alpert et al.rAtmospheric Research 53 2000 3–14 13
large number of simulations, e.g., on a climate scale. For instance, 1 month of IAU averages consists of about 4=30s120 model simulations since the assimilation cycle is every 6 h. At the same time, the response to the dust, particularly at the top of the dust layer, seems to have a clear preference toward heating, i.e., positive IAU.
Third, the present study selectively focuses on regions where dust was found most frequent — the subtropical deserts.
Forth, the IAU reflect model errors generated by the relatively very short-range 6-h runs of the assimilation cycle, also frequently entitled as the first-guess run of the assimilation system. This short-period runs, initialized with the best available reanalysis, seem to have a strong preference to the exclusion of dust in the radiative physics and, probably, lesser to other indirect effects, particularly those that require longer time scales to evolve, like weaknesses in representation of the HadleyrWalker over-turnings or the radiative effects on the subsidence in the subtropical high regions.
In summary, this work shows for the first time, though indirectly, the atmospheric climatic response of the temperature field to the radiative forcing of the dust layer over the subtropical deserts. The resulting heating rate increases linearly up to about 0.4 Krday within the dust layer at 4 km and is in agreement with calculated heating rates
ŽCarlson and Benjamin, 1980; Pick, 1991 and, therefore, may be used for improvements.
of atmospheric predictions once dust loading are monitored daily via satellite as planned
Ž .
from the Moderate Resolution Imaging Spectroradiometer MODIS instrument on the
Ž .
earth-observing system Kaufman et al., 1997 .
It is not yet quite clear why the maximum error correlation with the TOMS AI was obtained at the level of about 580 hPa, a level which seems somewhat higher than the average levels of high dust concentration. Investigation of this question requires better monitoring of global dust, particularly of vertical profiles not available yet from the TOMS.
Acknowledgements
Ž .
Work was partly performed while the first author PA held a National Research Council-NASArGSFC Research Associateship. The study was supported by the US– Israel Bi-National Science Foundation Grant No. 97-00448.
References
Alpert, P., Ganor, E., 1993. A jet-stream associated heavy dust storm in the Western Mediterranean. J. Geophys. Res. 98, 7339–7349.
Alpert, P., Neumann, J., 1984. On the enhanced smoothing over topography in some mesometeorological models. Boundary-Layer Meteorol. 30, 293–312.
Alpert, P., Shay-El, Y., Kaufman, Y.J., Tanre, D., DaSilva, A., Schubert, S., Joseph, J.H., 1998. Quantification
Ž . Ž .
of dust-forced heating of the lower troposphere. Nature 395 6700 , 367–370, 24 September .
Alpert, P., Ziv, B., 1989. The Sharav cyclone — observations and some theoretical considerations. J. Geophys. Res. 94, 18495–18514.
( ) P. Alpert et al.rAtmospheric Research 53 2000 3–14
14
Bloom, S.S., Takacs, L.L., da Silva, A.M., Ledvina, D., 1996. Data assimilation using incremental analysis updates. Mon. Weather Rev. 124, 1256–1271.
Carlson, T.N., Benjamin, S.G., 1980. Radiative heating rates for Saharan dust. J. Atmos. Sci. 37, 193–213, See Figs. 12, 13.
Charlson, R.J., Schwartz, S.E., Hales, J.M., Cess, R.D., Coakley, J.A. Jr., Hansen, J.E., Hoffman, D.J., 1992. Climate forcing by anthropogenic aerosols. Science 255, 423–430.
Daley, R., 1991. Atmospheric Data Analysis. Cambridge Univ. Press, New York.
Herman, J.R., Bhartia, P.K., Torres, O., Hsu, C., Seftor, C., Celarier, E., 1997. Global distribution of UV-absorbing aerosols from Nimbus 7rTOMS data. J. Geophys. Res. 102, 16911–16922.
Husar, R.B., Prospero, J.M., Stowe, L.L., 1997. Characterization of tropospheric aerosols over the oceans with the NOAA advanced very high resolution radiometer optical thickness operational product. J. Geophys. Res. 102, 16889–16910.
Jankoviak, I., Tanre, D., 1992. Satellite climatology of Saharan dust outbreaks: method and preliminary results. J. Clim. 15, 646–656.
Kaufman, Y.J., Tanre, D., Remer, L., Vermote, E., Chu, A., Holben, B.N., 1997. Remote sensing of tropospheric aerosol over land from EOS moderate resolution imaging spectroradiometer. J. Geophys. Res. 102, 17051–17068.
Moulin, C., Lambert, C.E., Dulac, F., Dayan, U., 1997. Control of atmospheric export of dust from North Africa by the North Atlantic oscillation. Nature 387, 691–694.
Pick, C., 1991. Transport of desert aerosols and their influence on local temperature and motion, PhD Thesis
Žin Hebrew Tel Aviv University, Tel Aviv..
Prospero, J.M., Nees, R.T., 1986. Impact of the North African drought and El Nino on the mineral dust in the Barbados trade winds. Nature 320, 735–738.
Prospero, J.M., Schmitt, R., Cuevaz, E., Savoie, D.L., Graustein, W.C., Turekian, K.K., Volz-Thomas, A., Diaz, A.D., Oltmans, S.J., Levy, H. II, 1995. Temporal variability of summertime ozone and aerosols in the free troposphere over the eastern North Atlantic. Geophys. Res. Lett. 22, 2925–2928.
Schubert, S., Rood, R., Pfaendtner, J., 1993. An assimilated data set for Earth Science applications. Bull. Am. Meteorol. Soc. 74, 2331–2342.
Shay-El, Y., Alpert, P., Kaufman, Y.J., Tanre, D., da Silva, A., Schubert, S., Joseph, J.H., 1999. Lower-tropo-spheric response to dust as inferred from correlations between dust frequencies and analysis increments from GEOS-1 multi-year assimilation, submitted for publication.
Tanre, D., Kaufman, Y.J., Herman, M., Mattoo, S., 1997. Remote sensing of aerosol over oceans using the EOS-MODIS spectral radiances. J. Geophys. Res. 102, 16971–16988.
Tegen, I., Lacis, A.A., Fung, I., 1996. The influence of mineral aerosols from disturbed soils on the global radiation budget. Nature 380, 419–422.
Westphal, D.L., Toon, O.B., Carlson, T.N., 1987. A two-dimensional numerical investigation of the dynamics
Ž .