ANALYSIS
Estimating price compensation requirements for eco-certified
forestry
Brian C. Murray
a,*, Robert C. Abt
baResearch Triangle Institute,Center for Economics Research,3040Cornwallis Road,Research Triangle Park,NC27709,USA bNorth Carolina State Uni6ersity,Department of Forestry,Raleigh,NC27695,USA
Received 6 March 2000; received in revised form 16 June 2000; accepted 29 June 2000
Abstract
Eco-certified forestry (ECF) is defined as forest management that incorporates ecological concerns into commercial timber production. In this paper, we link the adoption of ECF practices to shifts in the timber supply function. We use a spatially disaggregated model of southeastern US timber supply to simulate the empirical relationship between variations in the price premium offered for timber produced under ECF regimes and producer surplus-maximizing rates of ECF. The simulation results suggest that a large share of nonindustrial private timber suppliers in the region may have relatively small compensation requirements, but complete adoption by the sector would require a large premium. © 2001 Elsevier Science Ireland Ltd. All rights reserved.
Keywords:Forest certification; Sustainable forest management; Timber supply; Economic instruments
www.elsevier.com/locate/ecolecon
1. Introduction and background
Concern over a global decline in the abundance and ecological integrity of forested ecosystems led to the establishment of sustainable forest manage-ment (SFM) principles at the 1992 UNCED con-ference in Rio de Janeiro. Countries throughout the world are now undertaking efforts to abide by the SFM principles and to devise plans to achieve forest sustainability in the near future.
Concurrent with the growing concern over the world’s forests has been the increased use of market-based incentives for environmental protec-tion. While market incentives have traditionally been viewed as an instrument at the government’s disposal (e.g., tradable permits and externality taxes), nongovernmental entities have entered the arena with the use of eco-labels for environmen-tally friendly production practices. Together these trends provide the foundation for a system of forest certification, wherein timber producers vol-untarily adopt a management regime that a third party deems is ecologically sound and respectful * Corresponding author. Tel.: +1-919-5416468; fax: +
1-919-5416683.
of local cultures.1 The underlying premise is that
when forest practices become an observable at-tribute of the final product consumers can act on their preferences for products deemed more sus-tainable in their production methods. This creates market demand for certified products and, by extension, for sustainable forest practices.
The paper focuses on the ecological (rather than cultural) aspects of certification and associates forest certification with the adoption of ‘eco-cer-tified forestry’ (ECF) because, as difficult as it may be to model certain ecological interactions with the forest production process, modeling the effects of cultural factors such as respect for indigenous populations and local community stability would be virtually impossible. Therefore, this paper does not seek to model the effects of forest certification, per se, rather it models the adoption of forest practices tied to certification’s ecological objectives. The paper provides a brief background on the history and objectives of forest certification. It then describes a conceptual model of timber sup-ply, focusing on the effect that a change in supply conditions, such as those imposed by ECF, can have on output decisions and producer welfare, both within a single period and over time. The model produces a measure of the compensation required to adopt ECF. The modeling framework is applied to data from the southeast US to examine the potential effect of ECF standards on compensation requirements for categories of pri-vate timber suppliers there.2
1.1. Global criteria and regional standards
The dominant third-party certification program throughout the world operates under the auspices of the Forest Stewardship Council (FSC). The FSC is an independent, nonprofit organization based in Oaxaca, Mexico, that was founded in 1993 by a consortium of parties ranging from environmental organizations to timber companies. The FSC’s main function is to serve as an interna-tional accrediting organization for certifiers — those parties that actually verify compliance with FSC standards.
This standards-setting process is tied directly to the SFM principles established at the 1992 UN-CED Conference in Rio de Janeiro (Elliott and Donovan, 1996). The FSC is seeking to establish internationally recognized principles and criteria of forest management as a basis for accrediting regional certifiers. From this set of principles, regional groups develop standards suitable to the region’s ecology, economy, and social conditions. The FSC principles serve as general guidelines for SFM, but the actual guidelines for on-ground forest management are developed at the regional level by different groups in collaboration with stakeholders.
Our analysis draws from the development of FSC certification standards for the southeastern US. Standards have been developed after consul-tation with stakeholder groups through a series of public meetings and the subsequent formation of a workgroup that is refining the standards subject to public feedback.3 Our approach is to model the
effects of those general features that relate to activities such as the conversion of natural forests to plantations, the intensity of plantation
manage-1Different types of certification are distinguished by the
party verifying the action. Under first-party certification, the entity itself declares that it meets certification standards. Un-der second-party certification, an organization to which the entity belongs (e.g. a professional or trade organization) ver-ifies compliance. When an independent organization having no affiliation with the entity(ies) seeking certification verifies com-pliance, this is referred to as third-party certification. Third-party certification is the primary focus of this paper.
2In this paper we focus solely on the compensation
require-ments of suppliers. A more general equilibrium system might take this several steps further and solve for equilibrium be-tween the certified and noncertified markets on both the supply side and the demand side. But that would require a detailed specification of certified and noncertified consumers and an empirical characterization of their choices at different price premia, which is beyond the scope of this paper.
3Standards development in the southeastern US is a
ment, and the establishment of forest reserve areas.
1.2. Pre6ious research
Economic studies of certification have focused primarily on the demand side, particularly regard-ing consumers’ willregard-ingness to pay (WTP) premia for certified products (Winterhalter and Cassens, 1993; Ozanne and Vlosky, 1997; Stevens et al., 1997; Vlosky and Ozanne, 1997). These studies have all employed survey methods and find a wide range of sometimes conflicting evidence on the portion of consumers who are willing to pay any premium at all for certified products (the size of the market), 3 – 70%, and the average size of the WTP premium held by certified product con-sumers, 0 – 20%.
Analysis of certification’s supply-side issues have been either descriptive (Baharuddin, 1995; Simula, 1996; Kiker and Putz, 1997) or theoretical (Murray and Casey, 1998; Swallow and Sedjo, 2000), but no rigorous empirical examination has been performed to gauge the potential size and distribution of certification impacts on timber supply. This paper addresses that gap in the liter-ature by empirically analyzing potential certifica-tion impacts on timber suppliers in the southeastern US.
2. Conceptual model
The certification decision is cast here as a choice between adopting ECF or continuing with the status quo forest management regime. We assume that the forest manager is endowed with a forest asset of specific size, quality, species, and age class characteristics and selects a regime that maximizes the value of the forest enterprise. The limits to optimization are the initial allocation of forest assets and the technology of forest produc-tion. We begin this section by defining the regime in terms of its key decision variables and its corresponding monetary value. We then identify how ECF constraints affect supply conditions and how this translates into a measure of compensa-tion (price premium) required to maintain welfare
equivalence between an ECF regime and the status quo.
2.1. Forest management regime
A regime is defined here as the specific plan for managing a forest property from the present time onward. The plan involves both a schedule for harvesting timber from evolving inventories and a schedule for investing in inventory development. We proceed by specifying single-period harvest and investment equations, respectively. Then, we aggregate these levels over time to express their effect on the forest asset value, the monetary return to a particular forest regime for a given area of forestland.4
2.1.1. Single-period timber supply
At any point in time, a manager decides how much timber to harvest based on his current endowment of timber and a variety of factors that determine how much of the endowment to harvest and how much to leave for the future. Year t
harvest quantities are thereby determined by the short-run (fixed inventory) supply function:5
Qt
s
=Qs(Pt,It,ht,v) (1)
where Pt is the price of timber, It is the forest inventory endowment, ht is the price of variable inputs directly associated with harvesting, andvis a vector of fixed characteristics of the landowner that affect the propensity to harvest timber. The v
factors might include the landowner’s marginal rate of time preference (discount rate) and factors indicating relative preference for timber and non-timber outputs. We assume the marginal opportu-nity cost function is increasing in output;
there-4The term ‘management regime’ has a very active
connota-tion, but it is also meant to capture passive management where the owner/manager explicitly or implicitly decides to forego silvicultural interventions, harvests, and the like. One reviewer has suggested that these owners might not respond to rational incentives, but we see no reason to conclude that such landowners are in any way acting irrationally. Rather we assert they are making rational choices to emphasize non-tim-ber forest outputs over timnon-tim-ber to satisfy their own preferences.
5See Wear and Parks (1994) p. 203 for a discussion of
fore, the harvest supply function is upward-sloping [#Qs
t/#Pt\0]. All else equal, output increases with the level of merchantable inventory available for harvesting [#Qs
t/#It\0]. Output is assumed to correspond negatively with a change in harvesting costs [#Qs
t/#htB0].
6These partial effects are
confi-rmed by empirical analysis of timber supply (Adams and Haynes, 1980, 1996; Newman, 1987; Newman and Wear, 1993).
Producer surplus represents the gross timber profits (quasi-rents) accruing to the forest enter-prise in periodt. Producer surplus can be expressed as the integral of the supply function over price:
PSt=
&
Pt0 Qs(
rIt,ht,v)dr. (2) whererindexes variation of the timber price from zero to the observed market price, Pt. The PSt measure can be viewed as periodt’s return to fixed factors, which are the forest inventory, It, and (implicitly) the land on which the inventory is located.
2.1.2. Multiperiod acti6ity
In forestry, inputs such as regeneration and timber stand improvement can be viewed as invest-ments in future forest stock, which affect future production possibilities. Present management in-puts affect future production possibilities by accu-mulating forest growing-stock inventory. Inventory evolves according to the following relation:
It=It−1+G(It−1,Xt−1,Xt−2,…)-Qt. (3)
Itis year t timber inventory volume,G(·) repre-sents inventory growth as a function of the previ-ous year’s inventory and all previprevi-ous investment inputs (Xt−1,Xt−2,…), andQtis the amount of the inventory that is harvested in yeart.
The optimal level of investment in year t (X*t ) equates the marginal effect of the investment on the present value of all future quasi-rents with the
unit price of the investment, wt.
&
t
(PSm
(Im
(Im(X*t
e−rm
dm=wt (4)
where m indexes time from the current year (t) onward.
2.1.3. Forest asset6alue
Subject to the equation system (1) – (4), a forest enterprise endowed with an initial inventory (I0)
and landowner characteristics (6), facing exoge-nous price schedules over time (P0,P1,…) and (w0, w1,…), unconstrained by factors such as ECF
restrictions, will generate a schedule of outputs (Q0*,Q1*, …,), inventory investment levels (X0*,X1*,
…,), the corresponding inventory path (I1*,I2*,…,),
and a stream of quasi-rents (PS0*,PS1*,…,). The
monetary value associated with this regime (V*) is the present value of the quasi-rents less the costs of the inventory investments
V*=
&
0
[PS*t−wtX*t] e−rtdt (5)
2.2. ECF regime and the compensating price premium
Let X*indicate the time vector of forest
invest-ment inputs defining the forest enterprise’s baseline management regime (i.e., that which they select without the option to adopt ECF practices and obtain certification). We define the forest certifica-tion regime by the vector of ‘‘allowable’’ inputs,
XC, which are exogenously determined by the ECF
standards. We assert that XC5X* (i.e., ECF
(weakly) constrains the application of investment inputs). In this regard, ECF can be viewed as either less or equally input-intensive as the baseline man-agement regime. As described in more detail below, certification constraints prescribe limits to the amount of artificial regeneration of plantations, the amount of inventory that can be managed for timber production, and the application of chemical inputs.
A critical issue is determining the threshold price premium at which the forest enterprise is indifferent between operating under an ECF regime and receiving the premium and operating with the status quo regime and receiving the
6Harvesting costs are traditionally subtracted from
baseline time vector of prices, P. The compensat-ing price premium (CPP) is defined as the value, tCT, that equates asset values for the two regimes:
VC[
P(1+tCT)
XC]=V*(
P). (6)
Combining Eqs. (Eq. (5)) and (Eq. (6)) shows that the CPP is the value of tCT that equates the
present value of quasi-rents under the ECF regime with the present value of quasi-rents under the baseline regime, adjusted for the difference in investment costs between regimes:
&
First, we note that if ECF constraints are not binding, certified values will be the same as base-line values and the CPP threshold will betCT
=0. But if ECF is binding, it shifts inwards the timber supply function and thereby reduces producer sur-plus if the price is unchanged. Under this situa-tion, a positive price markup (i.e., premium) would be necessary to equate producer surplus values across regimes. However, the investment cost term in Eq. (7) will be negative under binding input constraints (XCBX*) and will at least
par-tially offset the positive premium requirement. This raises the question of whether the net CPP could ever be negative (i.e. a landowner would be willing to accept a price reduction to operate under ECF). A negative CPP implies that the investment cost savings from reduced input inten-sity exceeds the corresponding loss in quasi-rents at the baseline price vector. This is tantamount to the notion that the investments foregone by adopting an ECF regime are uneconomic in the first place. While there are, no doubt, forest landowners who make uneconomic investments, we presume that this is an ex post realization rather than an ex ante plan. Thus, the CPP must be nonnegative to be consistent with the baseline rational behavior we assume in our model.7
2.2.1. Finite time horizons, ending in6entories, and
option 6alue
The CPP computation above is based on an infinite horizon forest asset valuation model. However, to simulate an ECF decision, it is best to truncate the time horizon to a finite period. This is both for practical purposes — empirical projection models can only operate under finite horizons — and for conceptual reasons — the ECF decision is not irreversible. Forest-sector models typically address this situation by valuing the inventory at the end of the time horizon, period T. Under the baseline regime, the forest asset value is modified by adding an ending inven-tory value, the second value in the following equation:
Therefore, an adjustment to the CPP calcula-tion is necessary to account for differences in the value of the forest asset at the end ofTyears. The threshold condition then captures differences in quasi-rents, costs, and ending inventories.
&
TThe difference in ending inventories here is valued at the noncertified price, which reflects the notion that ECF is not irreversible. What we are simulating here is a situation in which the landowner essentially commits to ECF forTyears and can then re-evaluate. The value of the forest inventory at the end of T years can be viewed as an option value, without necessarily being re-stricted to ECF management beyond year T. At minimum, the inventory’s option value equals its liquidation value in the traditional noncertified timber market — timber harvests from liquida-tion presumably could not be sold in a certified market. Thus if ECF causes inventories to rise, (IC
T\I*T), for example, because of less-intensive harvesting, this raises the ending inventory option value and thereby diminishes the CPP
require-7Our empirical results below bear this out. In no cases is
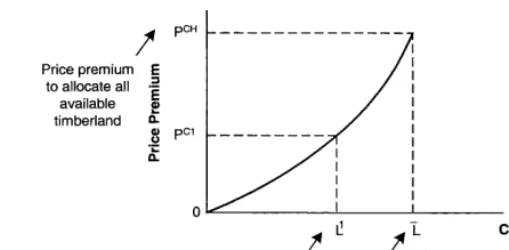
Fig. 1. Eco-certified forestry (ECF) compensation function. ment. In essence, inventory accumulation is a
form of compensation that counters the CPP re-quirements computed thus far. If, however, end-ing inventories are lower in the ECF regime, for instance due to less-intensive silviculture, option values are foregone and additional compensation will be required to pursue the regime.
2.3. ECF compensation function
Imagine an auctioneer offering successive price premia, tC
, for timber suppliers if they sell in the certified market. A supplier will choose to enter the market (adopt ECF and certify) at a price premium that exceeds that supplier’s threshold premium [tC
\tCT]. The CPP measures the
rela-tive strength of the market signal necessary to induce voluntary adoption of the certified regime. Timber markets are typically populated by a het-erogeneous mix of timber suppliers with widely varying forest endowments and differing objec-tives. The result is a forested landscape where a broad range of management intensity is observed. Thus, there is likely to be a spectrum of CPP values distributed across the timber market. There will be low-intensity suppliers for whom the ECF constraints will be minimally binding and may require little, if any, compensation to adopt. And there will be high-intensity suppliers for whom the constraints may be heavily binding and cause greater compensation requirements. The hetero-geneity in CPPs lies at the heart of constructing an upward-sloping compensation function across the entire population of suppliers. The ECF com-pensation function is a locus of CPP requirements
across the universe of potential suppliers. This is illustrated for a hypothetical timber market in Fig. 1. The vertical axis represents the percentage price premium offered in the certified market and the horizontal axis represents the magnitude of timber supply capacity (timberland) for which the corresponding price premium exceeds the com-pensation requirement.
3. ECF policy simulations
The ultimate product of the empirical analysis is an estimated ECF compensation function for the southeastern US region.8Empirical
characteri-zation of these functions provides ex ante evi-dence of the potential size and distribution of market incentives necessary to induce ECF. The conceptual model indicates four main tasks to estimate an ECF compensation function for the region:
establish baseline (non-ECF) vector of prices, outputs, investment input intensity, and inven-tories for representative supply units within the region;
transform ECF standards for the southeast into timber supply, investment, and growth constraints for representative supply units; impose the constraints on the modeling system
and compute CPP values for each supply unit;
8The geographic area covered by the southeastern regional
arrange supply unit land quantities by ascend-ing CPP values to construct an aggregate ECF compensation function.
Our method for performing these tasks is de-scribed below.
3.1. Baseline
We develop our baseline using the Southeastern Regional Timber Supply (SERTS) Model. The SERTS model is a version of the Subregional Timber Supply (SRTS) modeling system (Abt et al., 2000) that applies the general timber supply framework described above to specific harvest and inventory data for the southeastern US. SERTS takes current US Forest Service Forest Inventory and Analysis (FIA) data on forest inventories as the initial forest endowment and projects future timber market outcomes specified in Eqs. (1) – (3) based on an evolving set of market and techno-logical conditions over time.
The timber supply function within SERTS takes a Cobb – Douglass mathematical form:
Qt
s
=aPtoItg. (10)
Consistent with econometric studies of timber markets (Newman, 1987; Adams and Haynes, 1996), the model maintains relatively inelastic re-sponses to changes in timber prices on the supply side (o= +0.30), and inventory elasticity is as-sumed to be unitary (g= +1.0).
The inventory model within SERTS exactly follows Eq. (3) with a biological function for forest growth derived empirically from the FIA data. Growth is estimated separately by 10-year age classes for two ownership classes (forest in-dustry and other private), two timber types (soft-wood and hard(soft-wood), and five forest types (planted pine, natural pine, mixed pine-hardwood, upland hardwood, and bottomland hardwood).
Subregional detail is a feature of the SERTS modeling system that distinguishes it from other timber market/inventory modeling systems, such as the Forest Service’s TAMM/ATLAS model (TAMM: Adams and Haynes, 1980; ATLAS: Mills and Kincaid, 1992). SERTS defines up to 51 geographically defined FIA survey units across 12 southeastern states, dimensioned across two
own-ership classes, leading to 102 separate timber sup-ply/inventory units. These units cut across three major physiographic regions (coastal plain, pied-mont, and mountains), allowing for a fairly fine degree of resolution for analyzing resource and policy issues. In our application, each of the sub-region/owner combinations is a distinct ‘represen-tative owner’ unit.
For the policy simulations, we set the planning horizon to T=30 years, which is roughly the length of one Southern pine rotation. The SERTS model then generates a 30-year (1995 – 2024) base-line projection of prices, harvest output levels, and inventories subject to a given set of exoge-nous market and resource conditions and model parameter values relevant to the southeastern US. The base year of 1995 corresponds to forest con-ditions represented by the most recent Forest Service FIA data for the seven southeastern states considered in this analysis. The SERTS model solves for the annual regional market equilibrium between the supply system described above and regional demand, expressed here as a (Cobb – Douglass) function of price:
Qt
D
=b(t)Ph. (11)
Regional timber demand is specified as rela-tively inelastic (h= −0.50) and is assumed to shift over time [db(t)] in magnitudes consistent with the most recent Forest Service Forest and Rangeland Renewable Resources Planning Act (RPA) national timber assessment (Haynes et al., 1995).
region’s forest land area and forest type alloca-tions are exogenously specified, based on continu-ations of recent trends and projections from the national RPA assessment referenced above. Con-sequently, the size of the southeastern timberland base is held constant throughout the projection period, and timberland is expected to change its allocation among forest types by continuing the historic trend of conversion of ‘natural’ forests (e.g. natural pine, mixed hardwood) to planted pine. Planted pine is projected to grow from just under 20% of the timberland base in 1995 to about 30% in 2024 (USDA Forest Service, 1988; Haynes et al., 1995).
The combination of genetically improved seedlings, fertilization, and control of competing vegetation has been shown to significantly en-hance growth rates of pine plantations on experi-mental plots in the southeast (Yin et al., 1998). In reality, observed plantation growth rates have historically been lower than those on research plots due to a variety of biological and economic factors. Therefore, we modify the growth rates reported by Yin, Pienaar, and Aronov and project a logarithmic increase of pine plantation yields of 40% over the 30-year projection period on forest industry plantation land in the baseline. The base-line growth rate increment was assumed to be less (20% over 30 years) on nonindustrial pine planta-tions because of underlying differences in site quality and capital constraints for that owner group.
Investment cost estimates are based on a survey of southern forest management costs from DuBois et al., (1997) using the following taxon-omy of forest management costs:
general forest (GF) management costs GF=fire protection+timber cruising+timber marking;
pine plantation establishment (PPE) costs PPE=site preparation+planting;
pine plantation post-establishment silvicultural (PPS) costs.
PPS=fertilization+herbicides+prescribed burn-ing+precommercial thinning.
Separate data for the coastal plain and pied-mont regions of the US south were reported for most categories. Pine plantation costs include all
of the above components. We assume that non-plantation costs include only the general forestry component. We estimate average costs per hectare per year using the reported cost per hectare of each practice, relative occurrence of practices across the sampled area, and relative frequency of application for typical forestry operations in the coastal plain and piedmont regions. Taken to-gether, current average management costs are esti-mated at $25.72 ha−1year−1for plantations and
$5.36 ha−1
year−1
for nonplantation manage-ment in the coastal plain. The corresponding pied-mont numbers are $26.84 and $7.89, respectively.
3.2. ECF supply constraints
The forest certification standards are structured in accordance with the FSC’s ten general forest stewardship principles. Many of these principles do not directly alter silvicultural practices (e.g. Community Relations and Workers Rights) and therefore are difficult to model empirically. As a result, we focus this analysis on the features that, in our judgment, are most important and tangible in terms of their effect on timber supply behavior. Our objective is to translate the detailed language of the standards into changes in conditions that can be analyzed with the market model. The supply constraints and their relation to the under-lying FSC forest principles are presented in Table 1.
Table 1
Timber supply costraints Setaside areas 1.
Forest stands over 100 years old in all management types are removed from timber production and reserved in a natural state.
2. No net conversions to plantations
Conversion of other management types to planted pine is not allowed. Pine plantation area remains at base-year levels.
3. Reduced growth on pine plantations
Attainable growth rates on pine plantations are held at current levels due to restrictions on the use of chemical inputs.
Sustainable yield 4.
The first three constraints affect timber supply through their effect on current and future inven-tories. The standards call for the removal of all primary forest areas from timber production (Constraint 1). Primary natural forests are defined as relatively undisturbed native ecosystems com-prising an abundance of mature (old-growth) trees. A threshold age for old growth is not given in the standards. We assigned the 100-year age class designation based on a review of age class and forest type distributions in the FIA data. This constraint leads to the removal of about 4.9% of the region’s hardwood timber inventory volume and 2.7% of the region’s softwood inventory.
The net conversions constraint (2) can be de-scribed as altering the baseline management type allocations (conversion of other types to planted pine) to one in which no net conversion occurs. Conversion to planted pine is occurring through-out the region in response to profit opportunities from plantation forestry. Forest plantations grow faster than natural stands and can be cultivated to produce more commercially valuable products. Thus, restricting plantation conversions imposes opportunity costs in terms of the size and compo-sition of the timber inventory.
The constraint on plantation growth rates (3) derives from restrictions on the use of chemicals to fertilize and control pests and competing vege-tation. The wording in the certification standards is fairly vague regarding the use of chemicals. Chemicals are clearly discouraged; however, there is implicit recognition that some forms of chemi-cal control may be environmentally preferable to their alternatives (SRFCSP, 1999). For instance, although integrated pest management (IPM) is encouraged, insecticide use may be warranted to prevent catastrophic infestations. Herbicides are an alternative to mechanical site preparation, which can considerably disturb the site. Fertiliza-tion is allowed for nutrient-deficient sites. In con-sultation with scientists on the committee that helped develop the standards, we arrived at the following heuristic to describe the chemical use constraint: chemicals can be used to the extent that they maintain current growth rates. There-fore, the effect of imposing this constraint on our model is that inventories continue to grow at the
current growth rates under ECF, instead of the 40 and 20% cumulative increases in growth projected in the baseline. We recognize this is a rather crude implementation of this constraint and therefore include model runs below where no growth rate adjustment is imposed.
From the perspective of softwood (Southern pine) supply, Constraints 1 – 3 all reduce future softwood inventories relative to the baseline and therefore induce inward supply shifts. On the hardwood side, the setaside constraint (1) as ap-plied removes some hardwood inventory — the area set aside come from all forest types, not just planted pine — which shifts the hardwood supply function. But the conversion constraint (2) miti-gates the baseline decline in hardwood inventory by reducing conversions of natural forest types to pine plantations. As an empirical matter, the lat-ter (positive) supply effect for hardwoods, in most cases, will dominate the former (negative) effect, leading to a net outward shift in the hardwood supply function relative to the status quo. Taken together, the welfare gains in the hardwood mar-ket can offset some of the losses in the softwood market. We account for these offsetting effects in the analysis.
The fourth constraint imposes the sustainable yield restriction — timber harvest cannot exceed the forest’s growth. Operationally, this is imposed by restating the supply function as the lesser of the ‘optimal’ harvest level or the level of growth:
Q0 t
s=min[Q
t
s,G(·)] (12)
where Qs
t=Q
S(P
t) is the optimal output deter-mined by the solution of the supply function. In addition to reducing the output level from Qs
t to
G(·), the sustainable yield constraint reduces the supplier’s welfare by the amount of producer surplus lost (see Appendix A).
3.3. CPP estimates
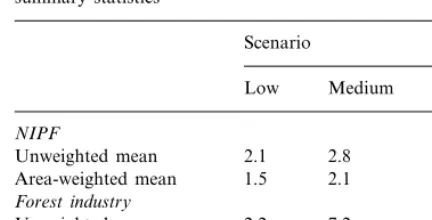
repre-Table 2
Compensating price premium estimates (%) by ownership: summary statisticsa
Scenario
Low Medium High NIPF
2.8 6.4
Unweighted mean 2.1
2.1
1.5 5.5
Area-weighted mean Forest industry
2.2 7.2
Unweighted mean 12.8
14.1 8.0
Area-weighted mean 2.4
aAll values pooled across softwood and hardwood timber
types. Discount rate is 6%.
the model. The mathematical derivation of the CPP scalar values is presented in Appendix A. Summary statistics by ownership group are pre-sented in Table 2. All CPP values are expressed as a percentage of baseline price (tCT
/P).
On average, the CPP requirements might be described as relatively modest, but there are sub-stantial differences by scenario and owner group. Taken together, the simulation results indicate that the certification restrictions imposed in the simulations fall most heavily on pine plantation forestry, which is practiced on a much wider scale by industry than by NIPFs. Average CPP require-ments are small for both ownership classes in the low scenario (2% range), reflecting the fact that relatively little of the region’s initial inventory is reserved because of the 100+ year setaside straint and that, by itself, the restriction on con-versions to plantation is relatively limited. However, when we impose growth rate restric-tions on plantarestric-tions in the medium scenario, this has a substantial effect on CPP requirements for industry suppliers, nearly quadrupling their mean CPP values to 8%. In essence, the growth restric-tion makes less productive their cumulative in-vestments in plantations over time. The sustained yield constraint added in the high scenario has dramatic effects on both industry and NIPF CPP sentative supply unit. Each supply unit is defined
by a unique mix of land area, forest types, inven-tory volume, species, and age classes. Applying the constraints at this level of resolution allows us to capture differential impacts across these vari-ous dimensions of timber supply.
The region subject to the standards is divided into 25 geographic subregions. These subregions cover seven states in the southeastern US and are confined to the coastal plain and piedmont re-gions of those states.9 Each subregion can be
further divided into two ownership classes, nonin-dustrial private forest (NIPF) and forest industry, leading to a total of 50 modeled supply units. We evaluated three scenarios, which varied by degree of stringency:10
low: constraints 1 and 2 only;
medium: constraints 1, 2, and 3;
high: all four constraints.
The simulations were run to generate CPP esti-mates for each of the 50 supply units addressed in
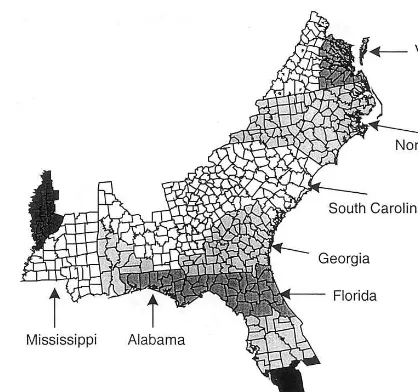
Fig. 2. Geographic distribution of compensating price premia (moderate scenario) — forest industry.
9The full SERTS model covers up to 12 states and three
physiographic regions across the southern US. The five states in the south-central part of the region are covered under separate certification standards as are the mountain areas for the seven states that are included. Results for those areas are not reported here.
10Another reason Constraints 3 and 4 are added
Fig. 3. Geographic distribution of compensating price premia (moderate scenario) — nonindustrial private.
while over 80% of industry area has CPP values greater than 5%.
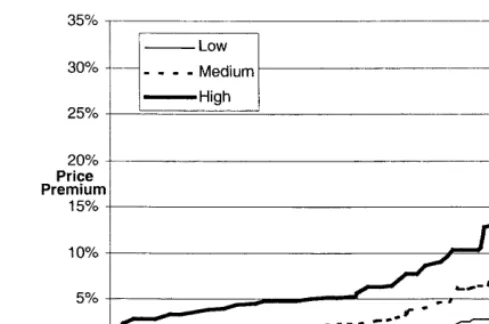
3.4. ECF compensation functions
We use the CPP estimates to generate the ECF compensation functions in Fig. 4. Separate func-tions are presented for each scenario. In all cases, the function starts out with relatively flat sections, representing the low CPP requirements across most of the region’s land base. This primarily reflects the relatively low CPP estimates for NIPFs, who dominate the region’s forest land-scape in area owned. However, the compensation function turns upward as we move to the last quarter of land area. This shift upward captures the influx of industry suppliers needing higher compensation levels to offset the restrictions on their otherwise intensive forestry practices. Taken together, the functions in Fig. 4 suggest that a fairly sizable portion of the private land base in the southeast might be amenable to ECF at rela-tively low price premia based strictly on the op-portunity cost of adjusting their current forest management regimes.
4. Conclusions, policy implications, and extensions
Our simulation results suggest that ECF could apparently be practiced with relatively small com-pensation requirements on a substantial portion of timberland in the southeastern US. In particu-lar, compensation requirements are lower in the piedmont region and for hardwood forests than they are in the coastal plain and for softwood forests, respectively. These low-compensation forests are concentrated in the hands of NIPF owners, who tend to manage their forests less intensively and have a wider range of species diversity within their forests than their industry counterparts. However, lower compensation to comply with ECF also means less incentive to change current management practices (i.e., small market premia would likely yield only minor changes in behavior). So while the existence of many low-cost adopters may be good for the potential adoption rate of ECF, it might not have values. For industry, the sustained yield
con-straint has a synergistic effect with the other constraints. As restrictions are placed on silvicul-tural inputs that can enhance the growth and yield of the forests, forcing removals (harvests) to fall at or below growth further limits output and raises opportunity costs. For many NIPFs, low-intensity management produces low forest growth rates, making the sustained yield constraint more binding, all else equal.
The geographic distribution of CPP estimates is mapped for the forest industry in Fig. 2. The impacts tend to be somewhat higher toward the Atlantic coast where plantation forestry is more prevalent. The Georgia coastal plain supply units have relatively high CPP requirements. By com-parison, the NIPF impacts (Fig. 3) are substan-tially lower, and the geographic distribution more heavily skewed to the coastal plain if the sustain-able yield constraint is relaxed.
Fig. 4. Estimated compensating price premium functions. much of an effect on the way land is managed.
Higher compensation will be necessary to divert the intensively managed (i.e., higher environmen-tal impact) forests to ECF.
The rewards for less-intensive forestry raise an-other point about potential consequences of wide-spread ECF adoption. Less-intensive management of forestland generally requires more extensive use of forestland to produce a given amount of com-mercial output. Therefore, unless the demand for timber were to decline — in contrast to recent projections (Haynes et al., 1995) — less-intensive forestry could cause forest disturbances to be spread over a wider area (Vincent and Binkley, 1993). This shift can occur both by spreading activity more extensively within the region and/or transferring activity to other US regions or for-eign sources. The net environmental quality impli-cations of such changes are ambiguous, a priori.
Before accepting our empirical results as a pre-diction that certified ECF will in fact be widely adopted with a moderate price premium, we must acknowledge that important hurdles to adoption may exist that are difficult to quantify and thus have remained outside of our analysis. For exam-ple, we have not directly accounted for the initial cost and logistical hurdles of developing a man-agement plan and obtaining certification. Prelimi-nary empirical evidence suggests that per-hectare costs of obtaining certification are quite small for large ownerships (e.g. less than a dollar per ha),
but may be large for smaller ownerships not enjoying economies of scale (Murray and Casey, 1998). Because much of the southeastern US’s NIPF timberland is held in small units of, for example, less than 40 ha (Moulton and Birch, 1995), the scale economy issue is not inconsequen-tial. Recognizing this, the FSC is considering modifying the certification process to allow small landowners to participate by engaging the services of an FSC-certified forest consultant, rather than developing a full-blown certification of the small forest property. This would allow the small landowner client to avoid the large up-front fixed costs that may serve as an impediment to adop-tion. To the extent that small landowners can realize this advantage, the initial cost factor may not be too problematic.
be-havior should serve to temper expectations about the scope for seemingly rational adoption of cer-tified forestry practices subject to the relatively moderate price premia estimated here.
Finally, in this paper we have not examined the demand side of certified markets, most particularly the market’s WTP for certified timber. In that regard, the evidence is mixed. Some survey studies have shown potentially large WTP premia (12 – 20%) for at least some final consumers of wood products (e.g. Winterhalter and Cassens, 1993; Ozanne and Vlosky, 1997). However, these con-sumers tend to be concentrated in relatively small market niches, and these premia have not yet been widely realized in the timber market (Stevens et al., 1997). The willingness of final consumers to pay a premium may not necessarily transfer directly to timber (stumpage) price premia if there are signifi-cant intermediate cost differences between the forest and the consumer. If intermediate costs are higher for certified products, the derived WTP for certified timber falls, all else equal. The intermedi-ate cost factor receiving the most attention in certification studies has been the ‘chain-of-custody’ costs associated with verifying throughout the distribution chain that the wood source is from a certified forest. One study has suggested that chain-of-custody costs are likely modest (Simula, 1996). However, if these costs are not low, they could present a significant impediment to certifica-tion, particularly for small, undercapitalized oper-ators.11Also of potential importance for operators
of all sizes are differences in logging and trans-portation costs, particularly if the practice of clear-cutting is substantially curtailed.12
In summary, it takes two sides to make a market work. Our analysis suggests a wide range of oppor-tunities may exist for relatively low-cost adoption of ECF practices in the southeastern US. However, adoption of these practices will only be realized if a large body of eco-consumers exists whose WTP for ECF-labeled products is not offset by higher costs for the certified products.
Acknowledgements
The authors gratefully acknowledge the support of the US Environmental Protection Agency (EPA) under cooperative agreement CR824966-01, with particular thanks to project officer, Joe Fer-rante. We appreciate comments on earlier drafts provided by Roger Sedjo, Steven Swallow, Doug Carter and seminar participants at Duke, North Carolina State, and University of Florida. We are also grateful to Sharon Barrell, Andrew Jessup, and Judy Cannada of RTI for their assistance in preparing this document, and to Karen Lee Abt of the US Forest Service for her assistance in spatial mapping of impacts. The views expressed in this paper are those of the authors alone.
Appendix A. Computing the CPP scalar with time-variant shifts
This appendix presents the mathematical deriva-tion of annual compensating price premium values (tt
CT), first under the simpler case of a nonbinding
sustained yield constraint, then under a binding sustained yield constraint. Then, the procedure for reducing time-variant values to a single scalar for theT-year regime is presented.
A.1. CPP when the sustained yield constraint is nonbinding
From (Eq. (2)) and (Eq. (10)), the specific equa-tion for producer surplus in yeartis
PSt=aItg(Pot+1)/(o+1). (A1)
11As pointed out by one reviewer, chain-of-custody issues
may be more problematic for certification in developing coun-try settings, where property rights may not be as well defined as they are in the southeastern US.
12Toward the end of the standards development process for
In our empirical analysis, the inventory elastic-ity is set to g=1, so that term is dropped from the remaining equations. For each, except the final year (T), the premium value tt
CT equates
producer surplus under ECF with baseline pro-ducer surplus plus the difference in investment costs:
With algebraic manipulation, the solution is
tt
In the final year, the change in ending inventory term PT(I
C
T−I*T) is added to the right-hand side of (Eq. (A2)) and to the second square-bracketed term on the right-hand side of (Eq. (A3b)).
A.2. CPP when the sustained yield constraint is binding
Let QXt define the constrained harvest level (=growth) in year t (see (Eq. (12)) in the main text). Compute total variable costs as the inverse of the supply function up to the pointQXt:
TVC(QXt)=
&
Set the ‘target’ producer surplus equal to base-line producer, adjusted for investment cost differences:
We can then solve for the year t CPP value as follows:
A.3. Estimating scalar CPP6alue for the regime
In general, the value of tt
CT will vary across
time periods. To reduce this value to a scalar value capturing CPP effects for the entire regime, we weight each period’s tt
CT value by a share
equal to that period’s contribution to the total baseline forest asset value, as defined in (Eq. (8)). For years 0 toT−1, the weights are computed as follows:
Wt=[PS*t−wtX*t]e−rt/V*. (A7)
In year T, the ending inventory term is added to the bracketed term in (Eq. (A7)).
The scalar,tCT, is then the present value
share-weighted sum of the ttCT values:
tCT=
Abt, R.C., Cubbage, F.W., Pacheco, G., 2000. Southern forest resource assessment using the sub-regional timber supply (SRTS) model. Forest Products J. 50 (4), 25 – 33. Adams, D.M., Haynes, R.W., 1980. The 1980 timber
assess-ment market model: structure, projections, and policy sim-ulations. Forest Sci. 26 (3), 22.
Adams, D.M., Haynes, R.W., 1996. The 1993 Timber Assess-ment Market Model: Structure, Projections, and Policy Simulations. PNW-GTR-368. US Department of Agricul-ture, Forest Service, Portland, OR.
Adams, D.M., Alig, R.J., McCarl, B., Callaway, J., Winnett, S., 1996. An analysis of the impacts of public timber harvest policies on private forest management in the US. Forest Sci. 42 (3), 343 – 358.
Baharuddin, H.G., 1995. Timber certification: an overview. Unasylva 46, 18 – 24.
DuBois, M.R., McNabb, K., Straka, T.J., 1997. Cost and cost trends for forestry practices in the south. Forest Landowner Manual March/April, 7 – 13.
Elliott, C., Donovan, R.Z., 1996. Introduction. In: Viana, V.M., Ervin, J., Donovan, R.Z., Elliott, C., Gholz, H. (Eds.), Certification of Forest Products: Issues and Per-spectives. Island Press, Washington.
Haynes, R.W., Adams, D.M., Mills, J.R., 1995. The 1993 Timber Assessment Update. GTR RM-259. US Depart-ment of Agriculture, Forest Service, Ft Collins, CO. Kiker, C.F., Putz, F.E., 1997. Ecological certification of forest
products: economic challenges. Eco. Econ. 20, 37 – 51. Kluender, R.A., Stokes, B.J., 1996. Felling and skidding
Certification — Environmental Implications for Forestry Operations. Proceedings of the Joint Conference Canadian Woodlands Forum: Canadian Pulp and Paper Association and International Union of Forest Research Organiza-tions, September, at Quebec City.
Kulivanen, J., 1990. Virtual price approach to short-term timber supply under credit rationing. J. Env. Econ. Man. 19, 109 – 126.
Mills, J.R., Kincaid, J.C., 1992. The Aggregate Timberland Assessment System — ATLAS: A Comprehensive Timber Projection Model. PNW-GTR-281. US Department of Agriculture, Forest Service, Portland, OR.
Moulton, R.J., Birch, T.W., 1995. Southern private forest landowners: a profile. Forest Farmer 54 (5), 44 – 46. Murray, B.C., Casey, J.F., 1998. Sustainable forest
manage-ment certification: an economic framework for policy anal-ysis. Working paper prepared for the US Environmental Protection Agency under Contract No. CR 824966-01-0. Research Triangle Institute, Research Triangle Park, NC. Newman, D.H., 1987. An economic analysis of the southern
softwood stumpage market: 1950 – 1980. Forest Sci. 33, 932 – 945.
Newman, D.H., Wear, D.N., 1993. Production economics of private forestry: a comparison of industrial and nonindus-trial forest owners. Am. J. Agri. Econ. 75 (3), 674 – 684. Ozanne, L.K., Vlosky, R.P., 1997. Willingness to pay for
environmentally certified wood products: the consumer perspective. Forest Products J. 47 (6), 39 – 48.
Parks, P.J., 1995. Explaining ‘irrational’ land use: risk aversion and marginal agricultural land. J. Env. Econ. Man. 28 (1), 34 – 47.
Simula, M., 1996. Economics of certification. In: Viana, V.M., Ervin, J., Donovan, R.Z., Elliott, C., Gholz, H. (Eds.), Certification of Forest Products: Issues and Perspectives. Island Press, Washington.
Sohngen, B., Mendelsohn, R., 1998. Valuing the impact of large-scale ecological change in a market: the effect of
climate change on US timber. Am. Econ. Rev. 88 (4), 686 – 710.
SRFCSP, 1999. Southeastern Regional Forest Certification Standards Project. Forest certification standards for the southeastern US Developed by the Working Group for the Southeastern United States Region of the Forest Steward-ship Council US Initiative.
Stevens, J., Ahmad, M., Ruddell, S., 1997. Forest products certification: a survey of producers and manufacturers. Forest Products J. 48 (6), 43 – 49.
Swallow, S.K., Sedjo, R.A., 2000. Eco-labeling consequences in general equilibrium: A graphical assessment. Land Econ. 76 (1), 28 – 36.
USDA, Forest Service, 1988. The South’s Fourth Forest: Alternatives for the Future. Forest Resource Report No. 24. Washington, DC.
USDA, Forest Service, December 1990. An Analysis of the Timber Situation in the United States: 1989-2040: A Tech-nical Document Supporting the 1989 USDA Forest Service RPA Assessment. GTR RM-199. US Department of Agri-culture, Forest Service, Ft Collins, CO.
Vincent, J.R., Binkley, C.S., 1993. Efficient multiple-use forestry may require land-use specialization. Land Econ. 69 (4), 370 – 376.
Vlosky, R.P., Ozanne, L.K., 1997. Forest products certifica-tion: the business customer perspective. Wood Fiber Sci. 29 (2), 195 – 208.
Wear, D.N., Parks, P.J., 1994. The economics of timber supply: an analytical synthesis of modeling approaches. Natural Res. Model. 8 (3), 199 – 223.
Winterhalter, D.M., Cassens, D., 1993. Consumer perceptions of forest sustainability and willingness to pay: Results of a national survey. Purdue University, West Lafayette, IN. Yin, R., Pienaar, L.V., Aronov, M., 1998. The productivity
and profitability of fiber farming. J. Forestry 96 (11), 13 – 18.