CURRICULUM
EVIDENCE-BASED MEDICAL PRACTICE
Aims:
1. To develop basic information skills and their integration with the evidence-based practice in the primary care setting
2. To develop skills to obtain, appraise and use valid and reliable new information using on-line resources
3. To develop skills to convey electronic and oral communication
Learning Outcomes:
1. Possess skills to gain access to on-line resources
2. Able to critically appraise medical literatures
3. Able to keep patient’s medical records and comprehend ethical and legal imperatives
4. Able to communicate with colleagues and co-workers using oral, written, and electronic means
Curriculum Contents: 1. Internet searching
2. Association and causation
3. Principles and applications of statistical analysis
4. Effect size, hypothesis testing and confidence interval
5. Principle of critical appraisal (diagnostic test, clinical trial, prognosis study)
6. Record keeping and Clinical Practice
PLANNERS TEAM
No Name Department Phone
1 Prof. Dr. dr. I Gde Raka Widiana, SpPD-KGH (Coordinator)
Internal Medicine 0816297956
2 Ida Bagus Nyoman Putra Dwija, S.Si.,M.Biotech
Microbiology 08179747502
3 Dr. dr. I P. G. Adiatmika, Mkes Physiology 08123811019
4 dr. Lanang Sidiartha, SpA Pediatrics 08123966008
5 dr. I.B. Subanada, SpA Pediatrics 08123995933
LECTURERS
No Name Department Phone
Prof. Dr. dr. I Gde Raka Widiana, SpPD-KGH
Internal Medicine 0816297956
dr. Dewi Sutriani Mahalini, SpA Pediatrics 08123641466
dr. Eka Gunawijaya, Sp A Pediatrics 081338599801
dr. Lanang Sidiartha, SpA Pediatrics 08123966008
dr. I.B. Subanada, SpA Pediatrics 08123995933
Dr. dr. I P. G. Adiatmika, Mkes Physiology 08123811019
dr. I Wyn. Sudhana, SpPD-KGH Internal Medicine 08123914095
Dr.dr. Ketut Suega,Sp.PD-KHOM Internal Medicine 081338728421
FACILITATORS
Regular Class (Class A)
(3rd floor)
1 dr. I Putu Adiartha Griadhi,M.Fis 1 Physiology 081999636899 3R.3.09nd floor:
2 dr. I Gusti Ayu Eka Pratiwi,M.Kes.,Sp.A 2 Pediatric 08123920750 3R.3.10nd floor:
3 dr. Gede Kambayana,Sp.PD-KR 3 Interna 08124683416 3nd floor:R.3.11
4 dr. Ni Nyoman Margiani, Sp.Rad 4 Radiology 081337401240 3nd floor:R.3.12
5 dr.Ni Putu Sri Widnyani,Sp.PA 5 PathologyAnatomy 081337115012 3nd floor:R.3.13
6 dr. A.A.Bagus Ngurah Nuartha, SpS.
(K) 6 Neurology 08123687288 3nd floor:R.3.14
7 dr. Anak Agung Wiradewi
Lestari,Sp.PK 7
Clinical
Pathology 08155237937
3nd floor: R.3.15
8 dr. Nyoman Paramita Ayu, Sp.PD 8 Interna 08123837372 3nd floor:R.3.16
9 dr. Nyoman
Suryawati,M.Kes.,Sp.KK 9 Dermatology 0817447279
3nd floor:
R.3.17
10 dr. Kunthi Yulianti, SpKF 10 Forensic 081338472005 3R.3.19nd floor:
English Class (Class B)
No Name Group Departement Phone Veue
Pathology R.3.09
2 Dr.dr.Bagus Komang Satriyasa,M.Repro 2 Pharmacology 087777790064 3R.3.10nd floor:
3 dr. Pontisomaya Parami,Sp.An 3 Anesthesiology 08123661312 3nd floor:R.3.11
4 dr. Pratihiwi Primadarsini,M.Biomed,Sp.PD 4 Interna 081805530196 3nd floor:R.3.12
5 dr. Putri Ariani Sp.KJ 5 Psychiatry 082237817384 3nd floor:R.3.13
6 IBN. Putra Dwija,S.Si.,M.Biotech 6 Microbiology 08179747502 3nd floor:R.3.14
7 dr. I Made Agus Kresna
Sucandra,Sp.An 7 Anesthesiology 08123621422 3nd floor:R.3.15
8 dr. Putu Budiastra,Sp.M (K) 8 Ophthalmology 085238238999 3nd floor:R.3.16
9 dr. Putu
Patriawan,M.Sc.,Sp.Rad 9 Radiology 08123956636 3
nd floor:
R.3.17
10 Desak Gde Diah Dharma
Santhi, S.Si, Apt, M.Kes 10
Clinical
Pathology 0817569021
3nd floor:
R.3.19
TIME TABLE
REGULAR CLASS
Day/Date Time Activity Venue
Person-in-charge 1
Tuesday
09.00 – 10.00 Introduction Class Room
May,19
2015
10.00 - 12.30 Scenarios : Problems identifications with clinical questions
Class Room
dr. Dewi
12.30 – 13.00 Break
13.00 – 16.00 Practical Work 1.
Record Keeping Computer room Dr. Adiatmika Computer room 2 Wednesday May,20 2015
09.00 – 10.00 Lecture 1. Principal of critical
appraisal RoomClass dr.Eka
10.00 – 11.00 Lecture 2. Association and Causation
Class Room
dr. Subanada
11.00 – 12.00 Individual Learning
12.00 – 13.00 Student Project 1 Class Room
dr. Lanang
13.00 – 13.30 Break
13.30 – 15.00 SGD Discussion
Room
Facilitator
15.00 – 16.00 Plenary Session Class Room dr. Eka, dr.Subanada 3 Thursday May, 21.2015
09.00 – 16.00 Practical Work 2.
Searching articles (address will be given)
Computer
room AdiatmikaDr.
4
Friday
May,22.
2015
09.00 – 10.00 Lecture 3: Effect size, Hypothesis Testing and Confidence Interval
Class Room
dr. Subanada
10.00 – 11.00 Individual Learning
11.00 – 12.00 Lecture 4. Principles and Application of Statistical Analysis
Class
Room dr. Lanang
12.00 – 13.00 Student Project 2
13.00 – 13.30 Break
13.30 – 15.00 SGD Discussion
Room
Fasilitator
15.00 – 16.00 Plenary Lecture 3,4 Class Room
5
Monday
May,25
2015
09.00 – 10.00 Lecture 5: Methodological and Statistical Principles and Application in Descriptive Studies
Class Room
dr. Eka
10.00 – 11.30 Student Project 3
11.30 – 12.00 Break
12.00 – 13.30 Individual Learning
13.30 - 15.00 SGD Discussion
Room
Facilitators
15.00 – 16.00 Plenary Lecture Class Room dr.Eka 6 Tuesday May,26 2015
09.00 -10.00 Lecture 6. Methodological and Statistical Principles and Application in Analytical Studies
Class Room
dr. Lanang
10.00 -11.30 Student Project 4
11.30 -12.00 Break
12.00 – 13.30 Individual Learning
13.30 – 15.00 SGD Discussion
Room
Facilitators
15.00 – 16.00 Plenary session Class
Room dr. Lanang
7 Wednesday
May,27.
2015
09.00 – 10.00 Lecture 7. Diagnostic Test Dr. Sudhana
10.00 – 11.30 Student Project 5
11.30 -12.00 Break
12.00 – 13.30 Individual Learning
13.30 - 15.00 SGD Discussion
Room
Facilitators
15.00 – 16.00 Plenary session Class Room
Dr. Sudhana
8 Thursday
May,28
09.00 – 10.00 Lecture 8. Clinical Trial Class
Room Prof Raka
10.00 – 11.30 Student Project 6
11.30 – 12.00 Break
2015 13.30 – 15.00 SGD Discussion Room
Facilitator
15.00 – 16.00 Plenary session Class Room Prof Raka 9 Friday May,29 2015
09.00 – 10.00 Lecture : 9. Study about Prognosis
Class Room
dr. Eka
10.00 – 11.30 Student Project 7
11.30 – 12.00 Break
12.00 – 13.30 Individual Learning
13.30 – 15.00 SGD Discussion
room
Facilitators
15.00 – 16.00 Plenary session Class Room dr. Eka 10 Monday June,1. 2015
09.00 – 10.00 Lecture: 10. How to Write a Paper and Present at a Meeting
Class
Room
Dr. Suega
10.00 – 11.30 Student Project 8
11.30 – 12.00 Break
12.00 – 13.30 Individual Learning
13.30 – 15.00 SGD Discussion
room
Facilitator
15.00 – 16.00 Plenary session Class Room Dr. Suega 11. Wednesday June,3 2015 Examination
English Class
Day/Date Time Activity Venue
Person-in-charge
1 Tuesday,
08.00 – 09.00 Introduction Class Room
Prof. Raka
09.00 – 12.00
Practical Work 1.
Record Keeping
Computer room
May 19,
2015
Computer room
12.00 – 12.30 Break
12.30 - 15.00 Scenarios : Problems identifications with clinical questions Class Room dr. Dewi 2 Wednesday, May 20, 2015
08.00 – 15.00 Practical Work 2.
Searching articles (address will be given)
Computer room Dr. Adiatmika 3 Thursday May 21, 2015
08.00 – 09.00 Lecture 1. Principal of critical
appraisal RoomClass dr.Eka
09.00 – 10.00 Lecture 2. Association and Causation
Class Room
dr. Subanada
10.00 – 11.00 Individual Learning
11.00 – 12.30 SGD Discussion
Room
Facilitator
12.30 – 13.00 Break
13.00 – 14.00 Student Project 1 Class Room
dr. Lanang
14.00 – 15.00 Plenary Session Class Room dr. Eka, dr.Subanada 4 Friday May 22, 2015
08.00 – 09.00 Lecture 3: Effect size, Hypothesis Testing and Confidence Interval
Class Room
dr. Subanada
09.00 – 10.00 Individual Learning
10.00 – 11.00 Lecture 4. Principles and Application of Statistical Analysis
Class Room
dr. Lanang
11.00 – 12.30 SGD Discussion
Room
Facillitator
12.30 – 13.00 Break
13.00 – 14.00 Student Project 2
14.00 – 15.00 Plenary Lecture 3,4 Class Room
5 Monday
May 25
2015
08.00 – 09.00 Lecture 5: Methodological and Statistical Principles and Application in Descriptive Studies
Class Room
dr. Eka
09.00 – 10.30 Individual Learning
10.30 – 12.00 SGD Discussion
Room
Facilitators
12.00 – 12.30 Break
12.30 – 14.00 Student Project 3
14.00 – 15.00 Plenary Lecture Class Room dr.Eka 6 Tuesday May 26 2015
08.00 – 09.00 Lecture 6. Methodological and Statistical Principles and Application in Analytical Studies
Class Room
dr. Lanang
09.00 – 10.30 Individual Learning
10.30 – 12.00 SGD Discussion
Room
Facilitators
12.00 – 12.30 Break
12.30 – 14.00 Student Project 4
14.00 – 15.00 Plenary session Class
Room dr. Lanang
7 Wednesday
May,27
2015
08.00 – 09.00 Lecture 7. Diagnostic Test Dr. Sudhana
09.00 – 10.30 Individual Learning
10.30 – 12.00 SGD Discussion
Room
Facilitators
12.00 – 12.30 Break
12.30 – 14.00 Student Project 5
14.00 – 15.00 Plenary session Class Room Dr. Sudhana 8 Thursday May 28 2015
08.00 – 09.00 Lecture 8. Clinical Trial Class
Room Prof Raka
09.00 – 10.30 Individual Learning
10.30 – 12.00 SGD Discussion
Room
Facilitator
12.30 – 14.00 Student Project 6
14.00 – 15.00 Plenary session Class Room
Prof Raka
9 Friday
May 29
2015
08.00 – 09.00 Lecture : 9. Study about Prognosis
Class Room
dr. Eka
09.00 – 10.30 Individual Learning
10.30 – 12.00 SGD Discussion
room
Facilitators
12.00 – 12.30 Break
12.30 – 14.00 Student Project 7
14.00 – 15.00 Plenary session Class Room
dr. Eka
10 Monday
June 1
2015
08.00 – 09.00 Lecture: 10. How to Write a Paper and Present at a Meeting
Class
Room
Dr. Suega
09.00 – 10.30 Individual Learning
10.30 – 12.00 SGD
12.00 – 12.30 Break
12.30 – 14.00 Student Project 8 Discussion room
Facilitator
14.00 – 15.00 Plenary session Class Room
Dr. Suega
11.
Wednesday
June 3
2015
EXAMINATION
Note :
1.
Lecture : Class Room 3.01, 3rd floor2.
Small Group Discussion : Discussion Room 3rd floor,west wing (Room 3.01-3.08) and Room 3.21-3.24 beside the IT Room at 3rd Floor4.
For activity of practical work record keeping and searching articles students have to bring their own laptop, because the number of the personal computers in the computer room is not enough.MEETING
Meeting of Student Representatives
Meeting of the planners team with the student representatives (Regular and English class) will be held on Monday,May 25.2015, from 10.00 - 11.00 in the class room. It is hoped that the planners’ team will get some inputs and suggestions from the student representatives to improve the next implementation of the program. For the meeting each discussion group must choose one of his members as their representative.
Meeting of Facilitators
All facilitators will be invited to discuss all the block activities with the planners team on Monday, May.25.2015 from 11.00 – 12.00 in the class room.
ASSESSMENT METHOD
The student final assessment (CBT) will be held on Wednesday, June,3.2015. The time of examination will be informed letter. The minimal passing level is 70.
LEARNING PROGRAMS
CURRICULUM
Raka Widiana Aims:
1. To develop basic information skills and their integration with the evidence-based practice in the primary care setting
2. To develop skills to obtain, appraise and use valid and reliable new information using on-line resources
3. To develop skills to convey electronic and oral communication
Learning Outcomes:
1. Possess skills to gain access to on-line resources
2. Able to critically appraise medical literatures
3. Able to keep patient’s medical records and comprehend ethical and legal imperatives
4. Able to communicate with colleagues and co-workers using oral, written, and electronic means
Curriculum Contents: 1. Internet searching
2. Association and causation
3. Principles and applications of statistical analysis
4. Effect size, hypothesis testing and confidence interval
5. Principle of critical appraisal (diagnostic test, clinical trial, prognosis study)
6. Record keeping and Clinical Practice
7. Presentation at the meeting.
ABSTRACTS (I Gde Raka Widiana)
Since the early 1980s, medicine has been undergoing a continuing revolution. It has led to e fertile development of EBM (evidence based medicine). The practice of EBM (evidence based medical practice) may be perceived as a meta-field because it involves concepts and tools from many disciplines, including statistics and bio-statistics, research design, computer programming, database management, and mathematical modeling. EBMP applies medical informatics which is used for the purposes of generating, organizing, and making accessible
INTRODUCTION TO THE BLOCK:
and intelligible huge amounts of information. Learning the skills to manage information is of paramount importance to modern physicians. The computer is an important tool to facilitate this process. Those who learn the skills of using computers to manage information will have a greater advantage over those who do not. In daily practice, EBMP is important to the medical students because can help them to deal with problems which include how to find, appraise, procure, apply and store the best evidence to diagnose, treat, and determine the prognosis of patients. Skills in this area may help them to pursue life long, students centered and problem based education. The teaching of EBMP consists of lecture, searching articles, critical appraisal and application to problems that may be introduced in clinical scenarios
SELF DIRECTING LEARNING
Basic knowledge that must be known:
1. Search related articles to the patients problems (diagnose, treat, and prognosis) in the internet,
2. Critically appraise the related articles and procure from the internet 3. Apply the articles to patents problems
4. Store the best evidence to of patients in your personal electronic library.
SCENARIO
A 25 year old woman was consulted to a nephrologist with lupus GN. The patient had been treated with methyl prednisolon for 3 months failed to get remission.The patient has not married hope to get pregnant in the future (contraindicated for CYP).The doctor knew MMF, a promising drug for LGN available in the market. However the doctor was not sure the drug is save and effective he would like to find out best evidence in the internet, but he was not so familiar with EBM and searching in the internet. Please, help the doctor to find the best evidence to answer his problem
Learning Task:
1. Comprehend above scenario
2. Make clinical (foreground question) using acronym PICO
3. Search articles about therapy (randomized clinical trial) in internet (using Highwire or other addresses)
4. Procure 3 related articles
5. Appraise and select one best article
6. Apply whenever you find valid and important best evident article
How to make clinical (foreground question) using acronym PICO using above clinical scenario
How to search articles about therapy (randomized clinical trial) in internet (using Highwire or other address)
How to procure related articles
How to appraise and select the best article
How to apply the valid and important best evident article to your patient’s problems
LEARNING OBJECTIVE
Comprehend and skillful making clinical (foreground question) using acronym PICO, searching articles in internet, procure related articles, appraise, select the best article and apply the valid and important best evident article to patient’s problems
Dewi Sutriani Mahalini
Evidence based medical practice (EBMP) is the use of the best scientific evidence to support the clinical decision making. The identification of the best evidence requires the construction of an appropriate research question and review of the literature. Many questions about patient care arise at the patient bedside. You cannot simply enter your question directly into a database and expect to get an answer. There are 4 steps in EBMP: 1. Formulate an answerable question; 2. Track down the best evidence outcome available; 3. Critically appraise the evidence; 4. Apply the evidence. The first step of EBMP is to convert an information need into a focused question. This part of the EBMP process is often overlooked but is essential if a search is to be conducted efficiently. Questions often spring to mind in a form that makes finding answers in the medical literature a challenge. Dissecting the question into its component parts and restructuring it so that it is easy to find the answers is an essential first step in EBMP. EBMP process starts with a clinical scenario that needs the best answer. One way of defining a focused question is to use the PICO or PECO framework. "PICO" is the acronym for this 4 part question which consists of the first letters of P atients, I ntervention / E xposure , C omparison , O utcome. PICO doesn't necessarily work perfectly for all kinds of questions, the main thing is the break down your question into separate concepts, regardless of the headings you put them under. You can usually identify
three of the four PICO elements. By far the most common type of clinical question is about how to treat a disease or condition. In EBMP, treatments and therapies are called ‘interventions’ and such questions are questions of INTERVENTION. However, not all research questions are about interventions. Other types of questions that may arise are: ETIOLOGY and RISK FACTOR, FREQUENCY, DIAGNOSIS, PROGNOSIS and PREDICTION. In each case the PICO method can be used to formulate the question.
SCENARIO Scenario 1:
A medical student, 19 years old, female came to a doctor with chief complaint of mass in her left breast with 2 cm in diameter. Based on physical examination, the doctor didn’t sure if the mass was a malignancy or not. The doctor told her to do mammography but she was worried that mammography will expose her to x ray. She asked for ultrasonography. She thought that ultrasonography was safer compared to mammography. The problem was the doctor didn’t know if ultrasonography can accurately diagnosed breast cancer compared to mammography.
Can you find the answer for scenario above by search for the best evidence from the internet?
Scenario 2:
A 40 years old male came to a doctor. He had diabetes mellitus since 5 years ago but he didn’t attend medical visit regularly. This morning, the patient came to laboratory; he wanted to check for microalbuminuria, based on his friend’s advice. His friend also had diabetes mellitus. Apparently, he was positive for microalbuminuria. He was told by a nephrologists that irbesartan can prevent renal failure in diabetes mellitus patients with microalbuminuria. He asked this doctor whether it was true or not, and if it was true what was the estimation for the preventive effect. The doctor didn’t have data to answer that question. Could you help this doctor to search for best evidence from the internet?
Scenario 3:
an evidence for that statement. The staff didn’t have the answer for the doctor question. Could you help the marketing staff to search for the evidence from the internet?
Scenario 4:
A 40 years old man who work as a teacher in department of Agriculture, had diabetes mellitus for 6 years, came to a doctor. The doctor said that he had mild decreased of renal function (secondary to diabetic nephropathy). The doctor advised him to have low protein diet and go to a dietitian to ask for a menu that he needed. He asked if the low protein diet really necessary because other doctor advised him to have a low calories and normal protein intake to maintain his nutritional status. This doctor told him that low protein diet was needed to prevent the progression of renal failure. He was confused which doctor was right and asked for an evidence. The doctor didn’t have an evidence to show his patient. Could you help this doctor to find evidence from the internet?
Learning task:
Please fill the worksheet as defined in next page.
1. Identify what type of question of the above scenario? 2. Please, build up a clinical research question using PICO ! 3. Formulate a clinical research question from scenario above !
Self assessment
1. Please describe the steps in EBMP !
2. Please describe the components of a good clinical questions !
3. Two additional elements of the well built clinical question are the type of question and the type of study. This information can be helpful in focusing the question and determining the most apppropriate type of evidence. Please describe the type of questions and the typeof the study !
WORKSHEET TO BUILT UP CLINICAL RESEARCH QUESTIONS Scenario # ...
1. Type of question: Choose one of the term below: a. Diagnosis
2. Built up a research question using PICO
P Population/problem=...
I Intervention =...
C Comparator/control =...
O Outcome = ...
3. Clinical research question:
... .
... .
... .
Eka Gunawijaya
What exactly is critical appraisal and what is the difference between "appraising" an article and simply reading it? If you have been conscientious enough to organize a literature search, go to the library and copy a promising article, why can't we leave you alone to read it over a coffee? Why do we ask you to put it through some complex process called critical appraisal?
Critical appraisal is the process of systematically examining research evidence to assess its validity, results and relevance before using it to inform a decision. Critical appraisal is an essential part of evidence-based clinical practice that includes the process of systematically
finding, appraising and acting on evidence of effectiveness. Critical appraisal allows us to make sense of research evidence and thus begins to close the gap between research and practice. The aim of critical appraisal is to identify the quality of an article.
Appraisal is a technique which offers a discipline for increasing the effectiveness of your reading, by enabling you to quickly exclude papers that are of too poor a quality to inform practice, and to systematically evaluate those that pass muster to extract their salient points. Critical appraisal is usually applied to quantitative studies (e.g. "randomized" or "blinded" controlled trials, crossover trials, meta-analyses or systematic reviews) of the effectiveness of different health and medical interventions. However, the skills can also be applied to the assessment of qualitative studies of psychosocial and behavioral interventions: e.g. observational or interview data obtained from case or cohort studies.
Furthermore, studies on the effectiveness of cognitive, behavioral and other psychosocial interventions are also being conducted using quantitative research methodologies (e.g. randomized controlled trials); especially where these interventions are used as part of a combination therapy, which includes medication.
The medical literature is vast and rapidly expanding. Forays into the library can be exhausting, as the reader is overwhelmed by the huge number of papers offered. When reading, someone will cite interesting references, which spur the reader into a lengthy paper haze. A major hazard of reading is to pursue a subject in too much depth. Instead of following this haphazard course, the process of reading should be carefully planned to provide a worthwhile return on the time invested. Establishing control over your reading means following a number of steps: clarify your reasons for reading; specify your information need; identify the relevant reports; critically appraise the papers
I B Subanada
When reading a medical literature we sometimes encounter such phrases like “association with”, “linked to”, and “related to”. The authors have avoided dogmatic statement of “causes” or “produces”, statement like ”smoking causes lung cancer ” or “birth control pills produce vein thrombosis”. Association is not necessarily a causality. Here is an analogy: a town has a large number of unemployed people and a very high crime rate. It does not necessarily follow that the unemployed are committing the crime. In other word the presence of unemployment and crime tells us nothing at all about either the presence or direction of causality. On the other hand, even if we are convince that we have pinpointed the responsible etiology, we still think that some unsuspected risk factor is actually causing the disease or an unappreciated co-intervention is responsible for the treatment effect.
Concept of causation
There are two concepts of causation: First, contributory cause. In most medical phenomena, there is no single specific cause of a disease. In physics we consider that metal will expand because of heat and shrink when cold, therefore expansion in a metal is mathematically caused by heat only as a single cause. Generally, however, most of diseases are caused by multi-factorial etiology. A risk factor may be a contributory cause. The second concept of cause is often called necessary cause. In the 19th century, Robert
Koch developed a series of conditions that must be met before a microorganism can be considered the cause of a disease. Such conditions are related to what is known as Koch’s Postulates, which include a requirement that organism is always found with the disease. In the real medical world most of medical phenomena can only be explained by contributory cause as cause and effect relationship. For instance, even though cigarettes have been well established as a risk factor, it is a contributory cause for the development of lung cancer, but cigarette smoking is not necessarily the condition for development of lung cancer, since not every one with lung cancer has smoked cigarettes. In order to describe the model of cause and effect relationship, we can construct it into two perspectives:
I.B. Subanada
In analytical studies, investigators seek to determine effect size of the outcome of interest between variables or between groups and to determine whether there is a statistical significant of those effect sizes (hypothesis testing).
Most investigations are conducted on only sample or subset of larger group of individuals or subset of population. Researcher, therefore, are confronted with the question of whether results of the investigation in the sample would be similar if the investigation included the entire population or whether chance in the selection of samples (by random sample) produced unusual results in their sample. Hypothesis testing is a method, which is used to answer this question. Hypothesis testing is based on null hypothesis, assuming there is no
difference between groups being compared or there is no relationship between variables. P-value, therefore, is the probability that observes data, or outcome, that would have occurred by chance (just due to sampling variation) when the null hypothesis is true. If P- value is small, probability of chance would be also small and one may doubt about the null hypothesis, which thus can be rejected. If P-value is large, the chance may be great and the data are plausibly consistent with the null hypothesis, which thus cannot be rejected.
Lanang Sidiartha
Statistical analysis is basically a method to assist us to answer a question under study (research question). The research question is commonly formulated in a study hypothesis. A study hypothesis in an analytical study mostly contains one or more independent variables and one dependent variable. The relationship between independent and dependent variable is an important issue in statistical analysis. Regarding this issue, it is not our intention to describe basic statistics, since this subject will be applied for non-statisticians. Many computer programs packed with statistical soft ware are available and easy to operate. However, this subject aims to guide the student to understanding the principle of selecting statistical analysis and interpreting the results and the meaning parameters in statistics.
Statistics have three purposes in the analysis of health research studies
1. To make estimates of the strength of relationship or magnitude of differences
2. To be used in hypothesis testing, which is allows us to draw inferences about population from samples, obtained from the same population.
3. To adjust to the influence of confounding variables on these estimates and inferences.
When selecting a specific statistical method, we must think about variables. A variable expresses or represents data in the mathematical procedures that are part of statistics. About variable, we should identify:
1. What the function of each variable, and
2. What type of data is represented by each variable
With regard to the function of variable, we have to distinguish dependent variable from independent variable. Dependent variable can be identified as the outcome or end-point of a study. On the other hand, there may be no, one, or several independent variables that may be identified as risk factors or treatment of interest. The third is confounding variable, which needs to be taken into account when hypotheses are to be tested and estimates are to be made.
With regard to the type of data, we have to categorize them as continuous and discrete. Continuous data are defined as data that provide the possibility of observing any of an infinite number of equal spaced numerical values between any two points in its range of
measurement, for examples, blood pressure, serum cholesterol, age, and weight. Discrete data can only a finite or limited number of values in their range of measurement, for examples, number of pregnancies, stage of disease, and gender. For each of these variables, we can select two values between which it is not possible to imagine other value. For instance, there is no number of hypertension stages between stage 1 and stage 2. Then data can be defined further by their scale of measurement. Continuous data are measured on scales, called ratio or interval scales. Discrete data, on the other hand, can be measured as nominal (such as treatment, gender, race, and eye color) and ordinal scales (such as stage of the disease and levels of education).
For the purpose of selecting a statistical procedure or interpreting the result of such procedure, it is important to distinguish between three categories: 1) continuous (contain a great number of possible values), 2) ordinal (data are ordered one higher than the next and with at least three), and 3) nominal (only two possible values, such as alive or dead) variables. Continuous variable can be rescaled to ordinal or nominal variable. For example, data of blood pressure (in continuous) can be categorized to stage of hypertension (stage 1, stage 2, and stage 3) as ordinal variable or can be categorized to normal and hypertension as ordinal variable. Continuous variables contain more information than ordinal variable and nominal variables. Thus, continuous variables are considered to be at higher level than nominal variables.
Thus in selecting statistical procedure, the initial steps are:
1. Identify one dependent variable and all independent variables, if present, on the basis of the research question.
2. Determine for each variable whether it represents continuous, ordinal, or nominal data.
The three basic statistical procedures: univariable, bivariable and multivariable analysis
Eka Gunawijaya
A typical sequence for studying a topic begins with observational studies of a type that is often called descriptive. This type of study often explore distribution of diseases and health-related characteristics in the population (How common is TB patients in Bali) or the sensitivity and specificity of a diagnostic test. Descriptive studies are usually followed by analytical study that to evaluate associations to discover cause and effect relationship (Does TB vaccination lower the incidence of lung TB in Bali). Descriptive studies is characterized by a set of measurements contains one dependent variable and no independent variable.
A univariate analysis is therefore commonly used to test the data. There are three application of this method:
1. Descriptive studies (e.g. case series), only one sample might be presented
2. To determine mean or percentage, point estimation and confidence interval of particular groups.
3. Comparing two measurements of same characteristic on the same or very similar individuals (using paired data).
In continuous dependent variable, data are usually assumed to come from population with a Gaussian distribution. Population mean is an estimate of primary interest and dispersion is measured by the standard deviation or variance.
For ordinal dependent variable, we do not assume a particular distribution of population data (distribution free or non-parametric). Estimate of population is median defined as mid-point of a collection of data.
For nominal dependent variable, we determine only the presence or absence of the condition, and we can estimate the frequency of condition occurs in the population. The data is assumed to have either a binomial or Poisson distribution.
Estimating the sample size for descriptive study including studies of diagnostic test is based to that investigator is aiming to calculate descriptive statistics, such as means and proportions (prevalence, incidence, mortality rate) of particular disease in a single population.
Descriptive studies commonly report confidence intervals, a range of values about the sample mean or proportion. A confidence interval is a measure of the precision of the sample estimate. The investigator sets the confidence level, such as 95% or 99%. An interval with a greater confidence level (say 99%) is wider, and therefore more likely to include the true population value, than an interval with a lower confidence level (say 95% or 90%). The width of confidence interval depends on sample size. The more sample size the .narrower the width.
Lanang Sidiartha
Based on variable, statistical analysis was divided to bivariate analysis if consist of one independent variable and one dependent variable and multivariate analysis if consist of one dependent variable and two or more independent variable or two or more dependent variable and one independent variable. There are 5 steps to choose appropriate statistical analysis. First, identified the study hypothesis or research question; second, identified how many variable was compared; third, identified the variable is it related or unrelated variable; fourth, identified scale of measurement of data; and fifth, identified the criteria for parametric test and non-parametric test. Study hypothesis was classified as comparative hypothesis, LECTURE 6. Methodological and Statistical Principles and Applications in
associative hypothesis and correlative hypothesis, each of them has different statistical analysis. Variable or set of data was classified as related group if it was take from the same subject.
Sudhana
The fundamental principle of diagnosis testing rests on the belief that individual with a disease are different from individual without disease and that diagnostic test can distinguish between these two groups. Ideally, diagnostic test have the following features: (1) all individuals without the disease under study have one uniform value on the test, (2) all individuals with the disease have a different but uniform value for the test, thus, (3) all test results would coincide with the results of diseased or those of the disease-free group. If this was the situation in reality, then one perfect test could distinguish disease from health. However, none of these three conditions is usually present. Variation exist is due to same factors coming from subjects being studied, instrument being used and the observer. Subject variation is condition of the individual subject being tested may vary from performance to performance, resulting in changes in phenomenon being assessed. Instrument variation may occur as a result of technical methods used to perform the test. Errors may occur because of variations when using the same testing instrument (intra-instrument error) or when using different (intra-instrument (inter-(intra-instrument error). Observer variation may occur as a result of the observer who assesses the results. Errors may occur because of the variation in measurement by the same observer (intra-observer variation) or error using different observers (inter-observer variation).
The test or criterion used to unequivocally define the disease is known as a gold standard. The gold standard may be a biopsy, an angiogram, an autopsy, or any established test. The use of a gold standard tests that is possible to be 100% correct in making a diagnosis. There might be a cheaper or more convenient test. In diagnostic test, we can ask whether the test measures up to the gold standard. The investigator classifies each patient as either having the disease or being disease-free according to the gold standard test, and as positive or negative by the test being evaluated. They then can calculate the number of individuals for whom the test and the gold standard test agree and the number for whom they disagree and display their result in2X2 table as follows:
A b a + b
C d c + d
a + c b + d a + b + c + d
Test (+)
(-)
Predictive
Value
Positive Total
LECTURE 7: Diagnostic Test
Table 1. Table 2 x 2 table
We can determine, a = number of individuals with the disease and test positive: true positive; b = number of individuals diseased free and test positive: false positive; c = number of individuals with the disease and test negative: false negative; d = number of individuals disease-free and test negative: true negative. Then, a + c = total number of individuals with the disease and b + d = total number of disease-free individuals. From these components we can calculate sensitivity = a/(a+c) and specificity = d/(b + d) of the test.
If we want to critically appraised an article about diagnosis, we are confronted with V I A, that stands for valid, important and applicable which appraises the validity, importance and applicability of the report.
1. The validity will questions whether evidence about the accuracy of a diagnostic test valid
2. The importance query of whether this (valid) evidence demonstrate an important ability to accurately distinguish patients who do and don’t have specific disorder
3. The applicability may ask of whether we can apply this valid important diagnostic test to specific (our) patients.
To step on a critical appraisal, an important issue about the test being studied that we need to define is what is normal and what is abnormal. Both parameters will be applied to the test being studied and the gold standard.
We can define the normalcy from six approaches:
1. Gaussian: mean ± 2standard deviations – this one assumes a normal distribution for all tests and results in all “abnormalities” having the same frequency
2. Percentile 5-95%- has the same basic defect as the Gaussian definition
3. Culturally desirable: when “normal” is that which preferred by society, the role of medicine gets confused
4. Risk factor: changing risk factor necessarily changing risk
5. Diagnostic: range of result beyond which target disorder became highly probable
6. Therapeutic: range of result beyond which treatment does more good than harm. Means we have to keep up with the advances in therapy.
Problem may arise with parameters in continuous variables. With such tests, several
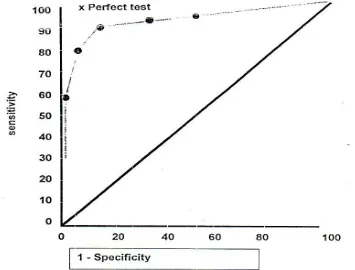
Fig 1. Receiver operating characteristic (ROC) curve for some cutoff points of a continuous variable.
Values of sensitivity and specificity are possible, depending on the cutoff point chosen to define a positive test. This trade- off between sensitivity and specificity can be displayed using a graphic technique. This technique originally developed in electronic equipment called receiver operating characteristic (ROC) curves. We select several cutoff points and determine sensitivity and specificity at each point. We then graph the sensitivity (or true-positive rate) on Y-axis as a function of 1-specificity (false-true-positive rate) on X-axis. An ideal test is one that reaches the upper left corner of the graph (100% true positives and no false positives). A worthless test follows the diagonal from the lower left to the upper right corner (see fig.1). The area under curve (AUC), which does ranges from 0.5 for useless test to 1.0 for prefect test, is useful summary of the overall accuracy of a test and can be used to compare the accuracy of two or more tests.
Raka Widiana
Some treatments are so clearly advantageous that they require no formal assessment; this is true of antibiotics for pneumonia and surgery for serious trauma. However, this situation is relatively rare in clinical medicine. Usually the effects of treatment are much less obvious and most interventions require research to establish their value. Not only must specific interventions be shown to do more good than harm among patients who use them (i.e. they
LECTURE 8: Clinical Trial
are theoretically effective or efficacious), but they should also do more good than harm in patients to whom they are offered (i.e. they should be practically effective). In studies of efficacy it is advantageous to include who are likely to be compliant. Practical effectiveness is determined by studying outcome in a group of people offered treatment, only some of who will be compliant. The most accurate method for measuring effectiveness is a clinical trial.
Clinical trials are a special kind of cohort study in which the conditions of study – selection of treatment groups, nature of interventions, management during follow up, and measurement of outcomes – are specified by the investigator for the purpose of making unbiased comparisons. Clinical trials are more highly controlled and managed than are cohort studies (observational study). The investigators are conducting an experiment, analogous to those done in the laboratory. They have taken it upon themselves (of course, with their patient’s permission) to isolate for study the unique contribution of one factor by holding constant, as much as possible, all other determinants of the outcome. Hence, other names for clinical trials are experimental and intervention studies.
We need to define exactly what is meant by ‘clinical trial’; briefly the term may be applied to any form of planned experiments which involves patients and is designed to elucidate the most appropriate treatment of future patients with a given medical conditions. Perhaps the essential characteristic of a clinical trial is that one uses results based on a limited sample of patients to make inferences about how treatment should be conducted in the general population of patients who will require treatment in the future. Randomized controlled trials (RCT) are the standard of excellence for scientific studies of the effects of treatment in clinical trial.
RANDOMIZED CONTROLLED TRIAL
The structure of an RCT is shown in Figure-1. The patients to be studied are first selected from a larger number of patients with the condition of interest. They are then divided, using randomization into two groups of comparable prognosis. One group, called the experimental
or treated group, is exposed to an intervention that is believed to be helpful. The other group, called a control or comparison group, is treated the same in all ways except that its members are not exposed to the intervention. The clinical course of both groups is then observed and any differences in outcome are attributed to the intervention.
The main reason for structuring RCT in this way is to avoid bias (systematic error) when comparing the respective value of the two or more kinds of treatments. The validity of RCT depends on how well they result in an equal distribution of all determinants of prognosis, other than the being tested, in treated and control patients.
NOT IMPROVED IMPROVED Experimental
Intervention
Figure 1: The structure of a RCT
SAMPLING
Any RCT requires a precise definition of which patients are eligible for inclusion. The early stages of protocol development may proceed with only a rough outline of the intended type of patient, but before the RCT gets underway this must be transformed into detailed specification. The main objective is to ensure that patients in the RCT may be identified as
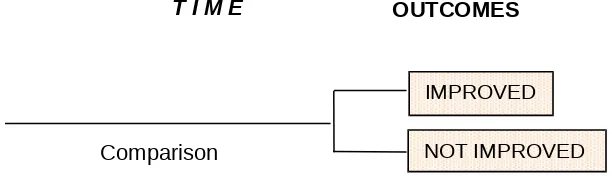
representative of some future class of patients to whom the RCT finding may be applied as shown in Figure 2.
The kinds of patients that are included in an RCT determine the extent to which conclusions can be generalized to other patients. Of the many reasons why patients with the condition of interest may not be a part of an RCT, three account for most of the losses. They do not meet specific entry criteria, they refuse to participate or they do not cooperate with the conduct of the trial.
The first, entry criteria is intended to restrict the heterogeneity of patients in the trial. Common exclusion criteria are atypical disease, the presence of other diseases, an unusually poor prognosis (which may cause patients to drop out of the assigned treatment group), and evidence of unreliability. Patients with contraindications to one of the treatments are also excluded, for obvious reasons. As heterogeneity is restricted in this way, the internal validity of the study is improved; there is less opportunity for differences in outcomes that are not related to treatment itself. Also, generalizing the results is more precise because one knows exactly to whom the results apply. But exclusions come at the price of diminished scope of generalizability, because characteristics that exclude patients occur commonly among those ordinarily seen in clinical practice, limiting generalize ability to these patients, the very ones for whom the information is needed.
Second, patients can refuse to participate in the trial. They may not want a particular type of treatment or to have their medical care decided by a flip of a coin or by someone other than their own physician. Patients who refuse to participate are usually systematically different – in socioeconomic class, severity of disease, other health-related problems, and other ways – from those who agree to enter the trial.
Third, patients who are found to be unreliable during the early stages of the trial are excluded. This avoids wasted effort and the reduction in internal validity that would occur if patients moved in and out of treatment groups or out of the trial altogether. For these reasons, patients in an RCT are usually highly selected, biased sample of all patients with the condition of interest. Because of the high degree of selection in trials, it often requires considerable faith to generalize the results of RCT to ordinary practice settings.
IMPROVED
NOT IMPROVED Comparison
Intervention
Figure 2: Generalizability in an RCT
CRITICAL APPRAISAL
The critical appraisal of an RCT is one of the basic elements of medical informatics and evidence-based medicine curricula. Various frameworks for critical appraisal have been proposed. This paper proposes a framework for evaluating an RCT that consists of 12 questions grouped under 3 headings (table 1,2 and 3). These questions are very helpful to do critical appraisal on RCT, and enclosed at the end of this paper.
• Are the results of the RCT valid?
• What were the results?
• Will the results help me in caring for my patients?
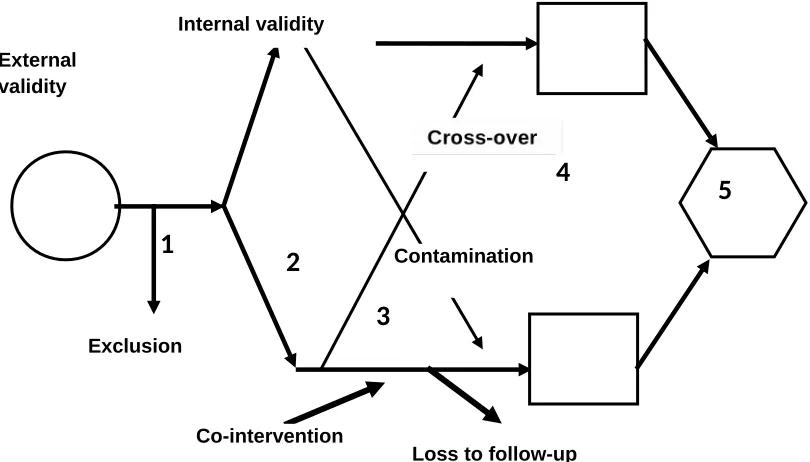
The paper put together a flow diagram of an RCT and the point’s at which bias can creep in; this flow diagram serves as a memory aid and can act as a framework on which to "hang" whatever critical appraisal guide the user is most comfortable with.
Each of the 5 numbered steps in the RCT flow diagram can act as the focal point for a discussion of methods.
Populatio n
sampled
OTHER
POPULATION Sampl
e
Control
Outcome
Allocation
Statistical
analysis
Treated Outcome
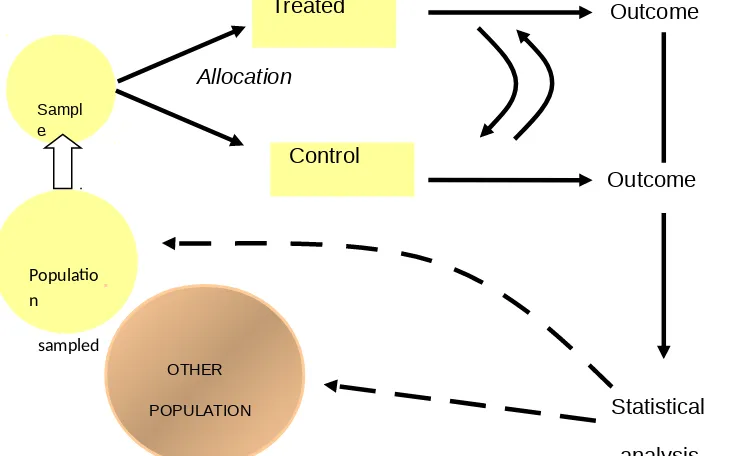
Figure 3: Flow diagram for an RCT
Figure 3 above shows the flow of an RCT and can be drawn as the starting point for a critical appraisal exercise. Each of the 5 numbered steps in the RCT flow diagram can act as the focal point for a discussion of methods.
Step 1: selection and sampling issues
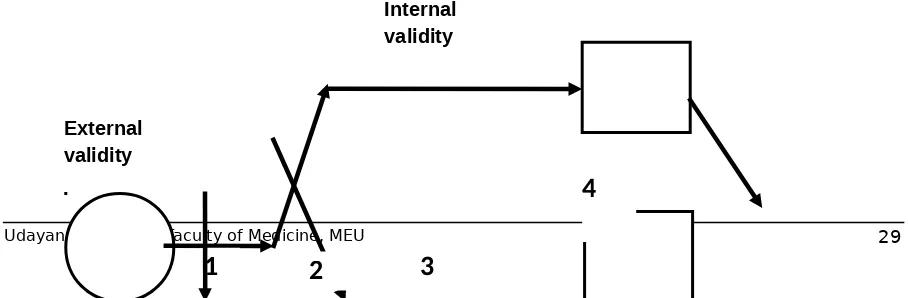
When drawing the larger circle, one can ask such questions as "What sorts of patients were recruited, and where were they recruited from (i.e. primary care or a referral centre)?" When drawing the arrow that indicates which patients are recruited into the study, one can ask whether the inclusion and exclusion criteria make sense and whether consecutive patients are being recruited; exclusions can be represented graphically by drawing a second arrow peeling off from the main one. This arrow also serves to indicate the total number of patients screened to obtain the enrolled sample. All these considerations affect the external validity
and generalizability of the study, whereas subsequent steps affect internal validity. The graphical representation of this concept is the box drawn around the remainder of the study (fig 4).
Step 2: randomization
The arrows representing the allocation of participants to the 2 groups serve to highlight graphically the process of randomization, which evenly (or at least randomly) distributes known and unknown confounders. One can then discuss the principle of randomization, including concealment (the person enrolling the patient in the study must not be able to predict to which group the patient will be randomly allocated, and less secure processes, such as quasi-randomization. One can then ask how to check the success of randomization. Are the baseline characteristics of the study groups similar? Any imbalance in those characteristics can signal 1 of 2 things: randomization has not been done properly (the participants were not truly randomly allocated) or randomization was done properly but a discrepancy has arisen by chance (which is more likely when the number of patients is small). In the latter case, one can check to see whether the study authors statistically adjusted for the differences
External validity
4
Figure 4: Internal validity of an RCT
Step 3: follow up
A catchy mnemonic that is helpful in highlighting the sources of bias at this step are the "5 Cs": contamination, crossover, compliance, co-intervention, and count (i.e. loss to follow up).
Contamination often occurs in a trial of an educational intervention where, for example, the control group may adopt such lifestyle changes as dietary modification or exercise intended for the intervention group only. Contamination can also happen when control and treated patients share their medications, as in certain AIDS trials.
Crossover occurs most often in open trials in which patients or clinicians know what medication the patient is receiving and also what the alternative treatment is: for example, in trials where there are medical and surgical arms or a conservative and aggressive treatment protocol, patients in the less aggressive arm who worsen may cross over to the more aggressive treatment arm. Crossovers may represent graphically as arrows that cross between the two arms of the trial (Fig 5).
5
Exclusion
External validity
Exclusion
Co-intervention
Loss to follow-up Contamination Internal validity
1
2
3
4
Figure 5: Sources of bias in RCT
Lack of compliance with the intervention can introduce bias, as can count or loss to follow up, if patients who drop out differ in their characteristics from those who remain. Both sources of bias may be represented by arrows that peel off from the 2 arms (fig 5).
interventions also introduce bias if they are applied differentially to the 2 groups. Co-interventions can be represented by arrows that join the two arms (Fig 5). Contamination, crossover, and lack of compliance will bias results toward the null (attenuate any effect); whereas co-intervention and count may bias results in either direction.
Step 4: outcomes
The boxes in the figures represent the outcomes in the 2 groups. Discussion can focus on whether the chosen outcomes were reasonable and whether all-important outcomes were considered. Who judges or counts the outcome is of concern. Outcome assessment leads to a discussion of the importance of blinding, which can include blinding of the patient, the caregiver, the outcome assessor (particularly important when such patient-reported subjective measures as quality of life are used), and even the statistician doing the analysis. Having the assessors and patients guess their assignments at the end of the trial can give an indication of whether un-blinding occurred.
Step 5: analysis
This step includes a discussion of intention to treat (ITT) analysis. ITT analysis is important because it preserves the benefit of randomization. If those patients who dropped out, were non-compliant, or had intolerable adverse effects are not considered in the analysis, it is the equivalent of allowing participants to self select or opt out of the study. If these patients' characteristics differ from those of the rest of the group, the even distribution of confounders obtained through randomization is lost.
Other issues of analysis include the magnitude of the effect (measured by relative and absolute risk differences, odds ratios, and numbers needed to treat), precision (confidence intervals), and subgroup analyses (were these preplanned or derived from a "fishing expedition" once the data became available?).
Eka Gunawijaya
As clinicians, we consider questions about prognosis all the time. Sometimes the questions are posed by patients and are quite direct: “How long have I got?” At other times, we pose
LECTURE 9: Study about Prognosis
these questions ourselves, and they may be less direct, as when deciding whether to treat at all (e.g. an elderly man with chronic lymphocytic leukemia who feels well – would his prognosis be importantly altered if he were left alone until becomes symptomatic?) or deciding whether to screen (e.g. for abdominal aortic aneurysms – what is the fate of the undetected 4 cm aneurysm?). These questions share three elements: a qualitative aspect
(Which outcomes could happen?), a quantitative aspect (How likely are they to happen?) and a temporal aspect (Over what time period?).
Prognosis is a prediction of the future course of disease following its onset and is expressed as the probability that a particular event will occur in the future. Doctor and patients think about prognosis in several different ways. First, they want to know the general course of the illness the patient has. Second, they usually want to know, as much as possible, the prognosis in the particular case. Third, patients especially are interested to know how an illness is likely to affect their lives, not only whether it will or will not kill them, but how it will change their ability to work, to walk, to talk, how it will alter their relationships with family and friends, how much pain and discomfort they will have to endure.
NATURAL HISTORY AND PROGNOSIS
Prognosis is closely associated with the natural history or clinical course of the disease. The term natural history refers to the stages of disease, which include:
1. Pathological onset
2. The pre-symptomatic stage from onset of pathological changes to the first appearance of symptoms and signs.
3. The stage when the disease is clinically obvious and may be subject to remissions and relapse, regress spontaneously, or progress to death
Detection and treatment at any stage can alter clinical course of a disease, but the effects of treatment can only be determined if clinical course of the disease in the absence of treatment is known. The prognosis of disease without medical intervention is termed the
natural history of disease. Natural history describes how patients will fare if nothing is done for their disease. A great many medical conditions, even in countries with advanced medical care systems, often do not come under medical care. They remain unrecognized, perhaps because they are asymptomatic or are considered among the ordinary discomforts of daily living. Examples include mild depression, anemia, and cancers that are occult and slow growing (e.g. some cancers of the thyroid and prostate).
Patients usually come under medical care at some time in the course of their illness when they have diseases that cause symptoms such as pain, failure to thrive, disfigurement, or unusual behavior. Once disease is recognized, it is also likely to be treated.
PROGNOSIS STUDIES
disease or condition, in the case of prognostic studies) are assembled and followed forward in time, and clinical outcomes are measured, Often, conditions that are associated with a given outcome of the disease, i.e. prognostic factors, are sought.
Epidemiological information is necessary to provide sound prediction on prognosis and outcome. Clinical experience alone is inadequate for this purpose since it is often based on a limited set of patients and inadequate follow-up. For example, patients who are seen by a doctor are not necessarily representative of all patients with particular disease. Patients may be selected according to severity or other features of their disease, or by demographic, social or personal characteristics of the patients themselves. Further more, since many doctors do not systematically follow up their patients, they have a limited, and often excessively pessimistic, view of the prognosis of disease. For these reasons epidemiological studies are required to describe accurately the natural history and prognosis of disease.
Ideally, the assessment of prognosis should include measurement of all clinically relevant outcomes, not just death, since patients are usually as interested in the quality of life as they are in its duration. In studies to determine natural history and prognosis, the group of patients should be randomly selected; otherwise selection bias may severely affect the information obtained. For example, the prognosis of patients with chest pain admitted to hospital is likely to be worse that that of patients with chest pain seen by health workers in the community.
Prognosis in term of mortality is measured as case-fatality rate or probability of survival. Both the date of onset and the duration of follow-up must be clearly specified. Survival analysis is a simple method of measuring prognosis. Life-table analysis is a more sophisticated method that attempts to predict the onset of events over time from previous patterns for all patients at risk. In the follow-up of cohorts of patients to determine prognosis, bias can arise from the method of assembling the cohort and from incomplete follow-up.
PROGNOSTIC FACTORS
Although most patients are interested in the course of their disease in general, they are even more interested in a prediction for their given case. Prognostic factors help identify groups of patients with the same disease who have different prognosis.
DIFFERENT BETWEEN PROGNOSTIC FACTORS AND RISK FACTORS
Studies of risk factors usually deal with healthy people, whereas prognostic factors – conditions that are associated with an outcome of the disease – are, by definition, studied in sick people. There are other important differences as well, outlined below.
Different Factors
Factors associated with an increased risk are not necessarily the same as those marking a worse prognosis and are often considerably different for a given disease.
Udayana University Faculty of Medicine, MEU
Well Onset of Acute Myocardial Infarction Outcomes
Death Re-infarction Risk Factors
Age ↑
Male
Prognostic Factors
Age ↑ Female
RISK PROGNOSIS
Figure 1: Differences between risk and prognostic factors for AMI
For example, low blood pressure decreases one’s chance of having an acute myocardial infarction, but it is a bad prognostic sign, when present during an acute event (figure 1). Similarly, intake of exogenous estrogens during menopause increases women’s risk of endometrial cancer, but the associated cancers are found at an earlier stage and seem to have a better-than-average prognosis. Some factors do have a similar effect on both risk and prognosis. For example, both of the risk of experiencing an acute myocardial infarction and the risk of dying of it increase with age.
Different outcomes
Risk and prognosis describe different phenomena. For risk, the event being counted is the onset of disease. For prognosis, a variety of consequences of disease are counted, including death, complications, disability, and suffering.
Different rates
Suega
Writing, even writing poorly, is not easy to most researchers. Some lack the initial energy to get started. Others may even have half dozen manuscripts in various stages of completion but never manage to finish. Whatever the problem, you ran improve your writing skill.
First, decide whether it is worth your time and effort to write the manuscript. If you are having a hard time motivating yourself to start, perhaps it is because you do not have much to say. Does the world really need the manuscript? If not, cut your losses and move on to another project.
Next, be sure to use word-processing software that is well suited to medical writing. If you do not already have software you are comfortable with, choose a program that is commonly used at your institution so youcan ask your colleagues questions about it. Take advantage of any spell-checking capabilities; make sure that you spell medical words correctly when you add them to the dictionary. Use a bibliography that will automatically number and format your references. Learn how to download references electronically into the program so you do not have to key them in manually. Use a laser printer, if one is available. The clean look of a laser-printed manuscript increases the motivation to write.
Finally, you cannot write well if you do not write at all. Do not fuss over the first draft of a manuscript, just write, without worrying about style, brevity, or clarity. Prepare a draft that includes a title page, each section of the manuscript, and mock tables and figures. Put your name, a running title, the page number, and the date at the top of each page. The more the draft looks like a manuscript, the prouder you will feel, and the more likely it will that you and your coauthors will be willing to invest additional time in improving it. This works even if some of the sections consist of nothing more than the word pending.
You cannot write well if you do not readwhat you have written. Print a copy of the first draft. Read it to make sure that you have not left anything out. Make the necessary additions to the next draft, incorporate them into the word-processed version, and print the revised manuscript. Each version will be better than its predecessor, and the incremental improvements will encourage you to proceed.
When you think you have a nearly complete draft containing all of the scientific material, print a copy and sharpen a pencil. Cross out every paragraph that is not necessary. (If trimming your writing pains you, substitute the word critical for necessary). Delete every extra sentence within the remaining paragraphs, and finally, the extraneous words within the remaining sentences. Underline everything that is not crystal clear. Circle words that do not make sense. Put an arrow before every paragraph that does not flow logically from its predecessor and write: “Segue?” Sharpen another pencil, and begin clarifying the ambiguities, replacing the awkward words and phrases, and filling in the missing links.
Style will be the objective for the next two or three drafts of the manuscript. But if you never learned how to write well, or are someone for whom English is a second language, do not fuss over this aspect. Hire a copy editor to do it for you.
the methods and results?, Between the text and tables?, Between the results and the discussion?
If you are a non-speaking author, do not submit a manuscript to an English-language journal until it has been read and edited by a native English speaker who understands the scientific content. Editors do not enjoy the thought of sending reviewers a manuscript that is difficult to understand. Reviewers do not like having to read them because they take more time. Thus, manuscripts describing good or even excellent work may be rejected because the English is poor.
HOW TO PRESENT AT A MEETING
Presentation is a one method of communication, but has a limited understanding. Communication by definition is, a two-way process of interaction, while presentation tends to be one way only.
Assuming that the intention of your presentation is to inform your audience, so that some thing is learned from you, what do we know in general about how people learn?
People learn best when: 1. they are motivated
2. they recognize their need to learn
3. the learning is relevant in context and matches their needs 4. the aims of the learning are clear
5. they are actively involved
6. a variety of learning methods is used 7. it is enjoyable.
SMALL GROUP DISCUSSIONS (SGD)
SGD 1:Association and Causation Learning task
What is the basic difference between association and causation?
What are the differentiation between contributory cause and necessarily cause?
What are the features of contributory cause?
What are the source of spurious association between cause and effect in a study?
SGD 2.
2. What is the principle of hypothesis testing? 3. What is the principle of confidence interval?
4. What is the relationship between effect size, hypothesis testing, and confidence interval?
5. How to report an abstract showing effect size, confidence interval, and effect size?
Principal and application of statistical analysis
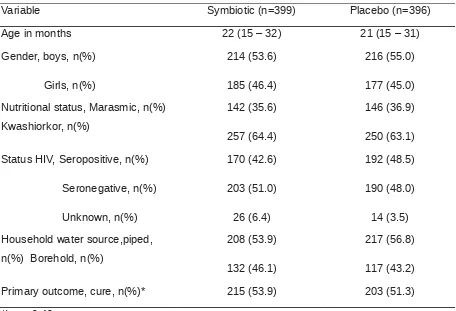
[image:37.595.89.545.410.721.2]Severe acute malnutrition affects 13 million children worldwide and causes 1–2 million deaths every year. Our aim was to assess the clinical and nutritional efficacy of a probiotic and prebiotic functional food for the treatment of severe acute malnutrition in a HIV-prevalent setting. We recruited 795 Malawian children (age range 5 to 168 months) from July 12, 2006, to March 7, 2007, into a double-blind, randomized, placebo-controlled efficacy trial. Children were randomly assigned to ready-to-use therapeutic food either with (n=399) or without (n=396) Synbiotic2000 Forte. Primary outcome was nutritional cure (weight-for-height >80% of National Center for Health Statistics median on two consecutive outpatient visits). Nutritional cure was similar in both Symbiotic and control groups (53.9% [215 of 399] and 51.3% [203 of 396]; p=0.40). The characteristic of subjects were presented in table 1 below.
Table 1. Characteristic of subject
Variable Symbiotic (n=399) Placebo (n=396)
Age in months 22 (15 – 32) 21 (15 – 31)
Gende