T
HE
R
OLE
OF
G
OVERNANCE
, ICT
AND
B
AD
L
OANS
IN
A
USTRALIAN
B
ANK
E
FFICIENCY
: A
N
E
MPIRICAL
S
TUDY
*
r u h u l s a l i m , m o h a m m a d z i a u l h o q u e a n d s u y a n t o
salim is associate professor of economics, curtin business school, curtin university of technology, perth, australia
hoque is lecturer, department of accounting and finance, monash university, caulfield, australia
suyanto is senior lecturer of economics, university of surabaya and senior researcher at centre for business and industrial studies, east java, indonesia
This paper analyzes the impact of governance, information and
communications technology
(
ICT
)
and bad loans on bank efficiency
over the period
1
997–2007. Using linear programming–based data
envelopment analysis, the study shows that the overall efficiency of
Australian banks is influenced by a consistent growth of technical
efficiency since
1
997, with major banks showing relatively higher
levels of technical efficiency than regional banks. The results from
the Malmquist productivity index reveal that technological progress
contributes substantially to banks’ productivity growth. Furthermore,
the results from the common effect panel data model show that bad
loans and poor governance have negative effects while ICT has a
positive impact on banks’ technical efficiency.
IntroductIon
Banking constitutes a vital part of the financial system of any economy. despite the changing circumstances that have occurred in recent years as a result of the technological revolution, the development of various financial intermediaries and the globalization of financial markets, banks continue to play a dominant role in the economy. Hence, evaluating banks’ performance in terms of productive efficiency is of critical importance not only to bank managers or banks’ shareholders, but
the aims of this study are two-fold: one is to examine the productive efficiency of Australian banks; and the other is to analyze the impact of corporate governance, information and communications technology (Ict), and non-performing loans on banking efficiency using data over the period 1997–2007.
Good loans and good corporate governance provide sound resource allocation and ensure efficient performance in the banking sector. Several earlier studies confirm this proposition. Berg, Forsund and Jansen (1992), Kwan and Eisenbeis (1996), resti (1996) and, more recently, dongili and Zago (2005) report that there is a negative relationship between problem loans and the efficiency of banking institutions. these studies further argue that the institution with problem loans incurs high costs and generates low profits relative to the institution with the ‘best practice’ efficient frontier. Pi and timme (1993), Berger and Mester (1997), Berger et al. (2005) and Gup (2007) argue that corporate governance affects the behavior and performance of banks, innovative activity, and the development and functioning of capital markets; and exerts a strong influence on resource allocation. It is also argued that the current financial crises, credit crunch and the collapse of some of the renowned financial institutions in the united States (uS) and Europe are attributed to persistent default loans, bad governance and poor regulatory response from the banks. In addition, the whole banking landscape has been changing since the mid-1990s with the use of Ict, which has been transforming banks both quantitatively and qualitatively. Moreover, improvements in information technology continue at a high rate and are expected to have a significant impact on future banking methods and structures. Yet there is little empirical evidence on the effects of Ict adoption on banking efficiency gains. Furthermore, none of the previous studies focused on analysis of the sources of bank (in-)efficiency, Australian banks in particular, after
incorporating the above three important determinants. this study attempts to close this gap and provides an important addition to the body of knowledge relating to bank efficiency.
the paper is organized in the following way. Firstly, an overview of Australian banking is presented, which is followed by a critical review of theoretical and empirical literature. the next section outlines the analytical framework, after which the data sources and variables construction are described. the empirical results are then presented along with a discussion about links between productive efficiency and corporate governance, Ict and non-performing loans (nPLs). Finally, there is a concluding section in which some policy implications are discussed.
oVErVIEW oF AuStrALIAn
BAnKInG
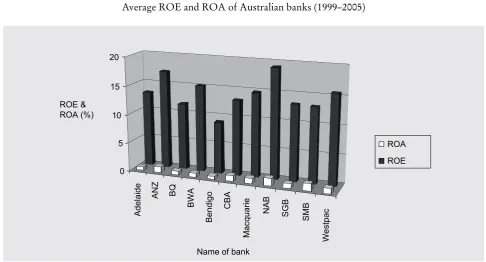
national Australia Bank (nAB) and Westpac Banking corporation. these banks are highly diversified, both geographically and in their income. the most prominent regional banks are the Adelaide Bank, Bendigo Bank, Bank of Queensland (BQ), St.George Bank (SGB), Bank of Western Australia (BWA) and Suncorp-Metway corporation (SMB). the market is highly dominated by the four largest banks which together control 67.5% of total banking assets and 32% of the assets of all financial institutions in Australia. Figure 1 shows that the national Australia Bank (nAB) was the largest bank in Australia during 1999–2005, with average total assets over the period of A$261 billion. It is also evident that it was the most profitable and efficient bank in Australia during this period, with 1.35% average return on assets (roA) and 19.15% average return on equity (roE).
the commonwealth Bank of Australia (cBA) was the second largest bank (average assets of A$247 billion), while AnZ Banking corporation (AnZ), the third
largest bank (A$205 billion in assets), demonstrated high profitability with an average roE of 17.0%. AnZ’s efficiency, however, as measured by its average roA (1.08%) was lower than that of Suncorp-Metway (1.25%). Similarly, Westpac Banking corporation, the fourth largest bank (A$200 billion in assets), achieved roE of 15%. the lowest roE was recorded by the Bank of Bendigo with 9.02% roE and 0.55% roA. With the same average assets (A$8 billion), the Adelaide Bank achieved a 13.18% roE.
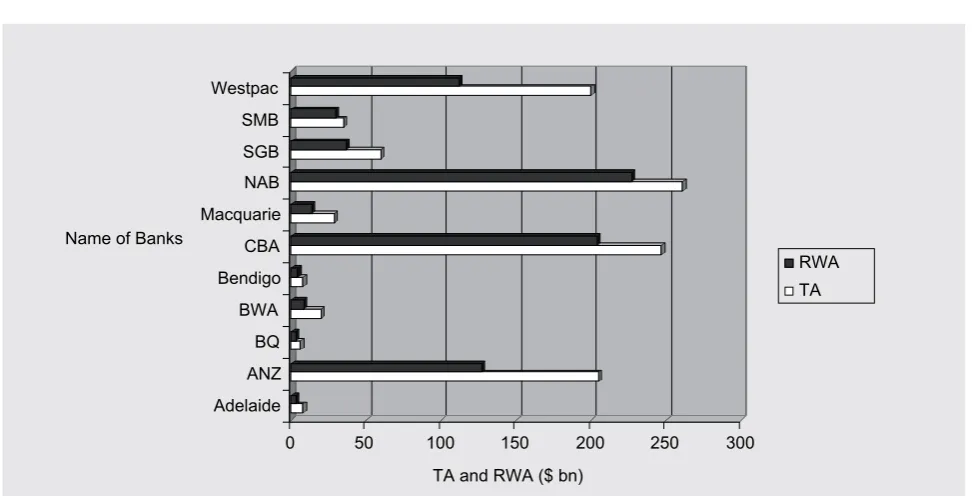
the relationship between risk and return is well known, so one would expect to see a relationship between the level of risk and the financial performance of Australian banks. the per cent of risk-weighted assets (rWA) to total assets (tA) provides one indication of risk, whereby the lower the ratio, the lower the risk. the relationship between risk and returns, however, shows no conclusive results in this regard. Figure 2 (opposite) shows that with tA of A$247 billion and rWA of A$204 billion (83%),
Ad
el
ai
de ANZ BQ
BW
A
Be
nd
ig
o
C
BA
Ma
cq
ua
rie
N
AB
SG
B
SMB
W
est
pa
c
0 5 10 15 20
ROE & ROA (%)
Name of bank
ROA ROE FIGurE 1
t h e r o l e o f g o v e r n a n c e , i c t a n d b a d l o a n s i n a u s t r a l i a n b a n k e f f i c i e n c y
the cBA generated an annual average roE of 13.14%; whereas a 17.05% roE was earned by AnZ with 62% of rWA to tA. Much the same roE was achieved by the Adelaide Bank with 42.50% rWA, St.George Bank with 62% rWA, and Suncorp-Metway with 84.28% rWA. All these show that the Australian banks have demonstrated a convincing and satisfactory growth of rWA and bank efficiency in terms of roA.
LItErAturE rEVIEW
Banking Efficiency: International
Literature
A remarkable number of studies on the efficiency of the banking industry has been carried out over the last two decades. Some studies focus on measuring the efficiency indices and separating efficiency change from
technological change, while others pay more attention to the determinants of efficiency. Aly et al. (1990) measure the efficiency of uS banking and find that the technical component is relatively more important than the allocative component as a source of overall inefficiency. Elyasiani and Mehdian (1995) estimate the efficiency of the uS banks, but they extend further to separate efficiency change and technological change. they show that the productive performance of the observed banks comes mainly from technological change. Similar types of evidence are found by Grifell-tatje and Lovell (1997) and casu, Girardone and Molineux (2004) for Spanish and European banks, respectively. Most of the earlier studies identify some key determinants such as size, age, market share, and loan-asset ratio that influence banking efficiency. these studies include Berger and Mester (1997) for the uS; delis and Papanikolaou (2009) for the European union; Hassan, Al-Sharkas and Samad
0 50 100 150 200 250 300
TA and RWA ($ bn) Adelaide
ANZ BQ BWA Bendigo CBA Macquarie NAB SGB SMB Westpac
Name of Banks
RWA TA FIGurE 2
(2007) for Bahrain; and Sufian (2009) for Malaysia. Some studies focus on the effects of bad-debts or problem loans on banking efficiency. Berg, Forsund and Jansen (1992) make the original observation by including bad-debts into a production function in their study on norwegian banking. their results show a negative effect of bad-debts on productivity growth, but the magnitude was very small, which indicates a non-binding constraint of bad-debts in norwegian banking. In a similar vein, Berger and de Young (1997) examine the inter-temporal relationship between problem loans and the efficiency of uS banks between 1985 and 1994. they find that the increase in problem loans is related to the decrease in overall efficiency of uS banks. resti (1996) and Matthews, Guo and Zhang (2007) also find a negative effect of bad-debts on efficiency for Italian and for chinese banks.
Empirical literature on the relationship between banking efficiency and Ict is not plentiful. the authors of this paper found only two working papers on the issue. Suhaimi (2005) examines the effect of Ict on the overall efficiency of Malaysian banks between 1995 and 2003 and finds that expenditure on Ict significantly decreases inefficiency. More recently, Erber and Madlener (2008) made an attempt to examine the link between Ict expenditure and banking efficiency in the European financial sector. their results suggest that expenditure on Ict might need to be complemented by learning-by-doing and learning-by-using modes of training in the new technology in order to increase the efficiency of financial institutions. Although these two studies bring a significant contribution to the literature, they suffer from some drawbacks. While Suhaimi’s study is dated, Erber and Madlener’s study is laced with an implicit homogeneity assumption in the observed relationship across European countries.
An extensive literature search failed to locate a significant number of studies on the relationship
between corporate governance and productive efficiency of banking institutions. only two recent studies could be located that focused on the relationship between corporate governance and banking performance. Williams and nguyen (2005) identify corporate governance in terms of bank ownership (state-owned, private-owned, and foreign-owned) and find that privatization raises banking performance. Berger
et al. (2005) report identical findings in the sense that
privatization increases banks’ performance. Although these studies do not typically examine the effects of corporate governance on banking efficiency, they may provide a foothold for furthering the study on the linkage between corporate governance and banking efficiency. Furthermore, elements of some empirical studies that examine the link between corporate governance and technical efficiency in the manufacturing sector may provide some insights for studying such a relationship in the banking sector. In a study on ukrainian manufacturing industries, Zulenyuk and Zheka (2006) find a positive relationship between the level of corporate governance quality and the technical efficiency level. But destefanis and Sena (2007) find otherwise in the case of Italian manufacturing firms. Since standard economic theories do not provide an explicit link between corporate governance and technical efficiency, it largely remains a matter of empirical issue.
Australian Literature
t h e r o l e o f g o v e r n a n c e , i c t a n d b a d l o a n s i n a u s t r a l i a n b a n k e f f i c i e n c y
to have studied Australian banking efficiency. using cross-border data they concluded that Australia had a relatively efficient banking system. Applying a translog
cost function to twelve Australian banks, Walker (1998) shows that there is no evidence of diseconomies of scale although some evidence is found of constant returns to scale. Analyzing post-deregulation bank mergers, however, between 1986 and 1995, Avkiran (1999) finds inefficiency in the post-deregulation period, and that acquiring banks are more efficient than the target banks in the merger process. He further reports that bad loans affect banking efficiency negatively. He did not test this proposition empirically, however. Subsequently, using the same data set, Avkiran (2000) extends the analysis in respect of productivity decomposition and shows that technological progress (tP) is the main driver behind productivity growth.
Applying the data envelopment analysis (dEA) to Australian banking data for the year 1996, Sathye (2001) investigates X-efficiency and finds that average technical efficiency is lower than average allocative efficiency. In addition, he estimates the relationship between efficiency and several factors that might contribute to inefficiency. But he did not consider bad loans, Ict or corporate governance as important factors for his study. Later on, Sathye (2002) measures the productivity growth of Australian banks over the period 1995–99 using the Malmquist index, and finds that technical efficiency decreases by 3.5% during the sample period. By segmenting Australian banks into two groups (major and regional banks), he shows that there is no relationship between bank size and productivity growth. neal (2004) imitated the same dEA technique for the same data period considered by Sathye (2002) and finds that allocative efficiency is higher than technical efficiency for the sample period and that allocative efficiency tends to increase over time. He also finds that the average
annual total factor productivity (tFP) growth is 7.6%, which is 1.013% in Sathye’s (2002) study, and that such change is mostly driven by technological progress. Furthermore, neal provides evidence that the Australian banks are less efficient in 1999 compared to 1995. dividing Australian banks into three categories: national, regional and international, he shows that regional banks are the worst performers in terms of efficiency and productivity. Also, he reports that the unproductive regional banks may become the target of the large banks. A more recent study is conducted by Kirkwood and nahm (2006). using data of ten Australian banks from 1995 to 2002, Kirkwood and nahm find that technological progress is the main driver of tFP growth, which is identical to what is found by neal (2004). unlike neal, however, they also find that regional banks have higher cost efficiency than large national banks during the period in question. In fact, regional banks experienced lower efficiency after 2000, since they have a fairly constant level of cost efficiency. Kirkwood and nahm also show that the cost efficiency in Australian banks is mostly driven by allocative efficiency, which contradicts Sathye’s (2001) findings.
Australia; to the extent that this exercise constitutes one of the objectives of the current study.
MEtHod And EMPIrIcAL
ModEL
Generally speaking, two approaches are used to estimate banking efficiency: the parametric approach and the non-parametric approach. the commonly used non-parametric technique is stochastic frontier analysis (SFA) and the non-parametric approach is data envelopment analysis (dEA). the SFA has the advantage of separating the inefficiency component from the purely random component, which represents the effect of variables beyond control of production units; whereas the dEA assumes that deviations from the efficient frontier arise due to inefficiency. nonetheless, this study adopts the dEA, for three reasons. First, it requires no functional form when measuring efficiency. Imposition of a common functional structure on the production technology of Australian banks would be inappropriate, given the fact that there is wide variation among the banks in terms of delivery of technology-assisted financial services. Secondly, dEA accommodates multi-outputs, which is ideal for studying banking efficiency. thirdly, dEA is suitable for analysis of small sample sizes, such as those of Australian banks. Given the existence of so few banks in Australia and the dearth of adequate data, together with restricted access to the data regime, an analysis of banking efficiency using the parametric approach might not be suitable.
this study adopts the input-oriented dEA for measuring the efficiency of Australian banks.1 to
present the formal model, consider a group of N banks transforming K inputs into M outputs. the dEA model for measuring technical efficiency (TE) of the i-th bank is expressed as
minq,λTE=q
s t. . –yi+Yλ≥0M qxi –Xλ≥0K
(1)
′ =
1Nλ 1
λ≥0
N
Where, q is a scalar value between 0 and 1,λ is a
(Nx1) vector of constraints, yi is (Mx1) vector of the output quantities, Y is (MxN) matrix of actual quantities of M outputs by N banks, xi is (Kx1) vector of input
quantities, X is (KxM) matrix of K inputs by N banks, 1N is (Nx1) vector of one, and 0M, 0K, and 0N are null vector of order M, K, and N, respectively.
It should be pointed out here that equation (1) assumes variable return to scale (VrS) by imposing the convexity constraint
(
1′ =1)
Nλ . Hence, this model takes into account scale of production when measuring efficiency. Furthermore, q in the equation represents the ‘contraction’ factor corresponding to the level of efficiency. thus, banks that are able to minimize the input–output combinations, relative to other banks, are considered fully efficient and are, thus, on the ‘best practice’ frontier with a value of q = 1. those banks that are less efficient are some distance from the frontier and the q-values of these banks will be less than one. the distance from the frontier is used as a basic gauge for measuring the bank’s inefficiency.
If the prices of inputs are available, the ‘overall’ or economic efficiency of the i-th bank can be calculated first by solving the following minimum cost linear program:
minλ,yiC=w xi′ i∗
s t. . –yi+Yλ≥0M
x X
i K
∗ ≥
– λ 0 (2)
′ =
1N
λ
1λ≥0
t h e r o l e o f g o v e r n a n c e , i c t a n d b a d l o a n s i n a u s t r a l i a n b a n k e f f i c i e n c y
where wi is a (Kx1) vector of input prices for the i-th bank, xi* is a (Kx1) vector of the optimal quantities of inputs for the i-th bank, and other variables are defined as in the previous equation. Equation (2) provides the minimum cost efficient solution for the i-th bank, and the overall efficiency (OE) is calculated as the ratio of the minimum cost solution
( )
wi′xi∗ to the actual cost incurred in production(
w′x)
i i ; that is:
OE w x w x
i i i i
= ′ ∗ ′
(3)
Allocative efficiency (AE) is then residually derived by dividing overall efficiency by technical efficiency; that is:
AE=OE TE (4)
the scale efficiency can be measured by dividing the technical efficiency under the assumption of constant return to scale (crS), which can be measured from equation (1) without the convexity constraint
′ =
(
1Nλ 1)
, by the technical efficiency under the variable return to scale (VrS).In order to separate technological change from efficiency change, this study calculates the dEA-based Malmquist productivity index (MPI). the input-oriented MPI of period t+1 relative to period t (the base period) can be expressed as:
MPI x y x y
D x y
O t t i t i t i t i t O t i t i t , , , , , + + + + +
(
)
=(
1 1 1
1 1 1
))
(
)
×(
)
+ + + + 1 1 11 1 1
1 D x y
D x y
D x y
O t i t i t O t i t i t O t i t i , , , tt
(
)
1 2 (5)where MPIO x y x y
t t i t i t i t i t , , , ,
+1
(
+1 +1)
is an MPI for two consecutive periods t and t+1; DOt
(
xit+1,yit+1)
represents a distance function that compares the i-th bank at the periodt+1 to the technology at period t; DOt x y i t
i t
,
(
)
is a distancefunction for the i-th bank to period t technology;
DOt x y
i t
i t +1
(
+1 +1)
, denotes a distance function for the i-th bank
to the t+1 period technology; and DOt+1
(
x yit, it)
is a distance function that compares the i-th bank at time t to period t+1 technology. the distance function DOt(
x yit, it)
is equivalent to the optimized q in equation (1), which represents technical efficiency. Hence, the distance function represents the proportion by which the input vector of the i-th bank should be contracted to be fully efficient under period t technology.Equation (5) can be expressed equivalently as:
MPI x y x y
D x O t t i t i t i t i t O t i t , , , , , + + + + +
(
)
=1 1 1
1 1
1 yy
D x y
D x y
i t O t i t i t O t i t i t + +
(
)
(
)
× 1 1 1 1 , , ++ + + + +(
)
(
)
×(
)
11 1 1 1
1
1
D x y
D x y
D O t i t i t O t i t i t O t , , 1 1 1 2 x yi
t i t ,
(
)
(6)the term in the first bracket represents the change in the technical efficiency between two consecutive periods, t and t+1; and the term in the second bracket represents technological change between period t and period t+1. using equation (6), this study separates technical efficiency change from technological change. the dEAP2.1 computer program is used to solve both the dEA programs in equations (1) and (2) and the Malmquist productivity index of equation (6).2 using this dEAP2.1 we derive the indices of
technical efficiency (tE), allocative efficiency (AE), scale efficiency (SE), overall efficiency (oE), and the decomposition of the MPI into technical efficiency change (tEc) and technological change (tc).
European banks. drawing on the earlier theoretical and empirical studies discussed above, the following equation is specified. Additionally, this model provides a comparison of the results with those reported by the previous studies.
TE BL ICT CG
it=β0+β1 it+β2 it+β3 it+εit (7)
where BL stands for bad loans, ICT for expenditure on information and communications technology,
CG for corporate/bank governance and εit is
the disturbance error term with usual statistical properties.
dAtA SourcE And
MEASurEMEnt oF VArIABLES
data for this study are extracted from the annual reports of related banks.3 the data used is for nine Australian
banks. other than the major four banks, the following five regional retail banks are included in the study: Adelaide Bank, Bendigo Bank, Bank of Queensland, St.George Bank and Suncorp-Metway corporation. this study deals with the operations and activities of these banks over the period 1997–2007.
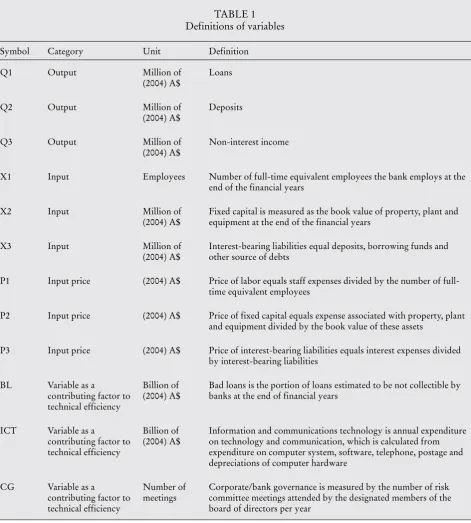
there are two sets of variables used in this study. the first set consists of inputs and outputs for measuring the efficiency of banks. the second set is related to the determinants of efficiency. definitions of each variable are given in table 1 (opposite). In order to specify the input and output variables, this study adopts a value-added approach.4 the output variables
are loans, deposits and non-interest income, which are measured at million of (2004) Australian dollar; while the input variables are labor, capital, and interest-bearing liabilities.
While labor refers to total full-time employees at the end of the financial year, capital is calculated
from the book value of property, plant and equipment at the end of the financial year and they are deflated to constant price of 2004. As the dEA requires input price variables, the study defines these variables as follows: the input price of labor is calculated from the expenses on staff divided by the number of full-time employees; the price of capital is measured from the ratio between expenses on fixed capital (property, plant and equipment) and the book values of these assets; and the price of interest-bearing liabilities equals the ratio of interest expenses over interest-bearing liabilities. the three variables chosen as the determinants of technical efficiency are bad loans, Ict and bank/ corporate governance. these three variables have never been included in previous studies on Australian banking efficiency. the last two variables (i.e. Ict and good governance) have considerable influence on bank efficiency (Williams & nguyen 2005). due to the absence of the direct measurement of Ict, expenditures on computer systems, software, telephone, postal, and depreciations of computer hardware are used as proxy. the number of risk committee meetings attended by the bank directors is used as the proxy for bank governance since data for other bank governance are not available.
t h e r o l e o f g o v e r n a n c e , i c t a n d b a d l o a n s i n a u s t r a l i a n b a n k e f f i c i e n c y
tABLE 1 definitions of variables
Symbol category unit definition
Q1 output Million of
(2004) A$
Loans
Q2 output Million of
(2004) A$
deposits
Q3 output Million of
(2004) A$
non-interest income
X1 Input Employees number of full-time equivalent employees the bank employs at the
end of the financial years
X2 Input Million of
(2004) A$
Fixed capital is measured as the book value of property, plant and equipment at the end of the financial years
X3 Input Million of
(2004) A$
Interest-bearing liabilities equal deposits, borrowing funds and other source of debts
P1 Input price (2004) A$ Price of labor equals staff expenses divided by the number of full-time equivalent employees
P2 Input price (2004) A$ Price of fixed capital equals expense associated with property, plant and equipment divided by the book value of these assets
P3 Input price (2004) A$ Price of interest-bearing liabilities equals interest expenses divided by interest-bearing liabilities
BL Variable as a
contributing factor to technical efficiency
Billion of (2004) A$
Bad loans is the portion of loans estimated to be not collectible by banks at the end of financial years
Ict Variable as a
contributing factor to technical efficiency
Billion of (2004) A$
Information and communications technology is annual expenditure on technology and communication, which is calculated from expenditure on computer system, software, telephone, postage and depreciations of computer hardware
cG Variable as a
contributing factor to technical efficiency
number of meetings
EStIMAtIon And AnALYSIS
oF rESuLtS
relative Efficiency of Australian
Banks
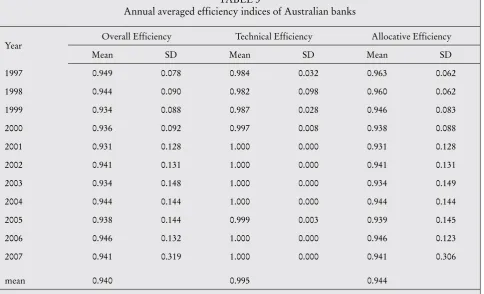
the annual average overall efficiency, technical efficiency and allocative efficiency indices are presented in table 3 (p. 30). these average efficiency indices are calculated from the efficiency indices of individual banks under a common frontier. thus, the technical efficiency indices of each bank is measured
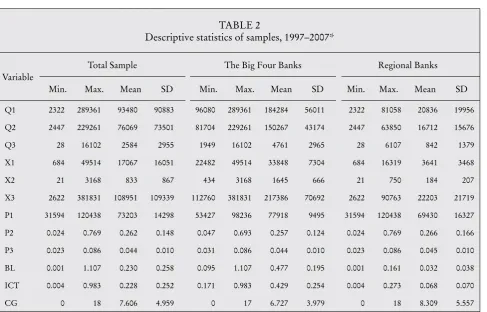
and related to the most efficient banks in the whole sample. From the efficiency indices in table 3, one might note that the overall efficiency of observed banks is mostly driven by technical efficiency. In other words, the inefficiency in Australian banks is mainly due to improper response to credit and interest risks (i.e. allocative efficiency) rather than managerial (i.e. technical efficiency) aspects. Given the input prices, the observed banks tend to choose the incorrect combination of inputs for producing outputs. Furthermore, the annual average technical efficiency index is equal to 1 since 2002, suggesting a full technical tABLE 2
descriptive statistics of samples, 1997–2007*
Variable
total Sample the Big Four Banks regional Banks
Min. Max. Mean Sd Min. Max. Mean Sd Min. Max. Mean Sd
Q1 2322 289361 93480 90883 96080 289361 184284 56011 2322 81058 20836 19956
Q2 2447 229261 76069 73501 81704 229261 150267 43174 2447 63850 16712 15676
Q3 28 16102 2584 2955 1949 16102 4761 2965 28 6107 842 1379
X1 684 49514 17067 16051 22482 49514 33848 7304 684 16319 3641 3468
X2 21 3168 833 867 434 3168 1645 666 21 750 184 207
X3 2622 381831 108951 109339 112760 381831 217386 70692 2622 90763 22203 21719
P1 31594 120438 73203 14298 53427 98236 77918 9495 31594 120438 69430 16327
P2 0.024 0.769 0.262 0.148 0.047 0.693 0.257 0.124 0.024 0.769 0.266 0.166
P3 0.023 0.086 0.044 0.010 0.031 0.086 0.044 0.010 0.023 0.086 0.045 0.010
BL 0.001 1.107 0.230 0.258 0.095 1.107 0.477 0.195 0.001 0.161 0.032 0.038
Ict 0.004 0.983 0.228 0.252 0.171 0.983 0.429 0.254 0.004 0.273 0.068 0.070
cG 0 18 7.606 4.959 0 17 6.727 3.979 0 18 8.309 5.557
* Figures denote million of (2004) A$; except for X1, which is measured in number of annual employees; and cG, which is measured in number of annual meetings attended by board members.
note: the table presents summary statistics of the variables used to construct the eficiency frontier and the determinants of bank eficiency.
t h e r o l e o f g o v e r n a n c e , i c t a n d b a d l o a n s i n a u s t r a l i a n b a n k e f f i c i e n c y
efficiency (i.e. 100%) of the observed banks under the defined input and output measurements.
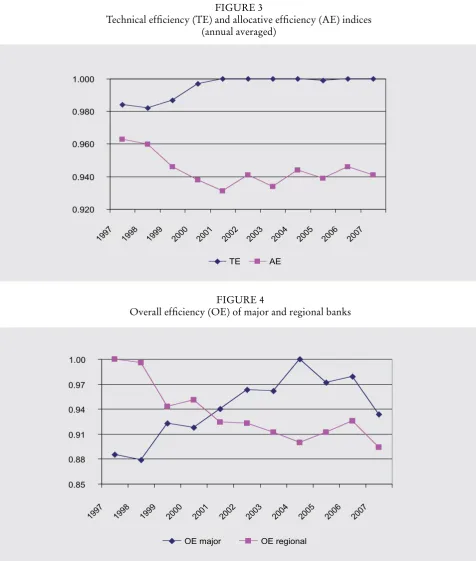
Figure 3 (p. 31) presents the contrasting trend between technical efficiency and allocative efficiency. It reveals that the technical efficiency of the observed banks has increased significantly since 1998. It reached full efficiency level in 2001. In contrast, the allocative efficiency index declined significantly between 1997 and 2001, although these indices showed a slight increase from 2001 onward. Interestingly, over the whole sample years, the technical efficiency indices dominate the allocative efficiency indices, suggesting that the overall efficiency of the observed banks is mostly driven by technical efficiency. these findings are consistent with those of Kirkwood and nahm (2006). these findings, however, are contrary to those provided by neal (2004) in the sense that allocative efficiency indices dominated technical efficiency indices between 1997 and 1999. Such differences may be attributed to differences in sample size and the input-output definitions. neal examines twenty-six banks including foreign banks while this study examines nine banks and excludes foreign banks. He has related labor to the number of branches while this study defines labor as the full-time employees. Furthermore, this study uses three outputs while he uses two outputs in the dEA modeling; and the results are bound to be varied because the dEA program’s outputs are sensitive to sample size and the input-output definitions.
In order to compare the efficiency of major banks (the Big Four) with that of the regional banks, this study calculates the annual average overall efficiency indices and presents the results in Figure 4 (p. 31). regional banks used to be more (overall) efficient than major banks till 2001. Figure 4 traces a steady increase in the overall efficiency indices of major banks during the sample years while the indices of regional banks decline in the same period.
this indicates that major banks are relatively more efficient than the regional banks. on the basis of their market size, the Big Four banks can behave in an oligopolistic manner; and, hence, the regional banks cannot compete with the market dominance of their counterparts in Australia.
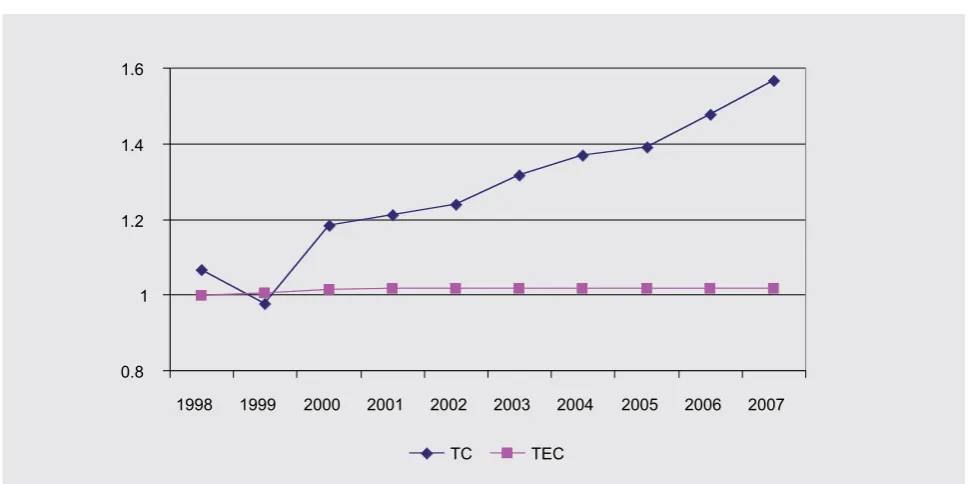
technical Efficiency change and
technological change
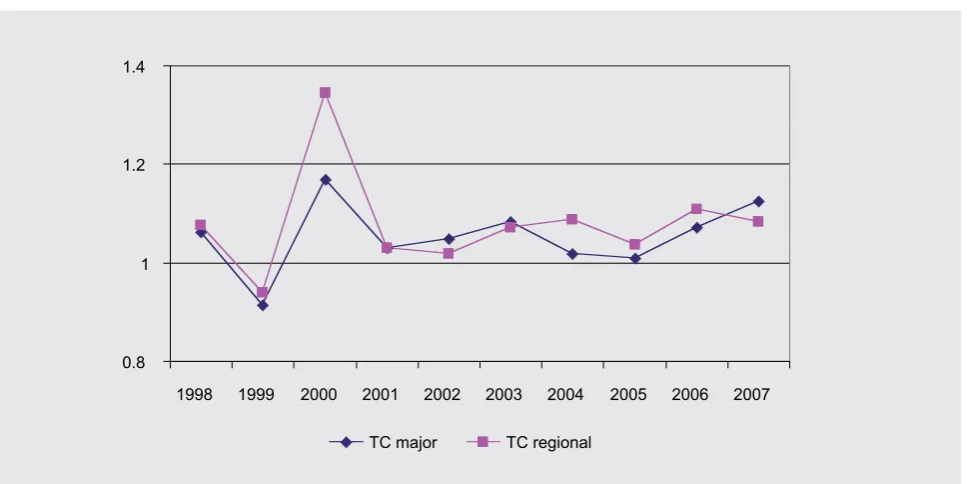
this section presents the result of the Malmquist productivity index (MPI), which separates technical efficiency change from technological change. the cumulative changes in technical efficiency and technology over the sample years are shown in Figure 5 (p. 32). It does not show visible technical efficiency change though technology change is substantial, being the major source of total factor productivity (tFP) growth over the sample period. From 1998 to 2007 the cumulative growth of tFP was 58.2% of which 56.5% is contributed by technological change and only 1.7% contributed by technical efficiency change. this demonstrates that Australian banks experienced substantial technological progress between 1998 and 2007. A possible explanation for such development may be the persistent use of new technology by the Australian banking sector, which was manifested in the form of AtMs, credit cards, the widespread installation of EFtPoS, and the introduction of debit and smart cards.
attributed this difference to the application of improved technology, such as internet banking, by the regional banks at a relatively faster rate than by the large banks in 1998.
the role of Bad-debts, Ict
and corporate Governance in
determining technical Efficiency of
Australian Banks
the above analysis has focused mainly on the measurement of relative efficiency in the Australian banking industry. Still the question remains unanswered: do certain factors affect bank efficiency
and is there any empirical evidence in this regard? As the past studies did not provide an answer, the present study has considered three exogenous variables: bad or non-performing loans, Ict and corporate/bank governance.
this study performs common effect (pooled-data), random effect and fixed effect models, respectively, on equation 7. to choose an appropriate model representing the data set, it employs a simple chow test and a Hausman test, as suggested by Baltagi (2008) and Greene (2008).5 the simple chow test is used to test
the appropriateness of the common effect model given the fixed effect model; and the Hausman test is used to compare the random and the fixed effect models. the tABLE 3
Annual averaged efficiency indices of Australian banks
Year overall Efficiency technical Efficiency Allocative Efficiency
Mean Sd Mean Sd Mean Sd
1997 0.949 0.078 0.984 0.032 0.963 0.062
1998 0.944 0.090 0.982 0.098 0.960 0.062
1999 0.934 0.088 0.987 0.028 0.946 0.083
2000 0.936 0.092 0.997 0.008 0.938 0.088
2001 0.931 0.128 1.000 0.000 0.931 0.128
2002 0.941 0.131 1.000 0.000 0.941 0.131
2003 0.934 0.148 1.000 0.000 0.934 0.149
2004 0.944 0.144 1.000 0.000 0.944 0.144
2005 0.938 0.144 0.999 0.003 0.939 0.145
2006 0.946 0.132 1.000 0.000 0.946 0.123
2007 0.941 0.319 1.000 0.000 0.941 0.306
mean 0.940 0.995 0.944
t h e r o l e o f g o v e r n a n c e , i c t a n d b a d l o a n s i n a u s t r a l i a n b a n k e f f i c i e n c y
0.920 0.940 0.960 0.980 1.000
1997 1998 1999 2000 2001 2002 2003 2004 2005 2006 2007
TE AE
FIGurE 3
technical eficiency (tE) and allocative eficiency (AE) indices (annual averaged)
0.85 0.88 0.91 0.94 0.97 1.00
1997 1998 1999 2000 2001 2002 2003 2004 2005 2006 2007
OE major OE regional FIGurE 4
result of the simple chow test suggests that the null hypothesis of the common effect cannot be rejected.6
Hence, the common effect model is appropriate in representing the data set. Furthermore, the result of the Hausman test suggests that the null hypothesis (of no-systematic differences in coefficients) cannot be rejected; and, therefore, the random effect is preferable to the fixed effect.7 Since the chow test of model specification
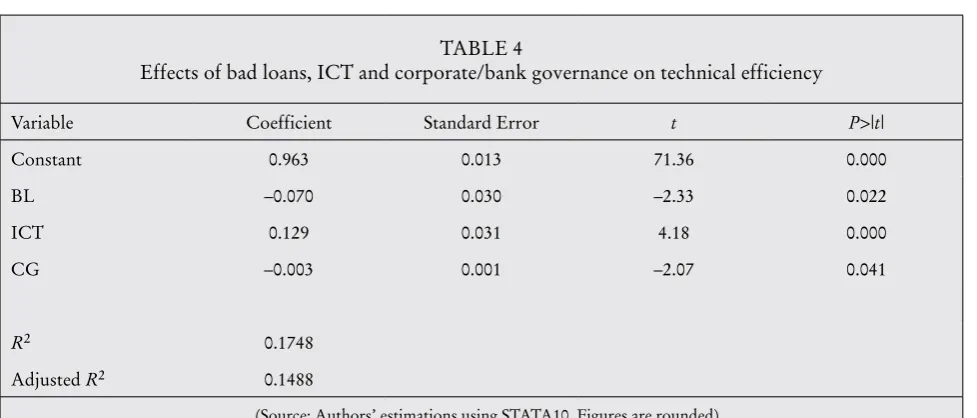
suggests that the common effect model is appropriate, the analysis in this study is conducted on the basis of the common effect model. the estimation results are presented in table 4 (opposite).
It appears that the coefficient of BL is negative and statistically significant at the 1% level, suggesting that an increase in bad loans is associated with a decrease in technical efficiency. this result supports Berg, Forsund and Jansen (1992), Hughes and Mester (1993), and Berger and de Young (1997) who find that
lack of adequate technological knowledge is related to the inefficiency of the loan managers. Furthermore, a positive and highly significant coefficient of Ict suggests that an increase in Ict expenditure leads to an increase in technical efficiency. this finding is not a surprise since the investment in Ict tends to improve the efficiency level of the bank for delivering increased volume of financial services. Perhaps the most striking finding is the negative and highly significant coefficient of cG (corporate/bank governance), which suggests that the more times the directors attend the risk committee meetings, the lower the technical efficiency. A possible explanation may be that the directors are not technologically literate, unlike their managers, or that they fail to keep pace with the technological advancement. As such, risk committee meetings attended by these directors fail to increase technical efficiency. In order FIGurE 5
cumulative technical eficiency change (tEc) and technological change (tc)
0.8 1 1.2 1.4 1.6
1998 1999 2000 2001 2002 2003 2004 2005 2006 2007
t h e r o l e o f g o v e r n a n c e , i c t a n d b a d l o a n s i n a u s t r a l i a n b a n k e f f i c i e n c y
to confirm the negative effect of corporate governance on technical efficiency, the authors also try ‘the number of meetings by the board members’ per year as an alternative proxy for corporate governance. the results are consistent with the above finding, but the coefficient is not statistically significant. Hence, it can be resolved that poor bank governance is related to a technologically inefficient board.
concLuSIonS
this paper attempts to study the relative efficiency of Australian banks over the period 1997–2007 by using linear programming–based data envelopment analysis (dEA) and the Malmquist productivity indices. It also examines the effects of bad loans, Ict and bank governance on technical efficiency. the empirical results show that technical efficiency constitutes the main source of overall efficiency in the observed Australian banks. over the sample period, technical efficiency dominates allocative efficiency. Most of the Australian banks are closer to their ‘best practice’ frontier. the results also show that the level of technical efficiency in
major banks is higher that that in the regional banks. the results from the Malmquist productivity index suggest that the growth of total factor productivity of Australian banks is attributed to technology-based delivery of financial service which is, again, due to their compliance and operational adjustment with technological change. Furthermore, analysis of the determinants of banking efficiency shows that an increase in bad loans is associated with the inadequate response of the loan managers to the technical changes. Bank governance has negative effects while Ict expenditure has positive and significant effects on the technical efficiency of Australian banks. Good governance of Australian banks is related to the quality of the members of the board which undoubtedly lifts the overall efficiency of banks.
* the authors gratefully acknowledge the partial funding from the centre for research in Applied Economics (crAE), curtin Business School, curtin university of technology, Perth, Australia. they are also grateful to the anonymous referee and journal’s copy editor for useful comments and suggestions which tremendously improved the quality and presentation of the paper. responsibility for all errors remaining is accepted by the authors.
tABLE 4
Effects of bad loans, Ict and corporate/bank governance on technical efficiency
Variable coefficient Standard Error t P>|t|
constant 0.963 0.013 71.36 0.000
BL –0.070 0.030 –2.33 0.022
Ict 0.129 0.031 4.18 0.000
cG –0.003 0.001 –2.07 0.041
R2 0.1748
Adjusted R2 0.1488
EndnotES
1. dEA can be generalized from either an input-oriented or output-oriented objective. For the input orientation, the objective is to obtain the minimum feasible input-combinations, given the outputs. under the output orientation, the objective is to achieve the maximum feasible output-combinations, given the inputs.
2. dEAP2.1 computer software is developed by coelli (1996) in the center for Productivity and Eficiency Analysis (cEPA), department of Econometrics, university of new England. this software is written in Shazam language and can be operated using an IBM personal computer. the instruction can be run by up-dating the available command ile or by writing a new instruction command. It is available from <www.uq.edu.au/economics/cepa/>.
3. the annual reports are provided online and can be accessed from the website of each bank.
4. As noted by Berger and Humphrey (1992) and Suian (2009), there are four commonly used approaches in deining inputs and outputs of banks, and there is no consensus among researchers
on which method is the best. under the production approach, a bank is deined as a service provider that produces outputs in forms of deposits and loans (measured by number of accounts) using inputs of physical resources (labor and capital). Similarly, the value-added approach also views deposits and loans as outputs and labor and capital as inputs, but the outputs are measured in values of dollar. under the intermediate approach, banks are assumed as inancial intermediaries between savers and borrowers; with loans and other assets treated as outputs, and deposits and other liabilities viewed as inputs. the user-cost
approach deines outputs and inputs based on the net effects of inancial products on bank revenue.
5. the detail procedures for the respective chow and Hausman tests are excellently discussed in Baltagi (2008) and Greene (2008).
6. the F-statistics for the chow test is –1.619 and the critical value at the 5% level is 3.633.
7. the Hausman statistics is 4.19 and the probability>chi2 equals 0.1788, suggesting that the null hypothesis cannot be rejected at the 5% level. Hence, there is no systematic difference in coeficients between random and ixed effect models.
FIGurE 6
technological change (tc) of major and regional banks
0.8 1 1.2 1.4
1998 1999 2000 2001 2002 2003 2004 2005 2006 2007
t h e r o l e o f g o v e r n a n c e , i c t a n d b a d l o a n s i n a u s t r a l i a n b a n k e f f i c i e n c y
rEFErEncES
Allen, L. & rai, A. 1996, ‘operational efficiency in banking: an international comparison’, Journal of Banking and Finance, 20(4): 655–72.
Aly, H.Y.G., Pasurka, r.c. & rangan, n. 1990, ‘technical, scale, and allocative efficiencies in uS banking: an empirical investigation’, Review of Economics and Statistics, 72(2): 211–18.
Avkiran, n.K. 1999, ‘the evidence on efficiency gains: the role of mergers and benefits to the public’, Journal of Banking and Finance, 23(7): 991–1013.
Avkiran, n.K. 2000, ‘rising productivity of Australian trading banks under deregulation 1986–1995’, Journal of Economics and Finance, 24(2): 122–40.
Baltagi, B. 2008, Econometric Analysis of Panel Data, 4th edn, Wiley, new York, toronto and Singapore.
Berg, S.A., Forsund, F.r. & Jansen, E.S. 1992, ‘Malmquist indices of productivity growth during the deregulation of norwegian banking, 1980–89’, Scandinavian Journal of Economics, 94(Supplement): S211–S228.
Berger, A.n., clarke, G.r.G., cull, r., Klapper, L. & udell, G.F. 2005, ‘corporate governance and bank performance: a joint analysis of the static, selection, and dynamic effects of domestic, foreign, and state ownership’, Journal of Banking and Finance, 29(8–9): 2179–221.
Berger, A.n. & de Young, r. 1997, ‘Problem loans and cost efficiency in commercial banks’, Journal of Banking and Finance, 21(6): 849–70.
Berger, A.n. & Humphrey, d.B. 1992, ‘Megamergers in banking and the use of cost efficiency as an antitrust defense’, Antitrust Bulletin, 37: 541–600.
Berger, A.n. & Humphrey, d.B. 1997, ‘Efficiency of financial institutions: international survey and directions for future research’, European Journal of Operational Research, 98(2): 175–212.
Berger, A.n. & Mester, L.J. 1997, ’Inside the black box: what explains differences in the efficiencies of financial institutions?’, Journal of Banking and Finance, 21(7): 895–947.
casu, B., Girardone, c. & Molineux, P. 2004, ‘Productivity change in European banking: a comparison of parametric and non-parametric approaches’, Journal of Banking and Finance, 28(10): 2521–540.
coelli, t. 1996, A guide to dEAP version 2.1: a data envelopment analysis (computer) program, cEPA working paper 96/08, department of Econometrics, university of new England, Armidale, nSW.
delis, M.d. & Papanikolaou, n.I. 2009, ‘determinants of bank efficiency: evidence from a semi parametric methodology’, Managerial Finance, 35(3): 260–75.
destefanis, S. & Sena, V. 2007, ‘Pattern of corporate governance and technical efficiency in Italian manufacturing’,
Managerial and Decision Economics, 28(1): 27–40.
dongili, P. & Zago, A. 2005, Bad loans and efficiency in Italian banks, Working paper series, no. 28 (Sept.), dipartimento di Scienze Economiche, università degli Studi di Verona, Italy.
Elyasiani, E. & Mehdian, S. 1995, ‘the comparative efficiency performance of small and large uS commercial banks in the pre- and post-regulation eras’, Applied Economics, 27(11): 1069–79.
Erber, G. & Madlener, r. 2008, Impact of Ict and human skills on the European financial intermediation sector, Fcn working paper no. 5/2008, <http:// www.eonerc.rwth-aachen.de/global/show_document. asp?id=aaaaaaaaaabrxgo>, viewed 25 Mar. 2009.
Greene, W. 2008, Econometric Analysis, 6th edn, Pearson, new York.
Grifell-tatje, E. & Lovell, c.A.K. 1997, ‘the sources of productivity change in Spanish banking’, European Journal of Operational Research, 98(2): 364–80.
Gup, B.E. 2007, Corporate Governance in Banking: A Global Perspective, Edward Elgar, uK.
Hassan, M.K., Al-Sharkas, A. & Samad, A. 2007, ‘An empirical study of relative efficiency of the banking industry in Bahrain’, Studies in Economics and Finance, 22(2): 40–69.
82(258): 253–67.
Kwan, S.H. & Eisenbeis, r.A. 1996, ‘An analysis of inefficiency in banking: a stochastic cost frontier approach’, FRBFS Economic Review, 2: 16–26.
Matthews, K., Guo, J. & Zhang, A. 2007, non-performing loans and productivity in chinese banks: 1997–2006, cardiff economics working papers series, E2007/30.
neal, P. 2004, ‘X-efficiency and productivity change in Australian banking’, Australian Economic Papers, 43(2): 174–91.
Pi, L. & timme, S.G. 1993, ‘corporate control and bank efficiency’, Journal of Banking and Finance, 17(2–3): 515–30.
resti, A. 1996, ‘Linear programming and econometric methods for bank efficiency evaluation: an empirical comparison based on a panel of Italian banks’, in
Modelling Techniques for Financial Markets and Bank Management, eds M. Bertocchi, E. cavall & S. Komlosi, Physica-Verlag, Heidelberg, Germany.
Sathye, M. 2001, ‘X-efficiency in Australian banking: an empirical investigation’, Journal of Banking and Finance, 25(3): 613–30.
Sathye, M. 2002, ‘Measuring productivity changes in Australian banking: an application of Malmquist indices’,
Managerial Finance, 28(9): 48–59.
Sufian, F. 2009, ‘determinants of bank efficiency during unstable macroeconomic environment: empirical evidence from Malaysia’, Research in International Business and Finance, 23(1): 54–77.
Suhaimi, r. 2005, cost efficiency and K-economy of commercial banks in Malaysia, universiti teknologi MArA working paper, Sarawak, <http://www. melbournecentre.com.au/Finsia_McFS/2007/rosita_ costeff_and_k-economy.pdf>, viewed 25 Mar 2009.
Walker, G. 1998, ‘Economies of scale in Australian banks, 1978–1990’, Australian Economic Papers, 37(1): 71–87.
performance and bank governance in South East Asia’,
Journal of Banking and Finance, 29(8–9): 2119–54.