UAV-BASED PHOTOGRAMMETRIC POINT CLOUDS AND HYPERSPECTRAL
IMAGING FOR MAPPING BIODIVERSITY INDICATORS IN BOREAL FORESTS
N. Saarinen a,g *, M. Vastaranta a,g, R. Näsi b, T. Rosnell b, T. Hakala b, E. Honkavaara b, M.A. Wulder c, V. Luoma a,g, A. M. G.Tommaselli d, N. N. Imai d, E. A. W. Ribeiro e, R. B. Guimarães f, M. Holopainen a,g, J. Hyyppä b,g
a Dept. of Forest Sciences, University of Helsinki, P.O. Box 27, 00014 University of Helsinki, Finland -
b Dept. of Remote Sensing and Photogrammetry, Finnish Geospatial Research Institute FGI, National Land Survey, Geodeetinrinne
2, 04310 Masala, Finland - [email protected]
c Pacific Forestry Centre, National Resources Canada, 506 West Burnside Road, Victoria, British Columbia, V8Z 1M5, Canada -
d Dept. of Cartography, São Paulo State University, Roberto Simonsen 305, 19060-900 Presidente Prudente, Brazil -
(tomaseli, nnimai)@fct.unesp.br
e Catarinense Federal Institute, Rodovia Duque de Caxias - km 6 - s/n, 89240-000 São Francisco do Sul, Brazil -
f Dept. of Geography, São Paulo State University, Roberto Simonsen 305, 19060-900 Presidente Prudente, Brazil [email protected] g Centre of Excellence in Laser Scanning Research, Finnish Geospatial Research Institute FGI, National Land Survey of Finland,
04310 Masala, Finland
Commission ΙΙI, WG III/4
KEY WORDS: Spectral Imaging, Remote Sensing, Forest Ecology, Forest Mensuration, Forest Inventory, UAS, Photogrammetry
ABSTRACT:
Biodiversity is commonly referred to as species diversity but in forest ecosystems variability in structural and functional characteristics can also be treated as measures of biodiversity. Small unmanned aerial vehicles (UAVs) provide a means for characterizing forest ecosystem with high spatial resolution, permitting measuring physical characteristics of a forest ecosystem from a viewpoint of biodiversity. The objective of this study is to examine the applicability of photogrammetric point clouds and hyperspectral imaging acquired with a small UAV helicopter in mapping biodiversity indicators, such as structural complexity as well as the amount of deciduous and dead trees at plot level in southern boreal forests. Standard deviation of tree heights within a sample plot, used as a proxy for structural complexity, was the most accurately derived biodiversity indicator resulting in a mean error of 0.5 m, with a standard deviation of 0.9 m. The volume predictions for deciduous and dead trees were underestimated by 32.4 m3/ha and 1.7 m3/ha, respectively, with standard deviation of 50.2 m3/ha for deciduous and 3.2 m3/ha for dead trees. The spectral features describing brightness (i.e. higher reflectance values) were prevailing in feature selection but several wavelengths were represented. Thus, it can be concluded that structural complexity can be predicted reliably but at the same time can be expected to be underestimated with photogrammetric point clouds obtained with a small UAV. Additionally, plot-level volume of dead trees can be predicted with small mean error whereas identifying deciduous species was more challenging at plot level.
* Corresponding author
1. INTRODUCTION
Monitoring biodiversity is increasingly important in sustainable use of forest resources. Species diversity is frequently applied approach for describing biodiversity (e.g. Gaston 2000, Huston 1994, Kimmins 1997, Rosenzweig 1995). Additionally, forest structural and functional variety can also be used for characterizing biodiversity. In forest environments, several descriptive structural attributes of forests can be available upon for assessing biodiversity, including tree size variability, canopy cover, as well as amount of dead wood and deciduous trees (Esseen et al. 1997, Kuuluvainen 2002, Kuusinen 1994, Kuusinen 1996, Siitonen 2001, Willson 1974).
Remote sensing provides a means for measuring and mapping of these structural attributes. Small unmanned aerial vehicles (UAVs) have been used increasingly as a data collection option to support forest sciences and applications (Goodbody et al. 2017, Pajares 2015, Torresan et al., 2017). The use of UAVs
has enabled the on-demand collection of high spatial resolution imagery, serving to improve the resolution of photogrammetric point clouds, and therefore offer improved characterization of forest structure. UAV-based photogrammetric point clouds and hyperspectral imagery provide information from forest structure (de Oliveira et al. 2016, Puliti et al. 2015) and can be considered complementary to traditional field plot measurements. Although field measurements are still required, UAV offer detailed and geolocated information on forest structural and functional conditions that can be employed as reference for larger area estimates represented by satellite imagery, for example.
et al. 2016). In addition, UAV-based hyperspectral imagery has been utilized in identifying individual tree species (Nevalainen et al. 2017) as well as damaged and dead trees (Näsi et al. 2015).
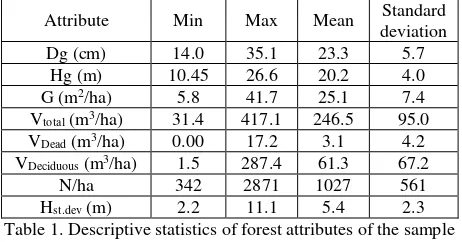
The aim of this study is to investigate the ability of UAV-based photogrammetric point clouds and hyperspectral imagery in mapping biodiversity indicators for southern boreal forest conditions as a means for enhancing the traditional field measurements. The biodiversity indicators considered in the study included structural complexity as well as the amount of forests with an average stand size of slightly less than 1 ha. The main tree species in the area are Scots pine (Pinus sylvestris L.), Norway spruce (Picea abies (L.) Karst) as well as silver and individual trees. Plot-level proxy for the biodiversity indicator of the structural complexity was calculated as a variation in field-measured tree heights (Hst.dev). Furthermore, stem volume of deciduous and dead trees was aggregated from individual Table 1. Descriptive statistics of forest attributes of the sample
plots. Dg = basal-area weighted mean dbh, Hg = basal-area weighted mean height, G = basal area, V = stem volume, and Hst.dev = Standard deviation of field measured tree heights on
plot level
2.2 Data acquisition and pre-processing of UAV data
The UAV data were acquired during July of 2014. A tunable Fabry-Pérot interferometer (FPI) based multispectral camera manufactured by Senop Ltd. operating in the visible to near-infrared spectral range (i.e. between 500 nm and 900 nm) was used in the study to hyperspectral imagery with 22 spectral bands. In addition, a Samsung NX300 RGB camera was employed for obtaining high spatial resolution data. The two cameras were mounted on a small, single-rotor UAV helicopter based on Mikado Logo 600 mechanics with a 5-kg payload capacity enabling simultaneous hyperspectral data collection
with high spatial resolution imagery required for creating a detailed photogrammetric point cloud. A preprogrammed flight path was flown autonomously using an autopilot DJI ACE Waypoint. The flying altitude was 400 m, which resulted in a ground sampling distance of 0.25 m for FPI imaging and 0.10 m for RGB imagery. The data sets were processed using a photogrammetric workstation, to provide image orientations and finally the final outputs of photogrammetric point clouds with 3-dimensional (3D) information. Reflectance reference panels were utilized to carry out transformation of digital numbers to reflectance factors. The methods of Honkavaara et al. (2013) were followed to radiometrically process and provide spectral information and calibrated reflectance factors resulting in reflectance mosaics from the FPI imaging. Finally, the reflectance values from these mosaics were combined to the 3D point clouds, in other words each point included the 3D coordinates as well as reflectance values for the 22 spectral bands used in the study.
2.3 Methodology
A digital surface model (DSM) with a resolution of 0.3 m was created from the photogrammetric point clouds for detecting individual tree crowns. The tree-crown delineation was carried out by using a watershed segmentation approach. Photogrammetric point clouds were normalized with the national digital terrain model (DTM) with a horizontal resolution of 2 m (NLS 2017). Metrics describing forest structure (i.e. 3D metrics) for each segment were generated from these normalized point clouds. The generated metrics included maximum height (Hmax), mean height defined as the arithmetic mean of heights (Hmean), standard deviation of heights (Hstd) as well as the coefficient of variation of heights (Hcv). Furthermore, quantiles for every 10% representing the height of certain percentage of points (i.e. height percentiles) were calculated between 10% and 90% (HP10-HP90). Similarly, spectral features were generated for each segment by using the reflectance values of points within a segment. The spectral features included arithmetic mean spectra (Smean) and median spectra (Smedian) as well as percentiles between 10% and 100% (SP10-SP100), depicting brightness of points within a segment, for each of the 22 spectral bands.
spectral bands were calculated for each tree species when only live trees were considered and separately for dead trees.
The validation of the UAV-based mapping of the biodiversity indicators was assessed based the mean error (ME) when compared to the field reference. The ME was calculated by subtracting a biodiversity indicator predicted with the UAV data from the indicator observed in the field. The absolute value for ME was divided by the mean of each field-observed biodiversity indicator to obtain the relative value. In addition, the effect of structural complexity as well as the amount of deciduous and dead trees in a sample plot on the ME was analysed.
3. RESULTS
3.1 Feature selection
All of the high height percentiles (i.e. HP80-HP90) and Hmax had a Pearson’s correlation coefficients higher than 0.9 when relationship with field-measured height and dbh was assessed. They were, however, also highly correlated (r > 0.90) with each other. Hmax was within the best metrics in each random forest iteration and thus, only the Hmax was selected for the final modelling. The spectral features were included to the search of nearest neighbour for improving tree species and health status estimation. All spectral features with the scaled importance higher than 2.5 were correlated (r > 0.7) with each other. Therefore, the spectral features with the lowest Pearson’s correlation coefficient, namely SP90 for the bands 688, 719, and 900 as well as Smean for the band 504, were included in the final nearest-neighbour prediction model.
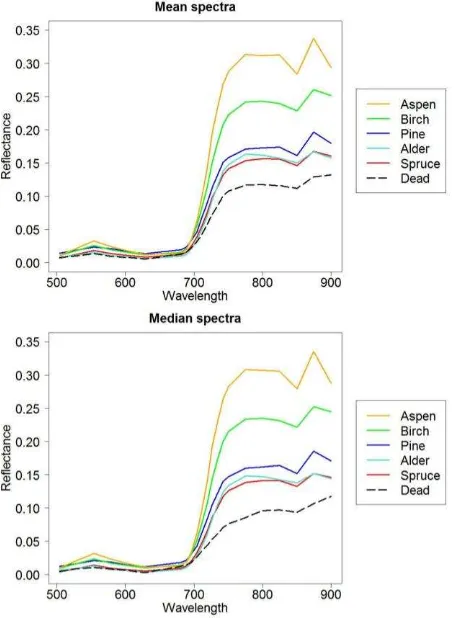
Figure 2. Mean and median spectra of various tree species (only live trees included) and dead trees
Visual inspection of the mean spectra revealed that the dead trees had visibly lower reflectance values, especially in the near-infrared part of the spectrum (Figure 2). Average difference between mean and median spectra of live trees was approximately 0.00 indicating relatively uniformly distributed species-specific spectral values without any noteworthy outliers. For dead trees, on the other hand, the difference between mean and median spectra varied from 0.01 to 0.02 for wavelengths from 719 to 775, corresponding on average 27.6% of the mean reflectance values, indicating more variability in reflectance values for especially the red-edge bands.
3.2 Accuracy of mapping the biodiversity indicators
The rate of identifying individual trees varied between 22.3% and 137.1%, with a mean of 64.3%. The underestimates were mainly caused by low detection rate of small trees under the dominant canopy layer. On the other hand, overestimates were present where the photogrammetric point clouds could not penetrate to ground level to define crown boundaries and marginal peaking in the DSM resulted in commission error (i.e. identification of tree that is not there).
Structural complexity within a sample plot was the most accurately derived biodiversity indicator resulting in the ME of 0.5 m (8.7%). The ME for volume of deciduous trees varied from 11.1 m3/ha overestimates to 216.6 m3/ha underestimates (Table 3). Although, the volume of dead trees was notably smaller compared to deciduous trees (3.1 m3/ha and 61.3 m3/ha, respectively), and the mean absolute ME was not as substantial, the mean relative MEs were similar for both, in other words 52.4% for stem volume of deciduous and 54.6% for stem volume of dead trees.
Statistics Hst.dev, m
VOLdead, m3/ha
VOLdec, m3/ha
ME
Min -2.3 -2.6 -11.1
Max 2.5 10.9 216.6
Mean 0.5 1.7 32.4
Standard
deviation 0.9 3.2 50.2
Table 3. Accuracy of mapping biodiversity indicators. ME = mean error, Hst.dev = standard deviation of individual tree heights (used as a proxy for structural complexity), VOLdead = plot-level volume of dead trees, VOLdec = plot-level volume of
deciduous trees
When the effect of the amount of deciduous and dead trees was analysed, proportion of stem volume was used (i.e. VOL%dead and VOL%dec). Furthermore, the mean value based on field measurements of either Hst.dev (5.4 m), VOL%dead (1.4%), or VOL%dec (26.7%) at a time were used to divide the plots into two groups (i.e. plots with larger or smaller value than the mean). The structural complexity did not affect the accuracy of estimating either the VOLdead or VOLdec, in other words the difference between the mean relative MEs of the plots with Hst.dev larger or smaller than 5.4 m was not statistically significant (p = 0.77 and p = 0.42, respectively).
deciduous trees less than the average, the relative ME was
The suitability of UAV-based photogrammetric point clouds and hyperspectral imaging was investigated in mapping biodiversity indicators such as structural complexity and volume of deciduous and dead trees. It was possible to estimate structural complexity with a mean error of 0.5 m indicating ability of photogrammetric point clouds in describing biodiversity through height variation. Structural complexity affected on the accuracy of plot-level stem volume estimates of dead trees, implying better accuracy with smaller structural variation.
The accuracy of individual tree detection influences the estimated variability in tree height as suppressed trees are problematic to identify with photogrammetric point clouds because penetration through canopy is challenging (Vastaranta et al. 2013, White et al. 2013, Wallace et al. 2016). Thus, a plot-level mean height can be expected to be overestimated with photogrammetric point clouds, which was true also in this study. Furthermore, Hst.dev, utilized to describe structural complexity, was also underestimated. However, the mean error for Hst.dev of 0.5 m is similar or better compared to results of other studies using UAV-based photogrammetric point clouds in estimating tree height (Zarco-Tejada et al. 2014, Dandois et al. 2015, Zahawi et al. 2015, Wallace et al. 2016). Berveglieri et al. (2016) used photogrammetric point clouds to derive information from vertical structure of Brazilian semideciduous tropical forest and concluded that it was possible to classify successional stage with this information. Based on also our results, the accuracy of height variation could be used for estimating biodiversity when assessed with vertical structure of a forest. Wallace et al. (2016) estimated canopy cover and vertical canopy structure in a native eucalypt forest in Australia. They reported underestimates of 15% in point-cloud based canopy cover, but 0.61 m overestimates for tree height which could have been caused the use of DTM based on photogrammetric point cloud.
The reflectance values for each spectral band depend on illuminating conditions, therefore spectral features are not as stable as the 3D metrics between sample plots and data acquisitions (Nevalainen et al. 2017). Dandois et al. (2015) reported likewise of the effect of cloudy vs clear days on the canopy penetration of UAV-based photogrammetric point cloud which suggests that tree crown identification and tree detection can be affected by the illumination conditions. In addition, the accuracy of classifying tree species and health status (i.e. live or dead) influences the final results of mapping the biodiversity indicators such as volume of dead and deciduous trees. Although random forest provides a robust means for selecting features for final modelling, several wavelengths across the spectral range were represented in the selected spectral features used for the modelling. This is in line with the results presented by Näsi et al. (2015) and Nevalainen et al. (2017). Thus, it is challenging to specify the relationship between the physical characteristics of various tree species or health status and reflectance values of the 22 bands used here. However, smaller mean error was identified for plots where the proportion of
deciduous trees was less than the average. This indicates good reliability for plots where small amount of deciduous trees exist which is important as tree species variability increases overall biodiversity. Many of the trees identified as dead in the field did not have any or little crown and the health status dead also included snags. When segmenting DSM to identify individual trees, these may not have been detected as they might have been under the dominant canopy layer or crowns of adjacent trees.
Here we classified specific tree species for each identified tree crown which might have caused more uncertainty if simpler classification of conifer-deciduous would have been used. In addition, deciduous trees contribute in co-dominant canopy layer which decreases the classification accuracy if their crowns are not identified from a point cloud. Variation in detection accuracy based on canopy layers could explain relatively low estimates for volume of deciduous trees. Nevertheless, the study increases understanding how photogrammetric point clouds and hyperspectral imaging acquired with a small UAV can be used in mapping biodiversity indicators. And with the potential for temporal resolution, UAV can be utilized in producing these kinds of data sets in monitoring changes in forest conditions that can reveal a trend for development of biodiversity.
5. CONCLUSIONS
Photogrammetric point clouds generated from UAV was used to characterize structural complexity of southern boreal forests and it was possible to capture this biodiversity indicator with a level of reliability comparable to field measurements, indicating that UAV-based photogrammetric point clouds are suitable for mapping biodiversity when measured through structural variability. Hyperspectral imaging was employed in addition to 3D information from the point clouds, to estimate volume of dead and deciduous trees. Smaller mean errors were obtained for volume estimates for dead trees than for deciduous trees. The results did not vary between plots of different forest characteristics, although it was possible to estimate volume of deciduous trees more reliably when they were mixed in conifer-dominated forests.
Excellence in Laser Scanning Research (project number 272195). The authors would also like to thank Häme University of Applied Science for supporting our research activities at Evo study site, Senop Oy for providing us the FPI hyperspectral camera, and Dr Sakari Tuominen and Dr Ilkka Pölönen for their support during the UAV data capture flights. Senior researcher Paula Litkey is thanked for her support in generating the photogrammetric point clouds.
REFERENCES
Breiman, L., 2001. Random forest. Machine Learning, 45(1), pp. 5-32.
Dandois, J.P., Olano, M. & Ellis, E.C., 2015. Optimal altitude, overlap, and weather conditions for computer vision UAV estimated of forest structure. Remote Sens., 7, pp. 13895-13920.
Esseen, P.-A., Ehnström, B., Ericson, L. & Sjöberg, K., 1997. Boreal forests. Ecol. Bulletins, 46, pp. 16-47.
Gaston, K.J., 2000. Global patterns in biodiversity. Nature, 405, pp. 220–227.
Getzin, S., Nuske, R.S. & Wiegand, K., 2014. Using unmanned aerial vehicles (UAV) to quantify spatial gap patterns in forests. Remote Sens., 6, pp. 6988-7004.
Goodbody, T.R.H., Coops, N.C., Marshall, P.L., Tompalski, P., Crawford, P., 2017. Unmanned aerial systems for precision forest inventory purposes: A review and case study. For. Chron., 93(1), pp. 71-81.
Honkavaara, E., Saari, H., Kaivosoja, J., Pölönen, I., Hakala, T., Litkey, P., Mäkynen, J. & Pesonen, L., 2013. Processing and assessment of spectrometric, Stereoscopic imagery collected using a lightweight UAV spectral camera for precision agriculture. Remote Sens., 5, pp. 5006-5039.
Huston, M.A., 1994. Biological diversity. Cambridge University Press, Cambridge, pp. 1-2.
Inoue, T., Nagai, S., Yamashita, S., Fadaei, H., Ishii, R., Okabe, K., Taki, H., Honda, Y., Kajiwara, K. & Suzuki, R., 2014. Unmanned aerial survey of fallen trees in a deciduous broadleaved forest in eastern Japan. PLoS ONE, 9(10), pp. e109881.
Kimmins, J.P., 1997. Biodiversity and its relationship to ecosystem health & integrity. For. Chron., 73, pp. 229–232.
Kuuluvainen, T., 2002. Natural variability of forests as a reference for restoring and managing biological diversity in boreal Fennoscandia. Silva Fennica, 38(1), pp. 97-125.
Kuusinen, M., 1994. Epiphytic lichen flora and diversity on Populus tremula in old-growth and managed forests of southern and middle boreal Finland. Annales Botanici Fennici, 31, pp. 245-260.
Kuusinen, M., 1996. Epiphyte flora and diversity on basal trunks of six old-growth forest tree species in southern and middle boreal Finland. Lichenologist, 28, pp. 443-463.
Nevalainen, O., Honkavaara, E., Tuominen, S., Viljanen, N., Hakala, T., Yu, X., Hyyppä, J., Saari, H., Pölönen, I., Imai, N.N. & Tommaselli, A.M.G., 2017. Individual Tree Detection and Classification with UAV-based Photogrammetric Point Clouds and Hyperspectral Imaging. Remote Sens. 9, pp. 185.
NLS 2017. National Land Survey of Finland Open Data License.
http://www.maanmittauslaitos.fi/en/opendata/acquisition (31 May 2017).
Näsi, R., Honkavaara, E., Lyytikäinen-Saarenmaa, P., Blomqvist, M., Litkey, P., Hakala, T., Viljanen, N., Kantola, T., Tanhuanpää, T. & Holopainen, M., 2015. Using UAV-based
photogrammetry and hyperspectral imaging for mapping bark beetle damage at tree-level. Remote Sens., 7, 15467-15493.
de Oliveira, R.A., Tommaselli, A.M.G. & Honkavaara, E., 2016. Using hyperspectral frame images from unmanned airborne vehicle for detailed measurement of boreal forest 3D structure. In: IOP Conf. Series: Earth Environ. Sci., 44, 042029.
Pajares, G., 2015. Overview and current status of remote sensing applications based on Unmanned Aerial Vehicles (UAVs). Photogramm. Eng. Rem. S., 81(4), pp. 281-329.
Puliti, S., Ørka, H. O., Gobakken, T., & Næsset, E., 2015. Inventory of small forest areas using an unmanned aerial system. Remote Sens., 7(8), pp. 9632-9654.
Rosenzweig, M.L., 1995. Species Diversity in Space and Time. Cambridge University Press, Cambridge, pp. 1-7.
Siitonen, J., 2001. Forest management, coarse woody debris and saproxylic organisms. Ecol. Bulletins, 49, pp. 11-41.
Torresan, C., Berton, A., Carotenuto, F., Di Genaro, S.F., Gioli, B., Matese, A., Miglietta, F., Vagnoli, C., Zaldei, A. & Wallace, L., 2017. Forestry applications of UAVs in Europe: a review. Int. J. Remote Sens., 38, pp. 2427-2447.
Vastaranta, M., wulder, M.A., White, J.C., Pekkarinen, A., Tuominen, S., Ginzler, C., Kankare, V., Holopainen, M., Hyyppä, J. & Hyyppä, H., 2013. Airborne laser scanning and digital stereo imagery measures of forest structure: comparative results and implications to forest mapping and inventory update. Can. J. Remote Sens., 30(5), pp. 382-395.
Wallace, L., Lucieer, A., Malenovský, Z., Turner, D. & Vopěnka, P., 2016. Assessment of forest structure using two UAV techniques: A comparison of airborne laser scanning and structure from motion (SfM) point clouds. Forests, 7, pp. 62.
White, J.C., Wulder, M.A., Vastaranta, M., Coops, N.C., Pitt, D. & Woods, M., 2013. The Utility of Image-Based Point Clouds for Forest Inventory: A Comparison with Airborne Laser Scanning. Forests, 4, pp. 518-536.
Willson, M.F. 1974. Avian community organization and habitat structure. Ecol., 55, pp. 1017-1029.
Zahawi, R.A., Dandois, J.P., Holl K.D., Nadwodny, D., Reid, J.L. & Ellis, E.C., 2015. Using lightweight unmanned aerial vehicles to monitor tropical forest recovery. Biol. Conservation, 186, pp. 287-295.