Kadin Indonesia-Jetro, 2006 1 www.kadin-indonesia.or.id DEVELOPMENT OF SMALL-AND MEDIUM-SCALE INDUSTRY CLUSTERS IN INDONESIA
TULUS TAMBUNAN Kadin Indonesia-Jetro 2006
INTRODUCTION
Small and medium enterprises (SMEs)1 in manufacturing industry (called small-and medium-scale industries or SMIs) in Indonesia are very important for several reasons, such as their potential to create employment and to generate foreign currencies through export. These industries are also important as domestic producers of cheap import substitution consumer goods especially for low-income groups, and as supporting industries producing components, tools, and spare parts for large-scale industries (LIs). Moreover, when the Asian economic crisis hit the country in 1997/1998, SMIs were found to have been weathering the crisis better than LIs, because their greater flexibility allowed them to adjust production processes during the crisis and also because they are less dependent on imports than their larger counterparts, although many had been hit hard too. Many argue that being less reliant on formal markets and formal credits, SMIs are able to respond more quickly and flexibly than LIs to sudden shocks (Berry et al. 2001).
It is therefore not a surprise that SMIs receive ample attention in Indonesia. In recent years, particular attention has been paid to SMI clusters that are frequently defined as agglomeration of small and medium firms operating in the same industry group or subsector in the same location.
The main aim of this paper is to discuss development of SMI clusters in Indonesia. This paper deals with two main questions. First, what are the critical success factors of development of SMI clusters? Second, to what extent have policies contributed to the dynamics of SMI clusters in the country? For this purpose, the framework of this paper is developed as follows. Section II discusses the basic concept of industry cluster. Section III explains main anticipated benefits of a cluster. Section IV discusses briefly main characteristics of SMIs in Indonesia. Section V deals with the development of SMIs and SMI clusters in Indonesia. Section VI deals with the main development constraints of SMIs. Section VII identifies main factors behind success stories and failures of SMI cluster development policies in Indonesia. Finally, conclusion and policy recommendations are given in Section VIII.
BASIC CONCEPT OF INDUSTRY CLUSTER
Kadin Indonesia-Jetro, 2006 2 www.kadin-indonesia.or.id producers of specialized inputs such as thread, buttons, zips, and even possibly chemical treatment as well. However, there are also many clusters less specialized and developed than this, for example a local agglomeration of small metal working enterprises producing a range of metal products and repair services for broadly the same markets, and having only competitive relations with each other (Tambunan 1997).
In its traditional form, clustering refers to the process in which geographically proximate producers, suppliers, buyers, and other actors develop and intensify collaboration with mutually beneficial effects. However, in its most advanced form, according to a widely accepted definition proposed by Porter (2000), a cluster is a geographically proximate group of interconnected enterprises and associated institutions in a particular field, linked by commonality and complementarity. Under this definition, a cluster may include suppliers of inputs, or extend downstream to regular buyers or exporters. It also includes government institutions, business associations, providers of business services, and agencies that support clustered enterprises in such fields as product development, production process improvement, technology, marketing information (for example, on new market and designs), vocational training, and so on.
ECONOMIC BENEFITS OF A CLUSTER
In the era of world trade liberalization and economic globalization, great demands are made on the ability of SMIs to improve their efficiency and productivity and to adapt to and be flexible as regards market, product, technology, management, and organization. As the era generates larger market opportunities, individual enterprises are often unable to capture these opportunities that require products with better quality and prices and good services after sale, larger production quantities, products homogeneous standards and regular supply. Many enterprises experience difficulties achieving economies of scale, and they also constitute a significant obstacle to internalizing functions such as training, market intelligence, logistics, and technology innovation, and can also prevent the achievement of a specialized and effective interfirm division of labor, all of which are at the very core of firm dynamism (ADB 2001).
to provide services. The services and facilities would be very costly for the providers if given to individual enterprises in dispersed locations (Tambunan 2000; Humprey and Schmitz 1995).2
Clustering creates external economies and joint actions and increase scope. In effect, individual enterprises in a cluster can gain collective efficiency. Close proximity facilitates the establishment by enterprises in the locality of industrial links without substantial transaction costs or difficulties. However, these economic advantages can only be achieved if the cluster has well-developed internal and external networks. Internal networks can be defined as business co-operations or links among enterprises inside the cluster, which can be in various forms, for example marketing, distribution, production, procurement of materials, and training for workers. External networks are business and other forms of relation between enterprises inside the cluster and actors outside the cluster such as LIs, suppliers of inputs, providers of business services, and son on (Ceglie and Dini 1999) (see figure).
An Illustration of Internal networks Inside and External Networks of a Cluster
Kadin Indonesia-Jetro, 2006 4 www.kadin-indonesia.or.id the cluster through subcontracting systems. Thus, in many cases, the vertical cooperation consists of both internal and external networks.
MAIN CHARACTERISTICS OF INDONESIAN SMIs
The importance of SMIs in Indonesia is because of their characteristics, which include the following ones
1) Their number is large and they are scattered widely throughout the rural area and therefore they have a special "local" significance for the rural economy in the country.
2) As being very labour-intensive, their growth has been included as an important element of policy to create employment and to generate income. This also explains the growing emphasis on the role of these industries in rural areas in the country. The agricultural sector has shown not to be able to absorb the increasing population in the rural areas. As a result, rural migration increased dramatically, causing high unemployment rates and its related socio-economic problems in big cities such as Jakarta, Surabaya and Medan. Therefore, non-farm activities in rural areas, especially rural industries being a potentially quite dynamic part of the rural economy have been looked at their potential to create rural employment, and in this respect, SMIs (as SMEs in other economic sectors) can play an important role.
3) Not only that the majority of SMIs in Indonesia are located in rural areas, they are also mainly agriculturally based activities. Therefore, government efforts to support them are also efforts, indirectly, to support their agricultural sector.
4) SMIs use technologies that are in a general sense more "appropriate" (as compared to modern technologies used by LIs) to factor proportions and local conditions in a developing country like Indonesia, i.e. quite a few raw materials being locally available and scarcity of capital, including human capital.
5) Many SMIs expanded significantly. Therefore, they are regarded enterprises having the “seedbed LIs” function.
6) Although in general people in rural areas are poor, evidence shows the ability of poor villagers to save a small amount of capital and invest it; they are willing to take risks by doing so. In this respect, SMIs provide thus a good starting point for the mobilization of both the villagers' talents as entrepreneurs and their capital; while, at the same time, rural SMIs can function as an important sector providing an avenue for the testing and development of entrepreneurial ability.
Kadin Indonesia-Jetro, 2006 5 www.kadin-indonesia.or.id rural areas there is a lack of banking system. Or, they use their wealth to buy lands, cars, motorcycles or houses and other unnecessary luxury consumption goods which is often considered by the villagers as a matter of prestige.
8) Although many goods produced by SMIs are also for the middle and high-income groups of population, it is generally evident that the primary market for SMIs' products is overwhelmingly simple consumer goods, such as clothing, furniture and other articles from wood, footwear, household items made from bamboo and rattan, and metal products. These goods cater to the needs of local low income consumers. SMIs are also important for securing the basic needs goods for this group of the population. However, there are also many SMIs engaged in the production of simple tools, equipments, and machines for the demands of small farmers and small producers in the industrial, trade, construction, and transport sectors.
9) As often stated in the literature, one advantage of SMIs is their flexibility, relative to their larger competitors. In Berry et al. (2001), there enterprises are construed as being especially important in industries that face rapidly changing market conditions, such as the sharp macroeconomic downturns that have bedeviled many countries in Southeast Asia, including Indonesia, over the past few years.3
DEVELOPMENT OF SMIs AND SMI CLUSTERS IN INDONESIA
On several social and economic grounds, SMEs are of overwhelming importance in Indonesia. Typically, they account for more than 90% of all firms outside the agricultural sector, and thus the biggest source of employment, providing livelihood for over 90% of the country’s workforce, especially women and the young. The majority of SMEs are scattered widely throughout the rural area. According to official data from the Ministry of Cooperative and Small and Medium Enterprises (Menegkop & UKM), small enterprises (SEs) in 1997 accounted for more than 39.7 million units, or constituted about 99.8% of the total number of enterprises, and increased to more than 40 million units in 2004. During the same period, the total number of medium enterprises (MEs) reached between slightly more than 60 thousand units in 1997 to about 63 thousand units in 2004. On the contrary, the total number of large enterprises (LEs) on average per year was around two thousand units for the whole period (Table 1).
Table 1. Total Units of Enterprises by Size Category: 1997-2004
Size Category 1997 1998 1999 2000 2001 2003 2004 ∑ SEs 39,704,661 36,761,689 37,804,536 38,985,072 40,137,773 42,475,756 43,158,468 ∑ MEs 60,449 51,889 51,798 55,061 57,743 59,580 63,361 ∑ LEs 2,097 1,831 1,832 1,946 2,095 2,169 2,248 Total 39,767,207 36,815,409 37,858,166 39,042,079 40,197,611 42,537,505 43,224,077 Source: Menegkop & UKM
Kadin Indonesia-Jetro, 2006 6 www.kadin-indonesia.or.id of total enterprises in the sector and slightly more than 22% of total SMEs during the period 2003-2004. The third important sector is manufacturing industry with around 6.4% of total SMEs. They are involved mainly in simple traditional manufacturing activities such as wood products, including furniture, textile, garments, leather products including footwear, and food and beverages. Only a very small proportion of SMIs are engaged in production of machineries, production tools and automotive components through subcontracting systems with several multinational automobile companies such as Toyota and Honda. BPS data in 2001 indicate that more than 90% of SMIs in Indonesia do not have such production linkages with LIs. This structure of industry reflects the current technological capability of Indonesian SMIs. They are not so strong yet as their counterparts in other countries such as South Korea, Japan, and Taiwan in producing sophisticated technology embodied products.
Table 2. Total Units of Enterprises by Size and Sector, 2003 and 2004
SMEs LEs Sector
2003 2004 2003 2004
Agriculture (1) 25,457,190 25,477,756 58 59
Mining (2) 203,711 144,834 72 51
Manufacturing industry (3) 2,711,522 2,743,858 710 719 Electricity, gas & clean air supply (4) 4,423 4,111 39 36
Construction (5) 132,346 162,359 157 192
Trade, hotel & restaurant (6) 9,071,331 9,845,682 434 471
Transport & communication (7) 2,488,161 2,551,727 146 150
Finance, rent & service (8) 33,169 37,185 292 328
Services (9) 2,433,483 2,254,317 261 242
Total 42,535,336 43,221,829 2,169 2,248
Source: Menegkop & UKM.
In terms of GDP, official data from the Central Bureau of Statistics (BPS) show that, on average, during the period 2000-2004, SME contributed more than 96% and almost 95% of total output in, respectively, trade, hotel and restaurant, and agriculture. In total GDP, SMEs performed relatively better than their larger counter part as they accounted for more than 50% of total GDP during that period. In manufacturing industry, however, the GDP contribution of SMIs is much lower than that of LIs (Table 3). The smaller GDP contribution of SMIs, while their number of units and labour employed are much larger than those of LIs, indicates that labour productivity in SMIs is much lower than that in LIs.4As can be seen in Table 4, although it varies by sub-sector, on average, the value added-labor ratio increases by size of enterprise with the lowest in household or micro industries (MIIs), the smallest size category of SMIs, and the highest in LIs.
Kadin Indonesia-Jetro, 2006 7 www.kadin-indonesia.or.id method of production. Without all these inputs, it is hard for these enterprises to achieve increasing return to scale in their production process.6
Table 3. Structure of GDP by size and sector: 2000-2004 (%)
Sector SEs MEs LEs Total
1 2 3 4 5 6 7 8 9 GDP GDP without oil & gas
85.74 6.73 15.14 0.52 43.88 75.60 36.69 16.80 35.59 40.55 46.22 9.09 2.96 12.98 6.80 22.57 20.81 26.64 46.47 7.16 15.22 17.19 5.17 90.30 71.89 92.68 33.55 3.59 36.67 36.73 57.25 44.24 36.60 100.0 100.0 100.0 100.0 100.0 100.0 100.0 100.0 100.0 100.0 100.0 Source: BPS
Table 4. Differences in Labor Productivity in Indonesian Manufacturing Industry by Size of Enterprise and Group of Industry, 2000 (average of value added per worker; in 000 rupiah)
ISIC MIIs SIs MIs LIs
31 32 33 34 35 36 37 38 39
Food, beverages & tobacco
Textiles, garments, leather & footwear Wood & wood products
Paper, printing & publications
Chemicals (incl. fertilizers) & rubber products Cement & non-metallic mineral products Basic iron & steel products
Transport means, machinery & its tools Other manufacturing 2,339 1,746 2,103 3,981 1,782 3,346 3,374 5,492 4,973 2,539 4,855 6,743 5,723 7,812 3,071 7,011 5,402 6,097 25,806 24,271 12,403 18,953 50,849 8,849 395,344 45,127 12,701 67,309 27,237 30,236 103,938 68,968 63,327 142,243 130,589 22,946 Note: MIIs = household/micro industries; SIs = small-scale industries; MIs = medium-scale industries; LIs = large scale industries Source: MoI (database).
In Indonesia, SMI clusters can be found in all provinces, and most of them are located in rural areas. The clusters were established naturally as traditional activities of local communities whose production of specific products have long been proceeding. Based on comparative advantages of the products they make, at least with respect to the abundance of local raw materials and workers who have special skills in making such products, many of these clusters have a large potential to grow. Take for example the clusters of batik producers that have long been existence in various districts in Java.
Kadin Indonesia-Jetro, 2006 8 www.kadin-indonesia.or.id and factories, modern hotels, new commercial banks, supermarkets, telephone and fax stalls, and European restaurants.7
The above evidence may suggest that clustering is indeed important for the development of SMIs as well as the region. However, some remarks should be made. Sato (2000), for example, saw little evidence of positive effects of clustering, as she found no interfirm specialization of work processes and no joint actions (which are important ingredient for a cluster to grow) among the enterprise inside the clusters studied. It is also hard to find SMIs in clusters in Indonesia that have production linkages through subcontracting systems with LIs (Supratikno 2002b).
According to their level of development, clusters in Indonesia can be classified into four types, each with its own characteristics (Sandee and ter Wingel 2002) as follows:
1) “Artisinal”: mainly micro enterprises (MIIs); low productivity and wage; stagnated (no market expansion, increased investment and production, improved production methods, and management, organization and production development; local market (low-income consumers) oriented; used primitive or obsolete tools and equipment; many producers are illiterate and passive in marketing (producers have no idea about their market); the role of middlemen/traders is dominant (producers are fully dependent on middlemen or trader for marketing); low degree of interfirm co-operation and specialization (no vertical cooperation among enterprises); no external networks with supporting organizations.
2. “Active”: used higher skilled workers and better technology; supplied national and export markets; active in marketing; the degree of internal as well as external networks is high.
3. “Dynamic”: trade networks overseas are extensive; internal heterogeneity within clusters in terms of size, technology, and served market is more pronounced; leading/pioneering firms played a decisive role.
4. “Advanced”: the degree of interfirm specialization and cooperation is high; business networks between enterprises with suppliers of raw materials, components, equipment and other inputs, providers of business services, traders, distributors, and banks are well developed; cooperation with local, regional, or even national government, as well as with specialized training and research institutions such as universities is good; many firms are export-oriented (mainly through trading houses or exporting companies).
Kadin Indonesia-Jetro, 2006 9 www.kadin-indonesia.or.id and successful penetration of domestic and export markets. Typical examples are such as roof tiles industry clusters, metal casting industry clusters, shuttle-cock industry clusters, shoe industry clusters and brass-handicraft industry clusters. In these clusters, some enterprises start to influence the development trajectory of the clusters, and some enterprises produce for export through middlemen or traders or trading houses from outside the clusters. Examples of the third type are textile weaving industry clusters in Majalaya and Pekalongan, furniture industry clusters in Jepara, wig and hair accessories industry clusters in Purbalingga, and handicraft clusters in Kasongan. One of the most striking features of this type may be the decisive role of leading/pioneering firms, usually larger and faster growing firms, to manage a large and differentiated set of relationships with firms and institutions within and outside clusters. Some leading firms have utilized cutting edge technologies in production. Examples are clove cigarette clusters in Kudus, tea-processing clusters in Slawi, and tourism clusters in Bali. In the case of clove cigarette clusters in Kudus, their products are able to outperform products from Philip Morris and BAT. Similarly, tea-processing cluster in Slawi, led by a big company named Sostro, has grown to become the market leader in the Indonesian soft drink market, leaving giant Coca Cola behind (Supratikno 2002a).
Interestingly, in some cases, such as in furniture clusters in Jepara and handicraft clusters in Kasongan, there are considerable direct investments made by foreign immigrants8Clusters of the fourth type are more developed and become more complex in structure than those in the third type. Schmitz and Nadvi (1999) provide some examples of advanced export-oriented clusters in developing countries including shoe manufacturing in Brazil, India, and Mexico; surgical instruments in Pakistan; garments in Peru; and furniture in Indonesia (Jepara).9
Moreover, advanced clusters often overlap and interlink with other clusters in the same region. Such cluster agglomerations, or often-called industrial districts (the Italian term), form the most complex form of clustering, where different sectors or subsectors mutually depend on and benefit from each other. Prominent examples of cluster agglomerations include north-central Italy (tourism, food industry, fashion industry, furniture industry, machinery industry), southern Germany (vehicle, electronics, machinery, and software industries) and Greater London (banking, insurance, software, publishing, film and music, tourism, fashion industry, advertising, business services). In Indonesia, one example of a cluster agglomeration is the Yogyakarta–Solo area (Central Java) with its tourism, furniture and interior decoration, metal processing, leather goods, and textile/clothing clusters, which all mutually benefit each other.
DEVELOPMENT CONSTRAINTS
Kadin Indonesia-Jetro, 2006 10 www.kadin-indonesia.or.id dominated by ‘artisinal’ clusters, where enterprises in these clusters are characterized by low productivity and very small in size or self-employment units with no hired workers or they use only family members as helpers. They produce inferior goods for local markets and no specialization among enterprises, and also subcontracting with LIs. .Many of these clusters have been in existence for a long time. So, they survive but they show no significant progress either in terms of product diversification, size upgrading, technological development or market expansion.
Less developed SMI clusters in Indonesia are closely related to various problems faced by enterprises in the clusters. It is generally stated in the literature that problems faced by SMIs in LDCs are linked to three groups of issues: infrastructure, institution, and economic issues. The infrastructure issues include poor and/or expensive infrastructure such as transport, storage facilities, water, electricity, and telecommunication, lack of working
premises, and poorly developed physical markets. The second issues include no access to formal training and,
as a result, lack of skills in particular as regards basic economic skills and managerial expertise, lack of formal
schooling sometimes even resulting in illiteracy, limited access to property rights, limited access to formal
finance and banking institutions, excessive government regulations in areas such as business startup, in
particular as regards cumbersome, time demanding and costly procedures for business registration, lack of
information on prices, viability of products, etc., and ewer market opportunities due for instance to
non-compliance to international standards. The latter issues include excessive registration and transaction costs of
starting or operating businesses, limited access to technology, lack of opportunities for bulk purchase of inputs,
lack of working capital: credit has to be obtained from informal sources such as friends or relatives or
non-banking financial agencies with unfavourable terms, and insufficient funds do not allow for further investments
(UN, 2001).
These obstacles are more or less interlinked and create vicious circles of bad performance or business
stagnation of SMIs in Laces. For instance, the main reason for lack of funds or skills is that SMIs, especially
SIs and MIIs cannot access resource institutions such as banks and other financing institutions, training and
education institutions, marketing and consultancy firms, etc. In fact, all these various obstacles create an overall
context that in itself constitutes a barrier of further development or business improvement to these enterprises
(Tambunan, 2006).
Kadin Indonesia-Jetro, 2006 11 www.kadin-indonesia.or.id Instead, they depend heavily on their trading partners for marketing of their products, either within the framework of local production networks and subcontracting relationships or orders from customers.
Table 5. Main Problems faced by SIs and MIIs in Manufacturing Industry, 2003
SIs MIIs Total SIs and MIIs
Have no problem
Have problem -Raw material -Marketing -Capital
-Transportation/Distribution -Energy
-Labor cost -Others
Total SIs & MIIs
46,485 (19.48)*
192,097 (80.52) 20,362 (10.60) 77,175 (40.18) 71,001 (39.96) 5,027 (2.62) 40,605 (2.4) 2,335 (1.22) 11,592 (6.04)
238,582 (100.00)
627,650 (25.21)
1,862,468 (74.79) 400,915 (21.53) 552,231 (29.65) 643,628 (34.56) 49,918 (2.68) 50,815 (2.73) 14,315 (0.77) 150,646 (8.09)
2,490,118 (100.00)
674,135 (24.71)
2,054,565 (75.29) 421,277 (20.50) 629,406 (30.63) 714,629 (34.78) 54,945 (2.67)
55,420 (2.7) 16,650 (0.81) 162,238 (7.90)
2,728,700 (100.00) Note: * = %
Source: BPS (SUSI 2003)
SUCCESS STORIES AND FAILURES OF SMI CLUSTER DEVELOPMENT POLICIES
In Indonesia, almost all known types of government intervention to support SMI clusters development have been tried at one time or another: various subsidized credit, human resource development trainings such as in production technique, general management, management quality systems ISO-9000, and entrepreneurship, provision of total quality control and technical assistances, internet facility, advisory extension workers, subsidized inputs, marketing and promotion facilitation, setting up of Cooperatives of Small-Scale Industries (KOPINKRA) in clusters, establishment of special small-scale industrial estates (LIK), partnership program, Small Business Consultancy Clinics (KKB), establishment of the Export Support Board of Indonesia (DPE), establishment of common service facilities (UPT) in clusters, and implementation an incubator system for promoting the development of new entrepreneurs. Several government departments such as the Ministry of Industry and Trade, and the Ministry of Cooperative and SME have taken the lead in SME development policies. These, as do other ministries, have regional offices for delivery of services.
Kadin Indonesia-Jetro, 2006 12 www.kadin-indonesia.or.id assistance program varied greatly based on the amount of funds, timeframe and geographical scope, and thus one program cannot be directly compared to another.
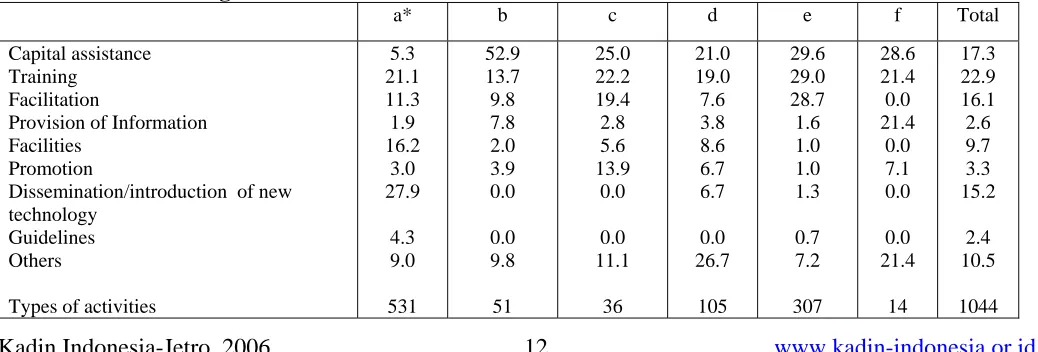
[image:12.612.41.542.358.507.2]The type of supports provided by these institutions varies ranging from capital assistance, trainings, facilitation e.g. for promotion activities and business meeting between producers and potential customers, information about potential market/buyers and suppliers, facilities e.g. for quality control and workshops, to guidelines about production process, management and standardization (Table 7). The number of activities within each program also varied but generally ranged from between one and three. Thus, of the 594 assistance programs there were 1,044 types of activities. In total, the most common types of activities were the provision of training (22.9%), capital assistance/credit (17.3%), facilitation (16.1%), and the dissemination/introduction of new technology (15.2%). Government institutions were (and are still) the most common institutions for the introduction or dissemination of new technologies. Trainings, including entrepreneurship, were (and are still) most commonly organized by NGOs, private companies, and government institutions, whereas other institutions mostly provided capital assistance; although private companies and NGOs were also very active in the provision of training. Facilitation was mainly provided by NGOs and government institutions (35.7%). For non-government institutions, capital assistance was the most important assistance.
Table 6: The number of institutions and assistance programs to strengthen SMIs, 1997-2003
Number of assistance programs
Still continuing Institutions Number of institutions
Total
Total % a) Government institutions
b) Banking institutions c) Private companies d) Donor agencies e) NGOs f) Others Total 13 7 10 8 20 6 64 388 31 12 46 109 8 594 127 25 12 15 79 8 266 32.7 80.7 100.0 32.6 72.5 100.0 44.8 Source: SMERU Research Institute.
Table 7: The proportion of assistance programs to strengthen SMIs based upon the type of activities and The executing institutions.
a* b c d e f Total
Capital assistance Training
Facilitation
Provision of Information Facilities
Promotion
Dissemination/introduction of new technology
Guidelines Others
Types of activities
[image:12.612.38.557.562.738.2]Kadin Indonesia-Jetro, 2006 13 www.kadin-indonesia.or.id
Note: * = see Table 6 Source: see Table 6.
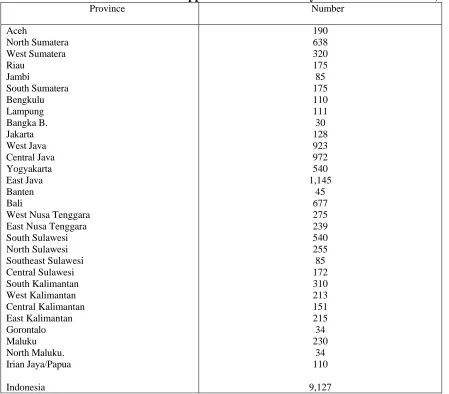
[image:13.612.72.521.286.680.2]Up to early 2000, the number of SMI clusters that had received support from the government totaled 9, 127 clusters (Table 8). However, not all of these clusters have shown good performance, despite government support. Many of the clusters in certain industries and provinces had stagnated during the crisis period (1998– 1999). To a certain extent, this different performance was related to different internal conditions (for example, the availability of technology, capital, skills, and raw materials) as well as external conditions (for example, market opportunities and government economic policies) faced by clusters in different industries and provinces. In some industries, output markets have been distorted by monopolistic or other cartel practices by big companies or by government policies such as export tax or regulations on import of raw materials in favor of big enterprises or foreign direct investment firms.
Table 8: Number of Government Supported SMI Clusters by Provinces in Indonesia, 2002
Province Number Aceh North Sumatera West Sumatera Riau Jambi South Sumatera Bengkulu Lampung Bangka B. Jakarta West Java Central Java Yogyakarta East Java Banten Bali
West Nusa Tenggara East Nusa Tenggara South Sulawesi North Sulawesi Southeast Sulawesi Central Sulawesi South Kalimantan West Kalimantan Central Kalimantan East Kalimantan Gorontalo Maluku North Maluku. Irian Jaya/Papua Indonesia 190 638 320 175 85 175 110 111 30 128 923 972 540 1,145 45 677 275 239 540 255 85 172 310 213 151 215 34 230 34 110 9,127
Kadin Indonesia-Jetro, 2006 14 www.kadin-indonesia.or.id In view of the complexity of cluster development processes and the wide range of instruments applied, it is hardly possible to determine policy contribution to successful cluster development in Indonesia. Nevertheless, in some cases public intervention is likely to have contributed to success stories such as the development of the wooden furniture cluster in Jepara (Central Java), which is among the largest clusters in the country. A comprehensive development package, including for example, technical upgrading through the provision of a common service facility, export training, and investment into improvement of the regional infrastructure (container facilities, roads, telephone), helped the cluster to gradually develop export markets. Similar effects were brought forward by creating a small industrial estate combined with a common service facility for wood processing, a joint showroom, and trade fair participation support in Sukoharjo, near Surabaya (East Java). The area is now a leading exporter of wooden, rattan, and metal furniture (Sandee et al, 2002)
There are, however, other factors that have significantly contributed to the aforementioned success stories: (1) strong local sector associations; (2) long exposure to foreign tastes brought forward by international tourism; (3) a considerable medium-scale direct investment by western immigrants married to Indonesians; and (4) a strong role of trading houses in brokering and organizing exports. In particular, exports seem to benefit from some trading houses’ traditional connections to China, which is one of the worlds’ largest markets for furniture.
But, in general, cluster development policies in Indonesia have not been successful. In essence, most failures can be attributed to the fact that one or more critical success factors for successful cluster development were either not existing or not addressed correctly. Neglecting existing and potential market linkages of clusters is one reason for the failure. Prerequisite for successful cluster development is the cluster’s potential to access growing markets. However, because of policy making that is too centralized and oriented on standardized instruments rather than on a diagnosis of each cluster’s specific potential, needs and constraints, the cluster’s existing and potential market linkage was often neglected in project design.
For example, in the mid-1990s a series of government programs for technical upgrading of a small-scale coconut oil cluster were implemented near Polmas in South Sulawesi. However, the town was in deep economic crisis: the small local port was losing more and more transit business to the larger ports of Pare Pare and Makassar. Almost exclusively oriented toward supplying local street stalls and restaurants, the cluster faced a strong decrease in demand. Accordingly, it hardly reacted to the government’s technical upgrading programs. Given the abundance of coconut in the area, a search for a medium-scale investor who would have opened up links to growing urban markets for example, in Makassar, Banjarmasin, or Surabaya, and developed links to smaller cluster enterprises would probably have been a more appropriate strategy.
Kadin Indonesia-Jetro, 2006 15 www.kadin-indonesia.or.id such as difficulties in marketing and distribution of SMIs in their areas. He concludes that, In view of the wide
definition of small industry employed by the Ministry, much of the promotion efforts may have bypassed the
smallest enterprises that are most in need of assistance……. The extension officers generally have little
technical or business experience, and training or other technical facilities have been largely provided
according to the directions of central planners, rather than having been adapted to local needs. (page 65).
Sandee (1994) also comes with similar conclusion from his own study on clusters of building materials industries in Central Java: In practice, direct assistance frequently concerns brief training sessions of one or
two days for a selected group of producers. Such sessions are characterized by a great deal of theory and little
attention paid to how to improve the actual running of the business of particular activities. (page 152).
Kadin Indonesia-Jetro, 2006 16 www.kadin-indonesia.or.id government meant that in most cases, there was not great enough flexibility in the system for responding to the changing needs of SMIs.
In overall, van Dierman (2004) comes to the following conclusions: (i) few of the SMI clusters development programs have had a lasting impact on improving SMIs; (ii) a significant number of macro-and micro-policies placed additional costs and burdens on SMIs’ compliance and has led to most operating outside of the formal economy; and (iii) macro-policies that created a favourable economic environment, as reflected by consistently high growth rates in GDP, and not biased in favor of LEs, provided the best stimulus for SMI cluster development. Moreover, he states clearly that if measured by the above criteria (i.e., market failure;
targeting the problem effectively; setting the right duration, scale and target group; being administratively
efficient for government; and not imposing excessive compliance burdens on firms) most of the above
programmes would score badly. There is no doubt that many SMEs have gained benefits under the
micro-policies……But the more relevant question is at what cost were the benefits gained? The cost of programmes
should be measured in terms of economy-wide loss in efficiency and the specific costs to other sectors of the
economy. (page 53).
This conclusion is also supported by earlier findings from Tambunan’s (1998) study of rattan industries in Padang (West Sumatra) and Tambunan and Keddie’s (1998) study of leather industries in Yogyakarta. Both findings show that one reason of government failure in supporting these clusters was lack of coordination between different government agencies; sometimes different agencies provide similar schemes/programs.
Limited support from local government or private organizations is another reason for the failure. Most local governments seem to be aware of specific constraints of clusters in their areas that are often related to insufficient transport, telecommunication, or electricity infra-structure. Anecdotic evidence suggests that local officials were prepared to flexibly extend support whenever possible, for example, by assisting producers in finding an appropriate location for sales staff on an inter-regional road, or by providing enterprises without terrestrial telephone connection with a hand phone on personal credit. However, lack of budget autonomy severely restricts local government’s abilities for appropriate and hands-on support in, for example, repairing defects in a trunk road connecting producers to the main road. Unfortunately, regional decentralization in Indonesia has so far stopped at the district level, and has not significantly enhanced autonomy and action potential of those territorial units that are closest to smaller clusters, namely the Kecamatan (district) and/or the
desa (village).
Kadin Indonesia-Jetro, 2006 17 www.kadin-indonesia.or.id located in isolated rural/backward regions that are far away from potential supporting private agencies such as banks and training institutes or universities.
Conclusion and Policy Recommendations
From the experience of the development of SMIs in Indonesia, it can be concluded that the market-based development of SMI clusters is more successful than the policy-driven. It appears from the existing empirical studies that the successful development of an SMI cluster depends on a number of critical factors, the most crucial of which are access to output market, internal organization and cooperation/joint actions among firms inside clusters, sustainability of the supply of raw materials and other necessary inputs, the existence of self-help organizations and common service facilities, the quality of local government support, and external networking with LIs, banks, and local providers of education, technology, and information.
From the point of view of government, then, it can be said that the sustainability of markets for output and inputs should be the first policy priority, rather than providing subsidies, special credit schemes, and tehnical upgrading programs. Therefore, to justify such policies, existing SMI clusters to be supported should be only those that have both the potential for increasing their output markets domestically or overseas and a secured supply of raw materials and other necessary inputs.
Further, for the clusters to develop and grow, such policies should be combined with a good business environment, which can be created by appropriate macroeconomic policies affecting trade, investment, monetary and fiscal policies, competition policy, wages and labour markets, education and technology, and agricultural, industrial, and other sectors. In other words, SMI development policies with a clustering approach should be fully supported by appropriate macroeconomic policies that prevent distortions in both input and output markets, including monopolistic or oligopolistic practices by LIs.
SMI development through clustering is about improving the economic performance of individual enterprises inside clusters by improving, enhancing, and exploiting internal co-operations/joint among them to gain collective efficiency and linkages to markets for output and inputs. The government’s main task should be to guide and coordinate actors, not only enterprises inside clusters but also local institutions outside the clusters that are important for the development of the clusters, such as banks, universities, government, trading companies, etc., in such a way that both internal co-operation and market linkages are effectively enhanced.
Kadin Indonesia-Jetro, 2006 18 www.kadin-indonesia.or.id weaker; that is, producers in the clusters become more passive instead of more active in taking initiatives in such areas as production improvement and market diversifications.
References
ADB (2001). “Best Practice in Developing Industry Clusters and Business Networks,” Asian Development Bank SME Development TA, Policy Paper No. 8. Jakarta: Kantor Menteri Negara Urusan Koperasi dan UKM.
Altenburg, T., and J. Meyer-Stamer (1999). “How to Promote Clusters: Policy Experiences from Latin America,” World Development, 27(9), 1213–1230.
Berry, Albert and Mazumdar, D. (1991), "Small-Scale Industry in the Asian-Pacific region", Asian-Pacific
Economic Literature, 5(2), 152-68
Berry, A., E. Rodriguez, and H. Sandee (2001). “Small and Medium Enterprise Dynamics in Indonesia,”
Bulletin of Indonesian Economic Studies, 37(3), 363–84.
Ceglie, G., and M. Dini (1999). “SME Cluster and Network Development in Developing Countries. The Experience of UNIDO,” UNIDO PSD Technical Working Papers Series, Geneva.
Glasmeier, A. (1990). “A Missing Link. The Relationship between Distribution and Industrial Complex Formation,” Entrepreneurship and Regional Development, 1(2), 315–333.
Humprey, J., and H. Schmitz (1995). “Principle for Promoting Clusters and Network of SMEs,” paper commissioned by Small and Medium Enterprise Branch, Institute of Development Studies, University of Sussex, Brighton.
Klapwijk, M. (1997). “Rural Industry Clusters in Central Java, Indonesia: An Empirical Assessment of their Role in Rural Industrialization,” Tinbergen Institute Research Series, Vrije Universiteit, Amsterdam.
Knorringa, P., and H. Weijland (1993). “Subcontracting – the Incorporation of Small Producers in Dynamic Industrial Networks,” in I. S. A. Baud, and G. A. Bruijne. (Eds) Gender, Small-scale Industry and Development
Policy. London: Intermediate Technology Publications.
Liedholm, Carl and Donald Mead (1999), Small Enterprises and Economic Development: The Dynamic Role of
Micro and Small Enterprises, Routledge, London.
Nadvi, K. (1995), “The Export Competitiveness of Small Producers: The Surgical Instruments Clusters of Sialkot, Pakistan,” mimeo, Institute of Development Studies, University of Sussex, Brighton.
Pedersen, P. O., A. Sverrisson, and M. P. van Dijk (Eds.) (1994). Flexible Specialization. The Dynamics of
Small-Scale Industries in the South. London: Intermediate Technology Publications.
Kadin Indonesia-Jetro, 2006 19 www.kadin-indonesia.or.id Porter , M.E. (2000). “Location, Competition and Economic Development: Local Clusters in a Global Economy,” Economic Development Quarterly, 14(1), 127-44
Pyke, F., and W. Sengenberger (Eds.)(1992). Industrial Districts and Local Economic Regeneration. Geneva: International Institute for Labour Studies.
Pyke, F., G. Becattini, and W. Sengenberger (Eds.) (1990). Industrial District and Inter-firm Co-operation in
Italy. Geneva: International Institute for Labour Studies.
Rabellotti, R. (1995a), “External Economies and Cooperation in Industrial Districts: A Comparison of Italy and Mexico,” Ph.D. dissertation, Institute of Development Studies, University of Sussex, Brighton.
Rabellotti, R. (1995b), “Public Support for Firm Networking in Baden-Wurttemberg,” in L. E. Andreasen (Ed.)
Europe’s Next Step – Organizational Innovation, Competition and Employment. London: Frank Cass.
Rice, R. and I. Abdullah (2000), “A Comparison of Small and Medium/Large Indonesian Manufacturing Enterprises from 1986 and 1996 by Sector”, mimeo, Partnership for Economic Growth Project, USAID, Jakarta
Richard, F. (1996), “Principal for Promoting Clusters and Networking of SMEs,” paper presented at the IX International Conference on Small and Medium Enterprises, WASME, New Delhi, April 17–19.
Sandee, H. (1994). “The Impact of Technological Change on Interfirm Linkages. A Case Study of Clustered Rural Small-Scale Roof Tile Enterprises in Central Java,” in P.O. Pedersen, A. Sverrison, and M.P. van Dijk (Eds.), Flexible Specialization. The Dynamics of Small-Scale Industries in the South. London: Intermediate Technology Publications.
Sandee, H. (1995). “Innovation Adoption in Rural Industry: Technological Change in Roof Tile Clusters in Central Java, Indonesia,” Unpublished Ph.D. dissertation, Vrije Universiteit, Amsterdam.
Sandee, H (1996). “Small-Scale and Cottage Industry Clusters in Central Java: Characteristics, Research Issues, and Policy Options,” paper presented at the International Seminar on Small Scale and Micro Enterprises in Economic Development. Anticipating Globalization and Free Trade, Satya Wacana Christian University, Salatiga, November 4–5.
Sandee, H., and S. C. van Hulsen (2000), “Business Development Services for Small and Cottage Industry Clusters in Indonesia: A Review of Case Studies from Central Java,” paper presented at International Conference “Business Services for Small Enterprises in Asia: Developing Markets and Measuring Performance,” Hanoi, April 3–6.
Sandee, H., and J. ter Wingel (2002), “SME Cluster Development Strategies in Indonesia: What Can We Learn from Successful Clusters?” paper presented for JICA Workshop on Strengthening Capacity of SME Clusters in Indonesia, Jakarta, March 5–6.
Sandee, H., B. Isdijoso, and S. Sulandjari (2002). SME Clusters in Indonesia: An Analysis of Growth Dynamics
and Employment Conditions. Jakarta: International Labour Office (ILO).
Sato, Y. (2000). “Linkage Formation by Small Firms: The Case of a Rural Cluster in Indonesia,” Bulletin of
Kadin Indonesia-Jetro, 2006 20 www.kadin-indonesia.or.id Schiller, J., and B. Martin-Schiller (1997), “Market, Culture and State in the Emergence of Indonesian Export Furniture Industry,” Journal of Asian Business, 13(1), 101-16
Schmitz, H. (1995a). “Small Shoemakers and Fordist Giants: Tale of a Super-Cluster,” World Development, 23(1), 9–28.
Schmitz, H. (1995b). “Collective Efficiency: Growth Path for Small-Scale Industry,” Journal of Development
Studies, 31(4), 529–566.
Schmitz, H., and B. Musyck (1994), “Industrial Districts in Europe: Policy Lessons for Developing Countries?”
World Development, 22(6), 889–910.
Schmitz, H., and K. Nadvi (1999). “Clusters and Industrialization: An Introduction,” World Development, 27(9),
Smyth, Ines A. (1990), “The Rattan Industry of Tegalwangi (Indonesia): A Success Story for Small-Scale Enterprises?, mimeographed, Institute of Social Studies, The Hague.
Smyth, Ines A (1992), “The Effects of a Development Project on Handicrafts Production in a Sundanese Village,” PRISMA, 52, 12–30.
Supratikno, H. (2002a). “The Development of SME Clusters in Indonesia,” paper presented at the ASEAN Roundtable on “Entrepreneurship and Small and Medium-Sized Enterprises (SMEs) in Southeast Asia’s Economic Development,” ISEAS, Singapore, November 7–8.
Supratikno, H. (2002b). “The Strategies of Cluster Upgrading in Central Java,” A Preliminary Report to Depperindag, Salatiga.
UN (2001), Growing Micro and Small Enterprises in LDCs, the Missing Middle, Geneva: United Nations
Tambunan, Tulus T. H. (1994). The Role of Small-Scale Industries in Rural Economic Development. Amsterdam: Thesis Publishers.
Tambunan, Tulus T.H. (1997). “Development of Small and Medium Industry Clusters in Indonesia,” Background report for UNIDO, November. Jakarta: UNIDO Office.
Tambunan, Tulus T.H. (1998). “Cluster Diagnosis in Padang Rattan Industries and Proposed Action Plan”, Study Report, October. Jakarta: UNIDO Office.
Tambunan, Tulus T.H. (2006), Development of Small & Medium Enterprises in Indonesia from the Asia-Pacific
Perspective, Jakarta: LPFE-University of Trisakti.
Tambunan, Tulus T.H. (2000). Development of Small-Scale Industries During the New Order Government in
Indonesia. Aldershot: Ashgate Publishing.
Kadin Indonesia-Jetro, 2006 21 www.kadin-indonesia.or.id
Van Dierman , Peter (2004), “ The Economic Policy Environment for Small Rural Enterprises in Indonesia”, Thomas R. Leinbach (ed.), The Indonesian Rural Economy Mobility, Work and Enterprise, Singapore: ISEAS.
Van Dierman, P. (1997). Small Business in Indonesia. Aldershot: Ashgate Publishing.
Van Dijk, M. P., and R. Rabellotti (1997), Enterprises Cluster and Network in Developing Countries, EADI Book Series No. 20. London:
Weijland, H. (1999), “Microenterprise Clusters in Rural Indonesia: Industrial Seedbed and Policy Target,”
World Development, 27(9), 1515–1530.
1
In Indonesia, there are several definitions of SMEs, depending on which agency provides the definition. The State Ministry of Cooperative and Small and Medium Enterprises (Menegkop & UKM) promulgated the Law on Small Enterprises Number 9 of 1995, which defines a small enterprise (SE) as a business unit with total initial assets of up to Rp 200 million (about US$ 20,000 at current exchange rate), not including land and buildings, or with an annual value of sales of a maximum of Rp 1 billion (US$ 100,000), and a medium enterprise (ME) as a business unit with an annual value of sales of more than Rp 1 billion but less than Rp 50 billion. Law does not define explicitly micro enterprises (MIEs). However, since MIEs are the smallest size category of enterprises, Menegkop &n UKM data on SEs include MIEs. BPS, which regularly conducted surveys of SMEs, uses the number of workers as the basis for determining the size of enterprise. In its definition, MIEs, SEs and MEs are business units with, respectively, 1-4, 5-19, and 20-99 workers, and large enterprises (LEs) are units with 100 or more workers. MoI defines enterprises by size in its sector (industry manufacturing) also according to number of workers as the BPS definition.
2
Other articles on the success stories of SME clusters in West Europe include Piore and Sabel (1983); Pyke and Sengenberger (1992); Pyke, Becattini, and Sengenberg (1990); Rabellotti (1995a, b); and Schmitz and Musyck (1994).
3
It appeared that when the economic crisis hit the country in 1997, SMIs have been weathering the crisis better than LIs, because their greater flexibility allows them to adjust production process during the crisis; although many of them have been hit hard too. Many argue that being less reliant on formal markets and formal credit, SMIs are able to respond more quickly and flexibly than LIs to sudden shocks (Berry, et al, 2001).
4
Labor productivity rather than TFP is often used in analyzing productivity growth in SMIs, as the ratio is a useful indicator of a sort of progress, since enterprises that cannot raise it will not be able to remain competitive as wages rise. The difference between TFP and labor productivity is that the former measures the relative efficiency of SMIs and its advance over time, whereas the latter does not. Unfortunately, the TFP measure is more difficult to operational due to problems in the measurement of fixed and human capital.
5
See e.g. Liedholm and Mead (1999) and Berry and Mazumdar (1991). 6
In the literature on modern economic growth models, advanced technology embodied in new/modern machines and skills of workers are two most important determinant factors of productivity that often mentioned. In the literature on SMIs in LDCs, lack of these two factors, plus others such as traditional way of organizing business; poor management; and adopted inappropriate method of production are often argued as the main factors behind the low level of productivity in these enterprises. See e.g. Rice and Abdullah (2000), Sandee and van Hulsen (2000), Sandee et al. (2002), Sato (2000), Smyth (1990), Liedholm and Mead (1999), and Berry and Mazumdar (1991).
7
Kadin Indonesia-Jetro, 2006 22 www.kadin-indonesia.or.id 8
Foreign immigrants who established production facilities have contributed significantly to the clusters’ dynamics. They are clearly in advantageous position vis-à-vis local producers in the clusters, as these foreign immigrants have better accesses to market, technology, and financing sources.
9