CROWN DIAMETER OF PHYTHOREMEDIATION AGENT BY LOGISTIC MODEL
By : H.A Parhusip
Science and Mathematics Faculty, Satya Wacana Christian University
Jl. Diponegoro 52-60 Salatiga, 50711, Central Java,Indonesia
Abstract : The logistic model of crown diameter of Phythoremediation Agent is discussed here. Crown diameter of Kailan is best to be modeled by logistic model. Since 6 Kailans are measured in 9 weeks for each Kailan, then there are 6 pairs of parameters in the model.
The best parameters are approximated by least square method and averaged by geometric mean and harmonic mean. The harmonic mean present better approximation compared to the geometric mean of parameters.
We also observe by principal component analysis that the data set of Kailan present the largest eigenvalue compared the other three tested plants.
Keywords : logistic model, crown diameter, geometric mean, harmonic mean 1. Introduction
One of mechanisms by certain plants to take up essential mineral nutrients and
toxic heavy metals from soils is called phytoremediation. Phytoremediation is the use of
green plants to remove pollutants from the environment. The process is illustrated in
Figure 1.
Figure 1. The process of phytoremidiation
Suresh dan Ravishankar (2004) stated that phytoremidiation do not harm environment.
The used plants as phytoremidiation agencies possess genes that regulate the amount of
metals taken up from the soils by roots and deposited at other location within the plants.
Kasmiyati, et.all (2008) have studied 4 types of plants as phytoremidiation
agencies. These are 2 plants in Brassicaceae i.e: Brassica oleracea and Kailan and 2
plants from Asteraceae, i.e Chrysanthemum and sunflower (Helianthus annus). These
plants grow in soils which are contaminated by textile manufacturing process which
contains heavy metals. The heavy metals (Zn, Cd, Pb, Cu) are bound to soil
components in varying degrees depending on soil conditions such as pH, clay content
and organic matter (Hinchman, et.all 1998).
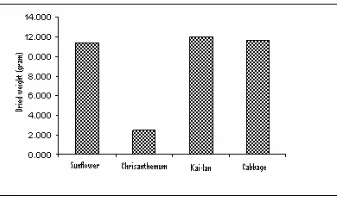
Figure 1. Crown diameter of tested plants (by Kasmiyati, 2008)
The growth rates of the tested plants are analyzed statistically (Kasmiyati, et.all
(2008)). The tested plants are evaluated in 9 weeks. The crown of diameters, the
number of leaves, the dried weights are measured. By Tukey test, it was concluded that
the Chrysanthemum has the smallest crown diameter and dried weight compared to
other three. The measurements of dried weights are illustrated in Figure 2.
Dried weights are obtained by drying the tested plants in an oven (with 105 oC )
after 3 months growing. Dried weights illustrate an ability of plant in photosynthesis.
As a result, the number of leaves of Chrisanthemum is the smallest compared the other
three plants. As a conclusion of this research that Chrisanthemum is the worst agent
used in phytoremidiation.
This paper presents the growth rate of the tested plants as a logistic function.
Kailan is the studied plant though several tested plants are available. The model is
shown on the section 2.
2.1 Logistic model of crown diameter
We actually idealize the situation by assuming that the diameter of crown is a
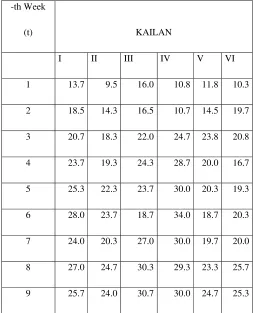
logistic function. The used data is shown in Table 1.
Tabel 1. Data of crown diameter (cm) of 6 Kailans (by Kasmiyati, 2008)
-th Week
(t) KAILAN
I II III IV V VI
1 13.7 9.5 16.0 10.8 11.8 10.3
2 18.5 14.3 16.5 10.7 14.5 19.7
3 20.7 18.3 22.0 24.7 23.8 20.8
4 23.7 19.3 24.3 28.7 20.0 16.7
5 25.3 22.3 23.7 30.0 20.3 19.3
6 28.0 23.7 18.7 34.0 18.7 20.3
7 24.0 20.3 27.0 30.0 19.7 20.0
8 27.0 24.7 30.3 29.3 23.3 25.7
9 25.7 24.0 30.7 30.0 24.7 25.3
By introducing variable t is the time variable, and D(t) is the diameter at time t, we have
)
where D(0) represents the initial diameter, and parameter K and k must be determined
based on the given data.
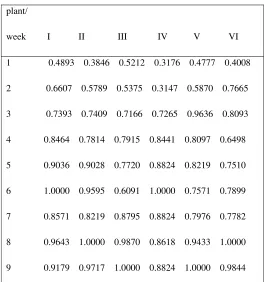
Before using the model, one has to present the given data in dimensionless form
by dividing the number on each coloum by the maximum number on each coloum. This
is shown in Table 2.
Table 2. Data Table 1 in dimensionless form
plant/
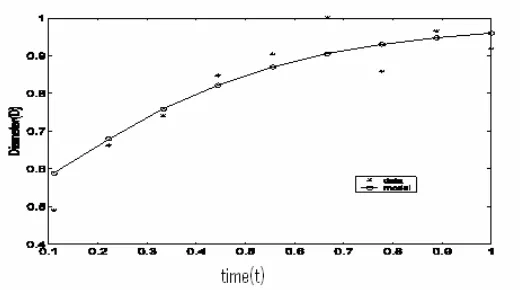
The parameter k and K can be obtained by least square method (Parhusip,2009) (Stoer
dan Bulirsch,1993,hal.217) and we get K=0.9844 dan k=3.6688. Therefore the logistic
model for the first plant (denoted by I) becomes
Figure 3. Comparison logistic model and data of crown diameter of the first Kai-lan
(2-nd coloum of Table 2).
With the same procedure as before, we may compute the values of parameter K and k
for each Kailan and the results are listed in Table 3.
Table 3. The values of parameters K and k for each Kailan
No K k
I 0.9844 3.6688
II 1.0064 3.9832
III 1567.1 0.7
IV 0.9610 4.5827
V 0.9266 4.0359
VI 0.9444 3.7926
The error is defined to guarantee how good the logistic model approximates the crown
diameter as a function of time. The error is denoted by e and is defined by
% 100 x D
D D e
d l d −
= (1c)
where || .|| reads as ’norm’ and Dd := crown diameter given by data and Dl:= crown
diameter given by logistic model. The Euclidian norm is used here (Stoer and Bulirsch,
Using equation (1c), we obtain the error of each plant (I-VI) is respectively
given by 6.7675%, 7.5598%, 10.6854%, 14.0065%, 12.7693%, 13.2521%.
Computation of parameter for each plant becomes time consuming. Therefore we
introduce the geometric mean and harmonic mean to find the best estimation of
parameters.
2.2 Geometric mean and Harmonic mean
Kasmiyati (2008) has used the arithmetic mean to analyze her data by Tukey
test. In this paper we introduce geometric mean and harmonic mean to find the best
value of parameters of the logistic models.
Suppose we have data x1,x2,...,xn and the geometric mean is denoted by xrG
which is defined by
n
then xrH is called harmonic mean. The relation of arithmetic mean, geometric mean and
harmonic mean is known (Peressini, et.all, 1988) as
H G
A x x
xr ≥ r ≥ r . (3)
The equal sign is satisfied if each value of the given data is the same. Equations (2a-2b)
will be used to find the mean values of K and k.
3. Research Method
1. Data presented into dimensionless
2. By assuming the crown diameter is a logistic function then the parameter K and k
3. Using geometric mean and harmonic mean, find the best values of K and k for all
plants.
4. Using the best parameter in step 3 to present the crown diameter as a logistic
function.
5. Construct the covariance matrix of each data set of plant
6. Find the largest eigenvalue of each data set of plant and compute its corresponding
eigenvector.
4. Result and Discussion
Using equation (2a) and (2b), we may obtain the mean values of parameters in
Table 3 are also computed and shown in Table 4.
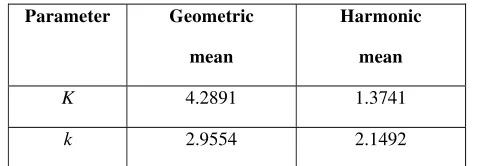
Table 4. Geometric mean and harmonic mean of parameter K and k.
Parameter Geometric
mean
Harmonic
mean
K 4.2891 1.3741
k 2.9554 2.1492
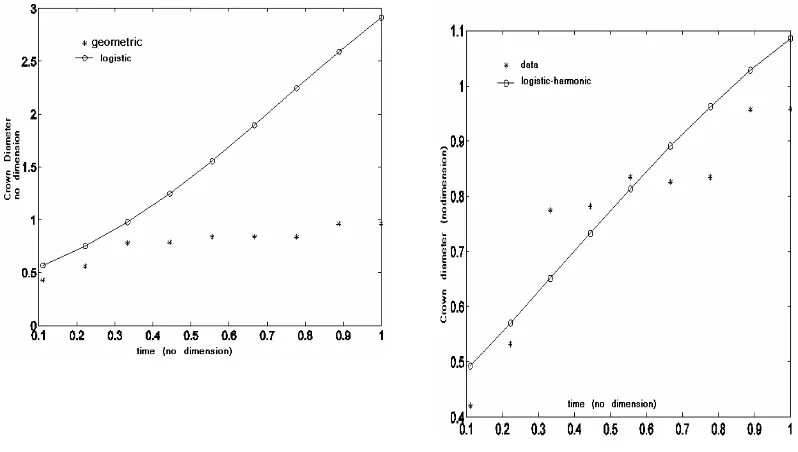
The mean values of parameters are used in the logistic model to present the crown
diameter as a function of time. Using geometric mean, we get 135.8004% and
10.9801% using harmonic mean. These results are illustrated in Figure 4a-4b. We
conclude that the harmonic mean is the best approximation of parameters for all tested
plants.
What about other tested plants ?
The logistic model is also tried to model the crown diameter of other tested
plants such as Brassica oleracea and 2 plants from Asteraceae, i.e Chrysanthemum and
sunflower (Helianthus annus). In the case of Chryanthemum, the model does not fit to
the obtained data. One example is shown by Figure 5. We have also studied the sun
flower. As a result, the logistic model is not a good model for its crown diameter.
Figure 4a. Logistic model of Crown Diameter using geometric mean
Figure 4b. Logistic model of Crown Diameter using harmonic mean
1 2 3 4 5 6 7 8 9 0.6
0.65 0.7 0.75 0.8 0.85 0.9 0.95 1
i−th week
Crown diameter (no dimension)
data model
Figure 5. The logistic model compared to the crown diameter data of the first tested
Chrysanthemum.
Compared to the other three tested plants, Kailan has shown that its diameter
crown can be modeled by the logistic function. We will give some more general
comments on this. This is done by considering the principal component of the
covariance of given data. One may refer to (Parhusip and Siska, 2009) to have the idea
of using this method.
By principal component here means that we construct the covariance matrix of
each set of data. By computing its eigenvalues and selecting the largest eigenvalue, we
same set. One may observe that the largest eigenvalue is given by the set diameter
crown of Kailan. The largest eigenvalue determines its greatest variance (Johnson and
Wichern, 2002). We can conclude that the Kailan is the most dominant plant to present
its diameter crown compared to the other three plants.
Conclusion and Remark
This paper presents a logistic model of crown diameter of Kailan. Since there are
several observations, we need to determine the best parameters which describe the
growth rate (k) of plant and the maximum capacity of crown diameter to grow (K). The
best parameters are chosen by using geometric mean and harmonic mean. The result
shows that the harmonic mean of parameters are the best aproximation.
Instead of crown diameter, dried weight and the number of leaves are also
measured to study the influence of polluted soils. We have not concluded which plant is
considered as the best phytoremediation agent.
Aknowledgment : I thank to Kasmiyati, MSc (Biology Faculty, UKSW) who has
provided me her data for this paper.
References
Aiyen. 2005. Ilmu Remediasi untuk Atasi Pencemaran Tanah di Aceh dan Sumatera Utara. http://www.kompas.com/kompas-cetak/0503/04/ilpeng/1592821.htm
Hinchman, R.R, Negri M. C., and Gatliff, E. G., 1998. Phytoremediation : Using Green Plants to Clean Up Contaminated Soil, Ground Water and Waste Water, Applied Natural Science, Inc, Argonne National Laboratory, Illionis,
Johnson ,R.A., and Wichern, D.W. 2002. Applied Multivariate Statistical Analysis, 6th ed. Prentice Hall, ISBN 0-13-187715-1.
Kasmiyati, S., E.B.E. Kristiani, M.M. Herawati, Potensi Tanaman Anggota Brassicaceae sebagai Agen Fitoekstraksi Logam Berat Krom pada Limbah Padat Tekstil. Laporan Hasil Penelitian Program Penelitian Dosen Muda, Program Fasilitasi Perguruan Tinggi Kopertis Wilayah VI Jawa Tengah, Tahun 2008.
Parhusip H. A., dan Siska A. 2009. Principal Component Analysis (PCA) untuk Analisis Perlakukan Pemberian Pakan dan Mineral terhadap Produksi Susu Sapi, Prosiding Seminar Nasioanal Matematika UNPAR, ISSN 1907-3909, Vol 4, hal.AA 42-51.
Stoer, J and Bulirsch, R.,1993. Introduction to Numerical Analysis, Second Edition, Text in Applied Mathematics, 12, Springer-Verlag,New-York,Inc.
Suresh. B. and Ravishankar. G.A. 2004. Phytoremediation--a novel and promising
approach for environmental clean-up. Crit Rev Biotechnol 24(2-3):97-124.