M – 18
A SIMULTANEOUS STUDY OF POVERTY RATE , CHILD LABOR
AND DROPOUT RATE IN INDONESIA
Kusumapuri, I Made Sumertajaya, Farit M Afendi
Statistics Department, Bogor Agricultural University
Abstract
Poverty is a major cause of child labor and dropout case. Poor families usually encourage their children to work looking for additional income as a way to survive. Based on previous research there is a causal relationship of poverty rate, number of child labor and dropout rate. Characteristics of poverty rate, child labor and dropout rate can be assessed from the demographic characteristics and socioeconomic characteristics are interrelated.
This study aims to model the interdependent relationship of poverty rate, child labor and dropout rate in Indonesia and factors that influence them. One appropriate method is used to model the interdependent relationship of these three variables is the simultaneous equation models. From the results of the identification of the model equations were used the method Three Stage Least Square (3SLS) with 3 equations. The number of variables is 11 pieces consist of 3 endogenous variables and 8 predetermined variables.
The result showed that child labor in Indonesia is influenced significantly by poverty rate, dropout rate, and percentage of household heads who worked in agriculture. Poverty rate in Indonesia is influenced significantly number of child labor, dropout rate, and percentage of household heads who worked in agriculture. While dropout rate is influenced significantly by number of child labor, percentage of household with members more than six, percentage of
Keywords: 3 bhaSLS, simultaneous equation models, poverty, child labor, dropout.
INTRODUCTION
Poverty is a multidimensional phenomenon which means it can be analyzed from various dimensions , such as the economic, social , political and cultural . The first objective of the Millennium Development Goals ( MDGs ) in 2015 is to tackle poverty in which one of the main targets is to reduce the national poverty rate of 15.1 % in 1990 to 7.5 % in 2015. The percentage of poor people in Indonesia over the last 4 years showed a downward trend . In 2010 the number of poor people in Indonesia as much as 31.02 million or 13.33 % of the total population of Indonesia . While in 2013 the number of poor people in Indonesia to 28.60 million ( 11.46 % ) . Although the poverty rate in Indonesia has shown a downward trend , but have not been able to achieve the first MDG goal is to lower the poverty rate to 7.5 % .
conducted an analysis of SUSENAS KOR in 2010 to examine the demographic and socioeconomic characteristics of household child labor .
The phenomenon of poverty rate, number of child labor and dropout rate are interrelated. They have an interdependent relationship. The high number of child labor rates can lead to increasing levels of poverty in the region. Aprilia (2014) conducted a study to find a causal relationship between the number of child labor, poverty, fertility and dropout rates by using Granger causality test. The study concluded that the number of child labor has a reciprocal relationship with poverty, fertility, and dropout rates. The relationship of these variables is a positive relationship, meaning that the higher of poverty rate, fertility, and dropout rates led to the high number of child labor, and vice versa.
The model most frequently encountered in many cases is usually a single equation model (single equation models). Single equation model is a model in which there is only one dependent variable Y and one or more independent variables X. The relationship of cause and effect that occurs in the model take place in one direction, namely from X to Y. However, sometimes in several models often are interdependent or interdependence among variables, where not only the variables X that could affect the variables Y, but also variable Y can affect the variables X that occur in the model two-way relationship. The model as it is called by the simultaneous equations model or system of simultaneous equations.
In a simultaneous equations model the dependent variable (Y) in an equation could be the explanatory variables (X) for the other equations. So use Ordinary Least Square (OLS) in the estimation of parameters in the context of simultaneous equations is not appropriate, because there is a correlation between the explanatory variables (Xt) with error stokastiknya (ɛt) so assuming Cov (Xt, ɛt) = 0 can not be met. If forced to use the OLS method will produce biased estimates of the parameters and inconsistent (Vogelvang 2005). Several methods of estimation can be done to overcome the problems of this OLS, one of system approach is through the method of Three Stage Least Square (3SLS). Therefore this study will use Three Stage Least Square (3SLS) method in the model of simultaneous estimation of poverty rate, number of child labor and dropout rate in Indonesia in 2013.
Based on the background described previously, the issues discussed in this research is to know the interrelated relationship of poverty rate, number of child labor and dropout rate in Indonesia. While the purpose of this study is to model a simultaneous equation of poverty rate, number of child labor and dropout rate in Indonesia in 2013. The benefits of this research is enrich the knowledge of interrelated relationship of poverty rate, number of child labor and dropout rate in Indonesia in 2013 by three stage least square approach.
RESEARCH METHOD Method and Material
Data used in this research is the data generated from National Socioeconomic Survey (SUSENAS) and Labor Force Survey ( SAKERNAS ) obtained Statistics-Indonesia in 2013. In this study , there are two types of variables. They are predetermined variables and endogenous variables. These are the endogenous variables used in this study :
No Variables Name Type Source
1 Poverty Rate (POV) Numeric Statistics-Indonesia
2 Percentage of Child Labor (CHILDLAB) Numeric Statistics-Indonesia
The predetermined variables used in this study are differentiated by demograhic characteristic and socioeconomic characteristic as follows :
No Variables Name Type Source
Demographic Characteristic
1 Percentage of household whoose
member greater than six (ART6) Numeric Statistics-Indonesia
Socioeconomic Characteristic
1
Percentage of household heads who did not completed primary school (KRTP)
Numeric Statistics-Indonesia
2
Percentage of household heads who completed primary school and
junior high school (KRTDSR) Numeric Statistics-Indonesia
3 Percentage of household heads
who does not work (KRTTB) Numeric Statistics-Indonesia
4
Percentage of household heads who worked in agriculture (KRTPERT)
Numeric Statistics-Indonesia
5 Unemployment Rate (TPT) Numeric Statistics-Indonesia
6 Economic Growth (PE) Numeric Statistics-Indonesia
7 Human Development Index (IPM) Numeric Statistics-Indonesia
Some of the tools used in this study, namely SAS 9.2 and Minitab 16.
Methodology
Simultaneous Equation Model
Simultaneous equation models consist of structural equation and reduced form equation. Structural equation is a model equation formed from the underlying economic theory or result of the previous researches. Structral equation form of the model of simultaneous equations can be written as:
+ + ⋯+ + + + ⋯+ =∈
+ + ⋯+ + + + ⋯+ =∈
⋮
+ + ⋯+ + + + ⋯+ =∈
where
, , …, =
, , …, =
∈ ,∈ , …,∈ =
= 1,2, …, =
, , …, =
, , …, =
Since model (1) is complete, it may be generally solved for endogenous variables. The solution is called reduced-form model and it is written as:
= + + ⋯+ +
= + + ⋯+ +
⋮
= + + ⋯+ +
where π’s are reduced form coefficient, and ′ are reduce form disturbances. The reduce form coefficient show the effects on the equilibrium values of the endogenous variables from a change in the corresponding exogenous variables after all feedbacks are taken place.
To examine interdependent relationship between poverty rate, number of child labor and dropout rate in Indonesia used simultaneous equation models. There are three structural equations used in this study. Structural equation of each endogenous formulated as follows:
= + + + +
= + + + 6 + +
= + + + + +
In a system of simultaneous equations consist of G endogenous variables in the whole equation, g endogenous variables in an equation, K exogenous variables in the overall equation and k exogenous variables in an equation. In a group of simultaneous equations G, called the identified if the number of exogenous variables that are not included in the equation should not be smaller than the number of endogenous variables are included in the equation minus 1
Based on the order condition, all structural equation is overidentified. Then do the rank criteria condition and the results of all the equations can be identified.
Three-Stage Least Squares (3SLS) Method
This method use Generalized Least Squares (GLS) technique to all structural equations estimated by two-stage least squares method. There are three steps in the 3SLS method:
1. Regress all variables endogenous on all the exogenous variables of the model and keep their prediction
3. Use the results obtained in steps 1 and 2 and use the GLS estimators to obtain 3sls estimator.
GLS estimator which is:
= ′Ω ′Ω
Where matrix Ω= ( ′) is an estimate of the variance-covariance matrix of the disturbances. However knowing the 2SLS consistent estimator in (6), we use it in order to compute a consistent estimate W of Ω as follows:
=
⋯ ⋯
⋮ ⋮ ⋱ ⋮
⋯
where
= ( − , )′( − , )
for i,j=1,2,…,G and + ≥ +
By substituting (8) into (7) we obtain the 3SLS estimator which is:
= ′ ′
With var-cov ( ) = ′
RESULT AND DISCUSSION
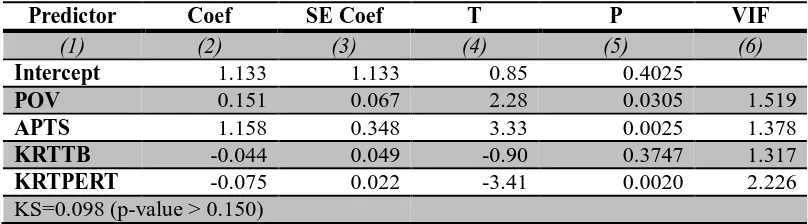
Table 1 Coefficient, Standard Error, P-value and VIF of variables affected Child Labor
Predictor Coef SE Coef T P VIF
(1) (2) (3) (4) (5) (6)
Intercept 1.133 1.133 0.85 0.4025
POV 0.151 0.067 2.28 0.0305 1.519
APTS 1.158 0.348 3.33 0.0025 1.378
KRTTB -0.044 0.049 -0.90 0.3747 1.317
KRTPERT -0.075 0.022 -3.41 0.0020 2.226 KS=0.098 (p-value > 0.150)
= 1.133 + 0.151 + 1.158 −0.044 −0,075
Having obtained the model, first tested the assumptions of the model are obtained including normality test, homoscedasticity test, and multicollinearity test. From Table 1 shows that the assumption of normality using the Kolmogorov-Smirnov statistic is met. VIF value is less than 5 indicates no multicollinearity. Based on Glesjer Test showed that there was no heteroscedasticity.
From table 1, child labor in Indonesia is influenced significantly (at alpha 10%) by poverty rate, dropout rate, and household heads who worked in agriculture. Poverty rate and dropout rate have positive influence on the number of child labor. If poverty rate increase 1% then the number of child labor will increase 0.151%. When dropout rate increase 1% then the
(7)
(8)
(9)
number of child labor will increase 0.158%. While household heads who worked in agriculture has negative influence on the number of child laborers. When percentage of household heads who worked in agriculture increase 1% then it will decrease the number of child labor 0.075%. Household head who does not work do not have a significant effect on the number of child labor in Indonesia in 2013.
Table 2 Coefficient, Standard Error, P-value and VIF of variables affected Dropout Rate
Predictor Coef SE Coef T P VIF normality test using the Kolmogorov-Smirnov statistic shows that p-value > 0.150, it indicates normality assumption is met. VIF value is less than 5 indicates no multicollinearity. Based on Glesjer Test showed that there was no heteroscedasticity.
From table 2, dropout rate in Indonesia is influenced significantly (at alpha 10%) by number of child labor, percentage of household with members more than six, percentage of household heads who did not complete primary school and percentage of household head who completed basic education. The number of child labor, percentage of household with members more than six, percentage of household heads who did not complete primary school and percentage of household head who completed basic education have positive influence in dropout rate. If number of child labor increase 1% then dropout rate will increase 0.967%. When percentage of household with members more than six increase 1% then dropout rate will increase 0.051%. When percentage of household heads who did not complete primary school increase 1% then dropout rate will increase 0.063%. When percentage of household head who completed basic education increase 1% then dropout rate will increase 0.081%. While poverty rate has negative influence in dropout rate. When poverty rate increase 1% then dropout rate will decrease 0.117%.
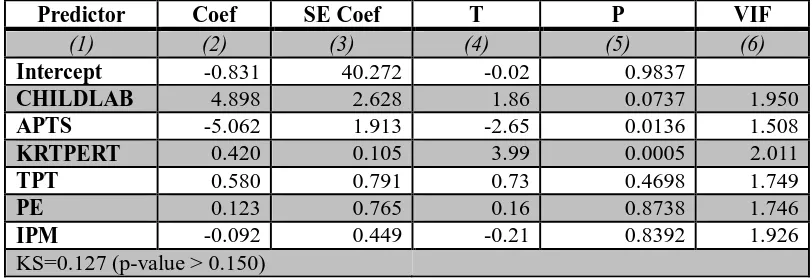
Table 3 Coefficient, Standard Error, P-value and VIF of variables affected Poverty Rate
= −0.831 + 4.898 −5.062 + 0.420 + 0.580 + 0.123 −0.092
From Table 3 shows that all classic assumption of regression are met. Based on normality test using the Kolmogorov-Smirnov statistic shows that p-value > 0.150, it indicates normality assumption is met.VIF value is less than 5 indicates no multicollinearity. Based on Glesjer Test showed that there was no heteroscedasticity.
From table 3, poverty rate in Indonesia is influenced significantly( at 10%) by number of child labor, dropout rate, and percentage of household heads who worked in agriculture. Number of child labor, percentage of household heads who worked in agriculture have positive influence in dropout rate.When number of child labor increase 1% then poverty rate will increase 4.898%. When percentage of household heads who worked in agriculture increase 1% then poverty rate will increase 0.420%. While dropout rate has negative influence in poverty rate. When dropout rate increase 1% then poverty rate will decrease 5.062%. Unemployment rate, economic growth and human development index do not have significant influence on poverty rate.
R-square that generated by the system is about 0.6628. It means that total of diversity of poverty rate, number of child labor and dropout rate in Indonesia in 2013 which can be explained by the explanatory variables in the system about 66.28%. It is about 33.72% that influenced by other factors out of system.
CONCLUSION AND SUGGESTION
From this research we can conclude several things:
1. Child labor in Indonesia is influenced significantly by poverty rate, dropout rate, and household heads who worked in agriculture. Poverty rate and dropout rate have positive influence on the number of child labor. While household heads who worked in agriculture has negative influence on the number of child laborers.
2. Dropout rate in Indonesia is influenced significantly by number of child labor, percentage of household with members more than six, percentage of household heads who did not complete primary school and percentage of household head who completed basic education. The number of child labor, percentage of household with members more than six, percentage of household heads who did not complete primary school and percentage of household head who completed basic education have positive influence in dropout rate.
3. Poverty rate in Indonesia is influenced significantly by number of child labor, dropout rate, and percentage of household heads who worked in agriculture. Number of child labor, percentage of household heads who worked in agriculture have positive influence in dropout rate. While dropout rate has negative influence in poverty rate.
Suggestion for further research:
1. It is necessary to add more endogenous or exogenous variables that influence poverty rate, number of child labor and dropout rate in indonesia.
REFERENCES
Akaro, R.R.J. & Mtweve, N.A. (2011). Poverty and Its Association with Child Labor in Njombe District in Tanzania: The Case of Igima Ward. Journal of Social Sciences. Maxwell Scientific Organization.
Aprilia, W. (2014). Hubungan Kausalitas Antara Tingkat Kemiskinan, Fertilitas, Angka Putus Sekolah dengan Jumlah Tenaga Kerja Anak di Indonesia 2001-2010. Surabaya:UNAIR.
Badan Pusat Statistik. (2013). Data dan Informasi Kemiskinan Kabupaten/Kota 2010. Jakarta:BPS.
Bappenas. (2008). Laporan Pelaksanaan MDGs. Jakarta:Bappenas.
Darusasi, R. (2013). Kondisi Demografi dan Sosial Ekonomi Rumah Tangga Pekerja Anak di DKI Jakarta (Analisis Data Susenas KOR 2010). Jurnal. Jakarta.
Seddighi, H.R., Lawler, K.A., & Katos, A.V. (2000). Econometrics: A Practical Approach. London: Routledge.