HEARTRA TE COMPliT4 710N JMPLEMElVTE/) ON f1ELJ) PROliRAMMABLE GATE ARRAY BOARD
Ivanna K. Timot/11.\
HEART RATE COMPUTATION IMPLEMENTED ON FIELD
PROGRAMMABLE GATE ARRAY BOARD
Ivanna K. Timotius
Department of Electronic Engineering, Satya Wac ana Christi5tn University, Salatiga,
i vanna_ timotius@yahoo. com
Abstract
Heart rate is the most basic information of heart activities. This paper aims to
describe a possible real time system to detect electrocardiogram (ECG) signaL count the
R-R interval of the ECG signal, and compute the heart rate. This project is implemented successfully using field programmable gate array (FPGA) board.
Keywords: Heart rate. ECG. FPGA.
1. INTRODUCTION
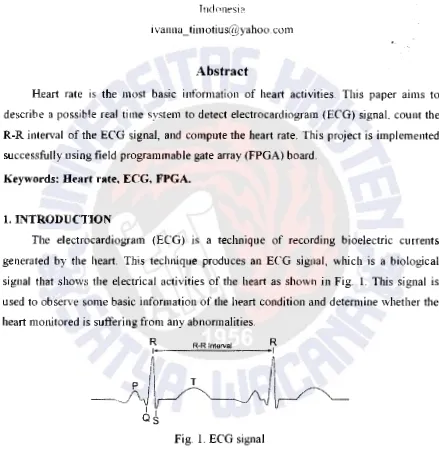
The electrocardiogram (ECG) is a technique of recording bioelectric currents
generated by the heart. This technique produces an ECG signal, which is a biological
signal that shows the electrical activities of the heart as shown in Fig. I. This signal is used to observe some basic information of the heart condition and determine whether the
heart monitored is suftering from any abnormalities.
R , _ _ _ R-R Interval ;_;_;_;..;.:..::_:c._:;; _ _ _ R ,
MセMセセ@
I Ias
Fig. 1. ECG signal
The most basic information monitored from ECG signal is heart rate. Heatt rate can
be computed using the R-R interval of the ECG signal This paper aims to make a real
time system to detect the ECG signaL count the R-R interval, and compute the heart rate.
[image:1.1053.36.475.170.623.2]Techne Jurnal Ilmiah Elektrott:knika Vol. l) No l April 20 I 0 Hal 1 . 11
(VHDL) on an Altera cyclone school boy field programmable gate array (FPGA) board
to compute the heart rate.
The block diagram of the system is illustrated in Fig. 2. In the ECG block, a circuit
is designed to obtain the ECG signal from the human body. The output of this ECG block is the input to the FPGA board. The processes to be done within the FPGA board include
tilt: analog lo lhgltai セZオョカエZiセiuh@ v\i.JC j vf the EL \.J signal, i:hc digvmhm iu alt<:i:>LHc ihc heart rate, as well as the digital to analog conversion (DAC) of the signal which marks
the R points. An oscilloscope is used to display the output
Fig. 2. The block diagram of the system
2. ECG CIRCUIT
In general, biological signals are very small. An ECG signal is approximately O.l to 6 mV [1]. Therefore amplification is needed in order to monitor them better. Fig. 3 and Fig. 4 show the block diagram and the circuit diagram of an ECG amplifier. The system
starts with taking the signal from the body by connecting self-adhesive electrodes to
significant part of the body Then, the signal is amplified using an instrumentation amplifier. After that, it goes through a band pass titter that eliminates noise of the input
signal.
Differential セᄋ@ Instrument
Input
f
i
AmplifierHigh Pass
Filter
Low Pass
Filter
Fig. 3. ECG amplifier block diagram
ECG
Signal
HEART RAn: cumpcQセT@ TTON lMPLE\cJEVTED ON FJELD proHOraNセimable@ OATE ARRA Y BOAR/) Ivanna K Timofius
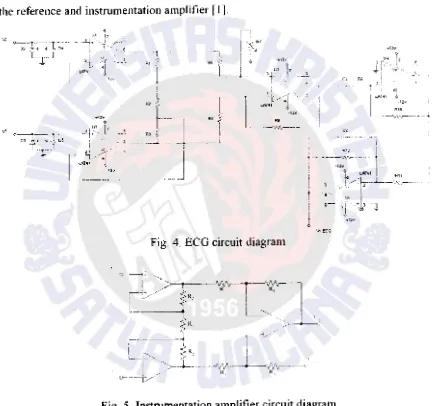
An instrumentation amplifier is used to attenuate common biological signal from
the positive and negative inputs produced by not-heart body organs and amplify the ditTerence between the inputs produced by heart. An instrumentation amplifier having a
high common mode rejection ratio (CMRR) is needed for this application. The
instrumentation amplifier circuit used in the セカウエ・ュ@ is shown in Fig. 5 The gain can be
computed using Eq I. To control the CMRR, a variable resistance was placed between
the reference and instnnnentation amp I itier [I ] .
'"
"' • .i Ol
1
11
+\2'W
Q
I'
MMセ@セ@_t
- _!__
llt
"'
"'
••
+i2<1
Zキセェ@ IT ᄋBMセ@
I
" _ .. ,.,\.,---·---·
-·-Fig. 4. ECG circuit diagram
MセM ..
.,__ ______ セMjᄋOBカG|NMMセセ⦅ャ@ __ NN⦅⦅セ|[|NG|LMMMMMMMMMMMGBBG@
li. loti
4'
I
""'"'
6 ·1211RIO
C'l
·12vc I
14 _OJ.Al•U I Fill
ャᄋOᄋセMMMlセLLLLセM
·-r '
l--
,y
,,+1-
'1.\h ECG
Fig. 5. Instmmentation amplifier circuit diagram
(l)
The band pass filter is made out of cascaded high and low pass filter. Since the
[image:2.1054.50.469.219.446.2] [image:2.1054.45.480.363.650.2]Techne Jurnal Ilmiah Elektrott:knika Vol. l) No l April 20 I 0 Hal 1 . 11
(VHDL) on an Altera cyclone school boy field programmable gate array (FPGA) board
to compute the heart rate.
The block diagram of the system is illustrated in Fig. 2. In the ECG block, a circuit
is designed to obtain the ECG signal from the human body. The output of this ECG block is the input to the FPGA board. The processes to be done within the FPGA board include
tilt: analog lo lhgltai セZオョカエZiセiuh@ v\i.JC j vf the EL \.J signal, i:hc digvmhm iu alt<:i:>LHc ihc heart rate, as well as the digital to analog conversion (DAC) of the signal which marks
the R points. An oscilloscope is used to display the output
Fig. 2. The block diagram of the system
2. ECG CIRCUIT
In general, biological signals are very small. An ECG signal is approximately O.l to 6 mV [1]. Therefore amplification is needed in order to monitor them better. Fig. 3 and Fig. 4 show the block diagram and the circuit diagram of an ECG amplifier. The system
starts with taking the signal from the body by connecting self-adhesive electrodes to
significant part of the body Then, the signal is amplified using an instrumentation amplifier. After that, it goes through a band pass titter that eliminates noise of the input
signal.
Differential セᄋ@ Instrument
Input
f
i
AmplifierHigh Pass
Filter
Low Pass
Filter
Fig. 3. ECG amplifier block diagram
ECG
Signal
HEART RAn: cumpcQセT@ TTON lMPLE\cJEVTED ON FJELD proHOraNセimable@ OATE ARRA Y BOAR/) Ivanna K Timofius
An instrumentation amplifier is used to attenuate common biological signal from
the positive and negative inputs produced by not-heart body organs and amplify the ditTerence between the inputs produced by heart. An instrumentation amplifier having a
high common mode rejection ratio (CMRR) is needed for this application. The
instrumentation amplifier circuit used in the セカウエ・ュ@ is shown in Fig. 5 The gain can be
computed using Eq I. To control the CMRR, a variable resistance was placed between
the reference and instnnnentation amp I itier [I ] .
'"
"' • .i Ol
1
11
+\2'W
Q
I'
MMセ@セ@_t
- _!__
llt
"'
"'
••
+i2<1
Zキセェ@ IT ᄋBMセ@
I
" _ .. ,.,\.,---·---·
-·-Fig. 4. ECG circuit diagram
MセM ..
.,__ ______ セMjᄋOBカG|NMMセセ⦅ャ@ __ NN⦅⦅セ|[|NG|LMMMMMMMMMMMGBBG@
li. loti
4'
I
""'"'
6 ·1211RIO
C'l
·12vc I
14 _OJ.Al•U I Fill
ャᄋOᄋセMMMlセLLLLセM
·-r '
l--
,y
,,+1-
'1.\h ECG
Fig. 5. Instmmentation amplifier circuit diagram
(l)
The band pass filter is made out of cascaded high and low pass filter. Since the
[image:3.1054.51.484.200.606.2]Technc Jurna1 Ilnuah Ekktroteknika Vol. lJ No. 1 Aprii201U Hal l- 11
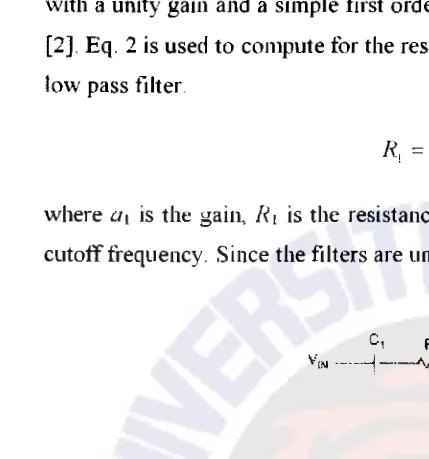
high pass filter is 0.5 Hz and the cutoff frequency of the low pass filter is 100Hz. Fig. 6
and Fig. 7 show the connection of a simple first order inverting active high pass filter
with a unity gain and a simple first order inverting active low pass filter with a unity gain
[2]. Eq. 2 is used to compute for the resistance and capacitance value of the high pass and
low pass filter
(2)
where
a,
is the gain, R, is the resistance value, ('1 is the capacitance value. and}; is thecutoff frequency. Since the filters are unity gain, the value of R2 IS equal to that of R1 [2].
Fig. 6. First order inverting active high pass filter
Fig. 7. First order inverting active low pass t1lter
Fig. 8 shows the ECG signal generated from the ECG amplifier. Since the ECG
signal of each person differ in strength, the amplifier is made such that the gain of the
instrumentation amplifier may be adjusted to conform to the required signal strength by
the FPGA module.
;/
i
Fig. 8. Resulted ECG signal
HEART/lr1JE ( U/t!IPUTA 1101\. /MPLEilJENTED lJJV FJELD proャOram[セᄋiable@ GATE ARRAY BOARD
Ivanna K. Tnnotius
DI. SYSTEM IMPLEMENTED ON FPGA
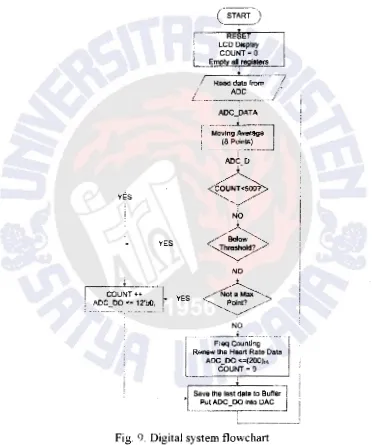
The output of the ECG circuit is then teed to a FPGA board. The digital algorithm
implemented on the FPGA aims to point out the R points and calculate the real time hea11
rate. The approach implemented on the FPGA board sta11s with a moving average filter to
rC'Ill(We the hiuh frequcncv nnise Then it followed hv R point finding and the heart riltt>
calculation The detail digital algorithm is shown at Fig. 9
YES
ADC_DATA
..
Moving AverageᄋᄋセMNQNNNNNNᄋMMᄋᄋᄋᄋMMᄋャ@
(S Points)---.. ---セBG@ セBBGBM
---1
ADC_D
セ^OPP_@
Gセ@"-y
!
NO
/A"-._
セtィセZォゥ_^@
Gセ@
NO
セMMセセMG@
Freq Counting Renew t11e Heart Rat& Data
ADC_OO \]HRPPI Qセ@ COUNT= 0
Fig. 9. Digital system flowchart
First, the system clears all register and makes a welcome display on the liquid
[image:4.1054.54.483.225.684.2]Technc Jurna1 Ilnuah Ekktroteknika Vol. lJ No. 1 Aprii201U Hal l- 11
high pass filter is 0.5 Hz and the cutoff frequency of the low pass filter is 100Hz. Fig. 6
and Fig. 7 show the connection of a simple first order inverting active high pass filter
with a unity gain and a simple first order inverting active low pass filter with a unity gain
[2]. Eq. 2 is used to compute for the resistance and capacitance value of the high pass and
low pass filter
(2)
where
a,
is the gain, R, is the resistance value, ('1 is the capacitance value. and}; is thecutoff frequency. Since the filters are unity gain, the value of R2 IS equal to that of R1 [2].
Fig. 6. First order inverting active high pass filter
Fig. 7. First order inverting active low pass t1lter
Fig. 8 shows the ECG signal generated from the ECG amplifier. Since the ECG
signal of each person differ in strength, the amplifier is made such that the gain of the
instrumentation amplifier may be adjusted to conform to the required signal strength by
the FPGA module.
;/
i
Fig. 8. Resulted ECG signal
HEART/lr1JE ( U/t!IPUTA 1101\. /MPLEilJENTED lJJV FJELD proャOram[セᄋiable@ GATE ARRAY BOARD
Ivanna K. Tnnotius
DI. SYSTEM IMPLEMENTED ON FPGA
The output of the ECG circuit is then teed to a FPGA board. The digital algorithm
implemented on the FPGA aims to point out the R points and calculate the real time hea11
rate. The approach implemented on the FPGA board sta11s with a moving average filter to
rC'Ill(We the hiuh frequcncv nnise Then it followed hv R point finding and the heart riltt>
calculation The detail digital algorithm is shown at Fig. 9
YES
ADC_DATA
..
Moving AverageᄋᄋセMNQNNNNNNᄋMMᄋᄋᄋᄋMMᄋャ@
(S Points)---.. ---セBG@ セBBGBM
---1
ADC_D
セ^OPP_@
Gセ@"-y
!
NO
/A"-._
セtィセZォゥ_^@
Gセ@
NO
セMMセセMG@
Freq Counting Renew t11e Heart Rat& Data
ADC_OO \]HRPPI Qセ@ COUNT= 0
Fig. 9. Digital system flowchart
First, the system clears all register and makes a welcome display on the liquid
[image:5.1054.74.449.201.646.2]Techne Jurnallltmah Ekktrotckmka Vol. Y No. l Apnl2010 Hal i 11
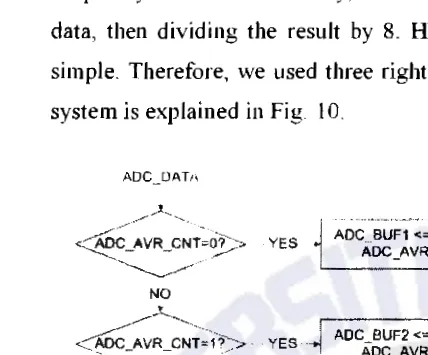
frequency 2 kHz. and conducts an eight point moving average filtering to remove the high
frequency noise Theoretically, the moving average filtering is made by adding the last 8
data, then dividing the result by 8. However, a divider is avoided to make the system simple. Therefore, we used three right shifts to replace the divider. The moving average system is explained in Fig 10.
ADC_DAT11
<::::§C_AVR_CNT--0?:;>
MMMMNセMᄋMM
NO
_...-!._,
セ@
--- -AVR -cセ[セQ_^@
.-·NO
YES ADC BUF1 <= adcセdata@ AOC_AVR_CNT++
I
VES ᄋセN@ ADC BUF2 <= ADC DATA ADC_AVR_ CNT++
ADC 0 <= ADC BUF1 + ADC BUF2 + .. + ADC BUF8
Fig. I 0. Moving average flowchart
After conducting moving average filtering, the algorithm wants to locate the R
points. In the implemented system, a point is considered as an R point if the point is not excessively close to the previous R point, the point is above cettain threshold, and the
point is a maximum point.
The interval between two R points is called by R-R interval. This R-R interval is
counted with the help ofvariable 'count'. After conducting a moving average, the system
waits until variable ·count' is higher than 500 samples. This approach is implemented to
avoid calculation based on excessively close maximum points and to make the overall system faster. Even though the overall ECG information ranged from 0.5 to 100Hz [1],
the human heartbeat rarely goes above 4 Hz or 240 bpm Therefore, we can expect that
;i
there is no ョセキ@ R point in ECG signal within ','4 second (500 samples) after the previous
R point Note that if we expect to count a heartbeat faster than 240 bpm, the constant 500 should be lowered.
'
11£:-tRT RA 1E ( 'OlvJl>(T4110N IMPLE/1-JENTEl> ON FIEU> PROURAMM4.RLE (1:4 TEARRAY BOARD
Ivanna K Ti moti us
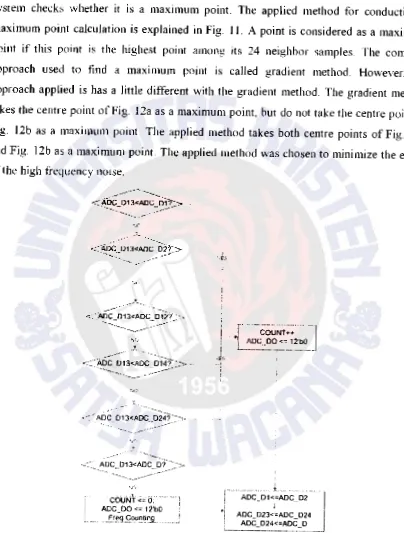
If the count is already higher than 500 samples, the system checks if the data concerned is above the threshold_ After the concerned data is above certain point, the
system checks whether it is a maximum point_ The applied method for conducting a
maximum point calculation is explained in Fig. ll. A point is considered as a maximum point if this point is the highest point among its 24 neighbor samples The common
approach used to tind a maximum point is called gradient method Howevec the approach applied is has a little different with the gradient method. The gradient method
takes the centre point of Fig. 12a as a maximum point, but do not take the centre point of
Fig. l2b as a maximum point The applied method takes both centre points of Fig. I2a
and Fig. 12b as a maximum point. The applied method was chosen to minimize the effect ofthe high frequency noise.
·.r
---_ ... セMM
'·'-'
....
--
----.ᄋᄋaサI」⦅PQS\adc⦅セセj@ .. >
セ@·--.--·
MMMMセMN@ --...
ADC D13<AOC
6?
·.>セ@ セ@ ____ ...
-·
」ッオイMNセエ\セッ[ᄋ@
ADC_DO \セ@ 12'b0
.. ヲイNャAヲLAセou{ャャゥAャ⦅A[AN@
I
l
.. , ADC D23<«ADC 024 ADC_D24<=ADC_O
[image:6.1054.59.487.200.555.2]Techne Jurnallltmah Ekktrotckmka Vol. Y No. l Apnl2010 Hal i 11
frequency 2 kHz. and conducts an eight point moving average filtering to remove the high
frequency noise Theoretically, the moving average filtering is made by adding the last 8
data, then dividing the result by 8. However, a divider is avoided to make the system simple. Therefore, we used three right shifts to replace the divider. The moving average system is explained in Fig 10.
ADC_DAT11
<::::§C_AVR_CNT--0?:;>
MMMMNセMᄋMM
NO
_...-!._,
セ@
--- -AVR -cセ[セQ_^@
.-·NO
YES ADC BUF1 <= adcセdata@ AOC_AVR_CNT++
I
VES ᄋセN@ ADC BUF2 <= ADC DATA ADC_AVR_ CNT++
ADC 0 <= ADC BUF1 + ADC BUF2 + .. + ADC BUF8
Fig. I 0. Moving average flowchart
After conducting moving average filtering, the algorithm wants to locate the R
points. In the implemented system, a point is considered as an R point if the point is not excessively close to the previous R point, the point is above cettain threshold, and the
point is a maximum point.
The interval between two R points is called by R-R interval. This R-R interval is
counted with the help ofvariable 'count'. After conducting a moving average, the system
waits until variable ·count' is higher than 500 samples. This approach is implemented to
avoid calculation based on excessively close maximum points and to make the overall system faster. Even though the overall ECG information ranged from 0.5 to 100Hz [1],
the human heartbeat rarely goes above 4 Hz or 240 bpm Therefore, we can expect that
;i
there is no ョセキ@ R point in ECG signal within ','4 second (500 samples) after the previous
R point Note that if we expect to count a heartbeat faster than 240 bpm, the constant 500 should be lowered.
'
11£:-tRT RA 1E ( 'OlvJl>(T4110N IMPLE/1-JENTEl> ON FIEU> PROURAMM4.RLE (1:4 TEARRAY BOARD
Ivanna K Ti moti us
If the count is already higher than 500 samples, the system checks if the data concerned is above the threshold_ After the concerned data is above certain point, the
system checks whether it is a maximum point_ The applied method for conducting a
maximum point calculation is explained in Fig. ll. A point is considered as a maximum point if this point is the highest point among its 24 neighbor samples The common
approach used to tind a maximum point is called gradient method Howevec the approach applied is has a little different with the gradient method. The gradient method
takes the centre point of Fig. 12a as a maximum point, but do not take the centre point of
Fig. l2b as a maximum point The applied method takes both centre points of Fig. I2a
and Fig. 12b as a maximum point. The applied method was chosen to minimize the effect ofthe high frequency noise.
·.r
---_ ... セMM
'·'-'
....
--
----.ᄋᄋaサI」⦅PQS\adc⦅セセj@ .. >
セ@·--.--·
MMMMセMN@ --...
ADC D13<AOC
6?
·.>セ@ セ@ ____ ...
-·
」ッオイMNセエ\セッ[ᄋ@
ADC_DO \セ@ 12'b0
.. ヲイNャAヲLAセou{ャャゥAャ⦅A[AN@
I
l
.. , ADC D23<«ADC 024 ADC_D24<=ADC_O
[image:7.1054.60.464.122.655.2]Techne Jurnal1lmmh Eh!ktrotekmka VoL Y No. l Apnl 20 l 0 Hal 1 I I
till+>(nl
(a IGudiPnt lV[Ptlto!l: xfll- x(O) • 0 xf::!:] - x:f:\) · 0
xf31- x(.!) 0 xf-l)-x(3)' 0
illt+xful
(bl
AJIJdieod Meothod:
x(O) , x[2] x[ll·x(1) x(3J x(ll x(41· x(2]
Fig. 12 Two different maximum point methods
After a point is considered as a maximum point, the system puts some value at the DAC output and calculates the heart rate. This DAC output is used to see whether all R points are poim out corredly. The heart rate calculation is based on the \·ariable 'count'
which indicates the R-R interval. Given that the ADC sampling frequency is 2 kHz, by
using this variable we can count the heart rate (per minutes) using the following equation:
Hem1 Rate (/min) Sampling: Freq (/seer 60
Ll)Ulll
120000
Count
(3)
For displaying the computed heart rate into seven-segment display, first, we need to determine the hundreds, tenth, and ones value of the heart rate. The method for
conducting the frequency-hundreds is explained in Fig. 13, the analogous method is used
for the tenth and ones. The results are sent to the seven-segment display, which is controlled by a finite state machine (FSM) After the computation is done, the variable
count starts from zero again, for the next R-R interval. Then, the data buffer is renewed
for the next moving average and maximum point calculation.
'
I
HEART RATE COllc/PUJATUJN IMPLEME.'VT£[) OI\' FIELD PROUR4MMABLE (i4 TE ARR4Y BlJAR/)
lvonna K Timol!l!S
FREQ
NO
NO
NO
v
I
BC0100<«'1 000"I •
FS •. FRE010-<=FRE0-800 ,BC0100<="0000' FREQ1D<=FREQ
セM FR£.()10
Fig. 13. Frequency-hundreds approach
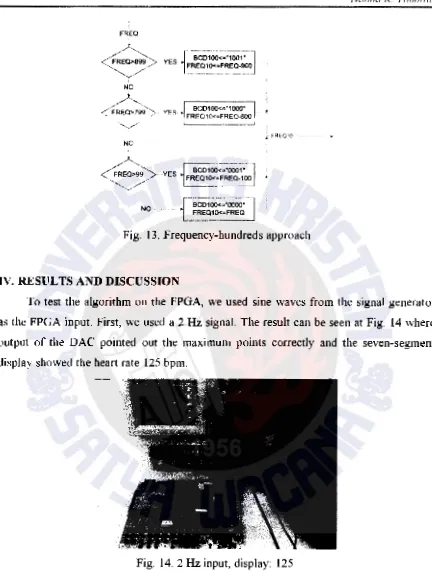
IV. RESULTS AND DISCUSSION
To test the algorithm on the FPGA, we used sine waves from the signal generator
as the FPGA input. First, we used a 2 Hz signal. The result can be seen at Fig. 14 where
output of the DAC pointed out the maximum points correctly and the seven-segment display showed the heart rate 125 bpm.
Fig. 14. 2Hz input, display: 125
The highest heart rate that this system can handle is 4 Hz or 240 bpm The results
can be seen at Fig. 15. This limitation is due to the approach that the minimum R-R
[image:8.1054.183.365.69.198.2]Techne Jurnal1lmmh Eh!ktrotekmka VoL Y No. l Apnl 20 l 0 Hal 1 I I
till+>(nl
(a IGudiPnt lV[Ptlto!l: xfll- x(O) • 0 xf::!:] - x:f:\) · 0
xf31- x(.!) 0 xf-l)-x(3)' 0
illt+xful
(bl
AJIJdieod Meothod:
x(O) , x[2] x[ll·x(1) x(3J x(ll x(41· x(2]
Fig. 12 Two different maximum point methods
After a point is considered as a maximum point, the system puts some value at the DAC output and calculates the heart rate. This DAC output is used to see whether all R points are poim out corredly. The heart rate calculation is based on the \·ariable 'count'
which indicates the R-R interval. Given that the ADC sampling frequency is 2 kHz, by
using this variable we can count the heart rate (per minutes) using the following equation:
Hem1 Rate (/min) Sampling: Freq (/seer 60
Ll)Ulll
120000
Count
(3)
For displaying the computed heart rate into seven-segment display, first, we need to determine the hundreds, tenth, and ones value of the heart rate. The method for
conducting the frequency-hundreds is explained in Fig. 13, the analogous method is used
for the tenth and ones. The results are sent to the seven-segment display, which is controlled by a finite state machine (FSM) After the computation is done, the variable
count starts from zero again, for the next R-R interval. Then, the data buffer is renewed
for the next moving average and maximum point calculation.
'
I
HEART RATE COllc/PUJATUJN IMPLEME.'VT£[) OI\' FIELD PROUR4MMABLE (i4 TE ARR4Y BlJAR/)
lvonna K Timol!l!S
FREQ
NO
NO
NO
v
I
BC0100<«'1 000"I •
FS •. FRE010-<=FRE0-800 ,BC0100<="0000' FREQ1D<=FREQ
セM FR£.()10
Fig. 13. Frequency-hundreds approach
IV. RESULTS AND DISCUSSION
To test the algorithm on the FPGA, we used sine waves from the signal generator
as the FPGA input. First, we used a 2 Hz signal. The result can be seen at Fig. 14 where
output of the DAC pointed out the maximum points correctly and the seven-segment display showed the heart rate 125 bpm.
Fig. 14. 2Hz input, display: 125
The highest heart rate that this system can handle is 4 Hz or 240 bpm The results
can be seen at Fig. 15. This limitation is due to the approach that the minimum R-R
[image:9.1054.48.480.60.638.2]Jurnal Ill inh EJ J I - I J
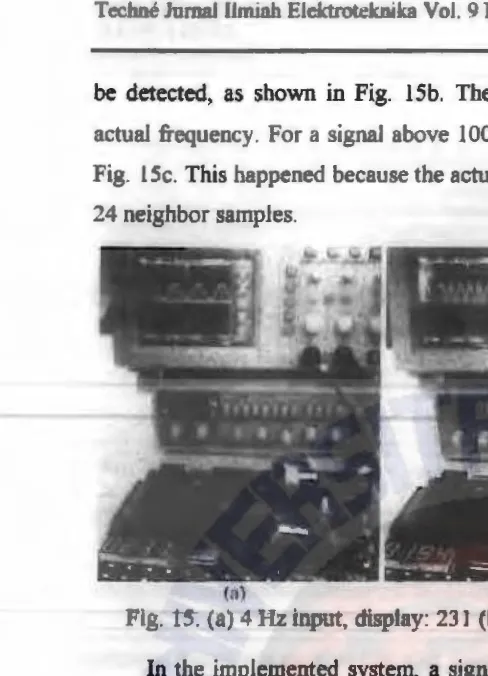
be detected, as shown in Fig. 15b. Therefore, the heart rate display is lower than the
actuaJ frequency. For a signal above lOO Hz, no maximum point is detected as shown in
Fig. L Sc. This happened because the actuaJ maximum points are not the highest among its
24 neighbor sa mpl es.
W
M
セ@Fig. 15. (a) Hz input. display: 23 J (b) J 0 Hz input, display: 194 (c) 100Hz input
In the implemented system, a signal is consider as a maxi mum point if the signal
magnitude is higher than 80 mV as shown in Fig. 16a. If the signal is lower than 80 mV,
no maximum point is detected as shown in Fig. 16b.
(a) (b)
Fig.
o.
(')2Hz, J 00 mV input, display: 123 (b) 2Hz, 80 mV input, displa : 26T
es1
o ll yst • we connect the ECG circuit to uman and the result isshow in Fig. 7. As sho\ in the figure, all R p ints re detected co rr I . Tl e di pia
shown in the seven-segment display indicates the real time heart rate.
'
'HEART RATE 0 IPUTA.TION l fPLEMEN1 DON FIE D PROGRAM ,(]JL£ GATE ARRA BOARD
1 anna K Timotius
Fig. 17. Detected R points of a ECG signal
Thi paper describ done os ible method to detect electrocardiogram (ECG) i nal.
count the R-R interval of the ECG signal, and compute the heart rate. In the fu ture, an
algorithm to detect the other points and give some information regarding the heart rate
ariability (HRV)
will
compl t this research.ACKNOW L EDG E:MENT
The author would to acknowledge Wei-Chih Hu, Ph.D . (Chung Yuan Christian
University, Taiwan) fo r lending me FPGA board and electronic components, Patricia
Angela Abu for t he heJp in understanding FPGA and Quartus software, Kimberly Jane
Uy for making the ECG circuit, and many other friends in their help.
REFERENCES
I. "Basic prin iples of design an ECG amplifier - sensitivity otentials]; frequency
response; common mode ejection ratio," http:// perfusion com.au
2. "Active Filter Design Techni ues, Literature Number SLOA088," Texas Instrument
3. Altera Cyclone choolboy nuaJ
[image:10.1051.14.502.36.712.2]Jurnal Ill inh EJ J I - I J
be detected, as shown in Fig. 15b. Therefore, the heart rate display is lower than the
actuaJ frequency. For a signal above lOO Hz, no maximum point is detected as shown in
Fig. L Sc. This happened because the actuaJ maximum points are not the highest among its
24 neighbor sa mpl es.
W
M
セ@Fig. 15. (a) Hz input. display: 23 J (b) J 0 Hz input, display: 194 (c) 100Hz input
In the implemented system, a signal is consider as a maxi mum point if the signal
magnitude is higher than 80 mV as shown in Fig. 16a. If the signal is lower than 80 mV,
no maximum point is detected as shown in Fig. 16b.
(a) (b)
Fig.
o.
(')2Hz, J 00 mV input, display: 123 (b) 2Hz, 80 mV input, displa : 26T
es1
o ll yst • we connect the ECG circuit to uman and the result isshow in Fig. 7. As sho\ in the figure, all R p ints re detected co rr I . Tl e di pia
shown in the seven-segment display indicates the real time heart rate.
'
'HEART RATE 0 IPUTA.TION l fPLEMEN1 DON FIE D PROGRAM ,(]JL£ GATE ARRA BOARD
1 anna K Timotius
Fig. 17. Detected R points of a ECG signal
Thi paper describ done os ible method to detect electrocardiogram (ECG) i nal.
count the R-R interval of the ECG signal, and compute the heart rate. In the fu ture, an
algorithm to detect the other points and give some information regarding the heart rate
ariability (HRV)
will
compl t this research.ACKNOW L EDG E:MENT
The author would to acknowledge Wei-Chih Hu, Ph.D . (Chung Yuan Christian
University, Taiwan) fo r lending me FPGA board and electronic components, Patricia
Angela Abu for t he heJp in understanding FPGA and Quartus software, Kimberly Jane
Uy for making the ECG circuit, and many other friends in their help.
REFERENCES
I. "Basic prin iples of design an ECG amplifier - sensitivity otentials]; frequency
response; common mode ejection ratio," http:// perfusion com.au
2. "Active Filter Design Techni ues, Literature Number SLOA088," Texas Instrument
3. Altera Cyclone choolboy nuaJ
[image:11.1051.5.495.29.767.2]