JUDICIAL INDICATOR COMPARISONS:
BUDGETS OF JUSTICE, CRIME AND
CONVICTIONS, CIVIL AND
ADMINISTRATIVE LITIGATION
Erhard Blankenburg
Abstract
In this paper.the author tries to compare systems of justice in money terms. It is argued that this paradoxical approach might still be the easiest of comparative endeavors. This paper presents a cross-cutting camparative analysis on systems of justice among similarly rich western countries as well as between Western EU countries and their post-communist new members. Gross and nett budgets for judicial expenditure, cost of legal aid, definition of crime, discrepancy between police crime rates and court convictions, and duration of litigation procedures are properly analyzed. However, some puzzling questions concerning these indicators remain unanswered.
Keywords : Cost of jusdce, Jusdce system,Litiglllion cost.
justice. They aim at unifonn standards of judicial services. Court reforms are couched in terms of managerial control of procedures and courts. They easily forget the first step which would be to try and grasp the different tasks which the judiciary would have to fulfil. The notions of what the national systems of justice are the expected to provide differ from one country to the next. However, paradoxical as it might seem, by measuring them against uniform indicators like money, personnel and casework we can demonstrate, how far their respective concepts of 'justice' differ and in how far they converge.
An idea of the priorities set by the national systems of justice can be gained by comparing their public costs. It is quite a challenge to explain the budget differences of courts and prosecution compared to those of police and to prisons among the rich Western countries, but compared to the enormous differences of costs between the United States of America on the one hand, the Japanese on the other the European budgets (including those of Canada and other Commonwealth countries) their share of the national Income (GOP) looks rather alike.
We must caution, however, that the way budgetary data are assembled and presented, may vary considerably. At least among the European countries we can point out some corrections with respect to gross and net expenditures (taking revenues into account) and with respect to various specialized courts (in particular labour courts, administrative, social and fiscal tribunals).
Nevertheless, comparing systems of justice in money tenns might still be the easiest of the comparative endeavours we are going to undertake. Money seems a universal indicator as long as we count it in official valuta terms. It might look different, if we look at national buying power: after all, the costs of justice are largely detennined by personnel costs which relate to the relative living standards of the judges, prosecutors and clerks who are paid salaries. This comes out in the comparisons of Western European and Central European countries which we are comparing below (and it would be even more apparent, if we include some of the non-EU countries in Eastern Europe which at least are members of the Council of Europe). All of these economic relativities notwithstanding, the public budgets which countries spend on their systems of justice can lead our exploration of their judicial priorities.
adversarial judicial decision parties have many exits: one party may not appear and face a default, they both may agree on settlement either in or outside of court. Court rules and procedural law can influence the volume of these choices. And even more fundamental: substantive law may determine as 'crime' what in another country is considered as minor deviance or even 'normal' behaviour, and civil law may consider as a judiciable 'case' which in another country may be treated by out of court conflict handling.
Nevertheless again, the conceptual differences can be described and they remain marginal to the overall convergence of modern systems of justice. They are a challenge to refming indicator comparisons, not an invitation to capitulation.
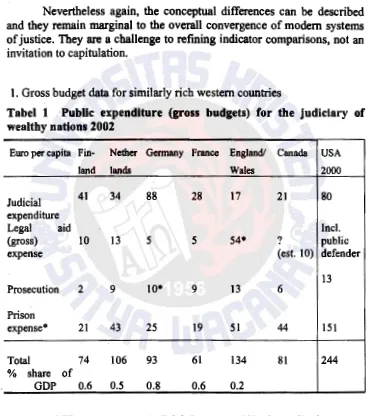
1. Gross budget data for similarly rich western countries
Tabel 1 PubHe expenditure {gross budgets) for the judiciary of wealthy nations 2002
Euro per capita Fin- Nether Gennany France England/ Canada USA
land lands Wales 2000
Judicial 41 34 88 28 17 21 80
expenditure
Legal aid Incl.
(gross) 10 13 5 5 54* ? public
expense (est. 10) defender
13
Prosecution 2 9 10* 9 13 6
Prison
expense* 21 43 25 19 51 44 151
Total 74 106 93 61 134 81 244
% share of
GDP 0.6 0.5 0.8 0.6 0.2
Sources: CEPEJ, European Judicial Systems 2002, Council of Europe, Strasbourg 2004.
[image:3.480.61.428.125.541.2]comparison omits labour courts in Germany as well as all costs which are not part of the national I state budgets of justice such as local (magistrate) courts in UK and France.
Prison operating costs information from Ministerie van Justitie, Den Haag 2000. Finland prison costs 1995 according to European Sourcebook CDPC.
• Canada· and US data taken from Min. Justice Den Haag 2000. Valuta as ofOct. 1999
Table 2 : Share of judiciary and of the prison system in the (gross) budgets of the national departments of justice 1999.
%ofbudget Finland Nether Germany France Italy Spain I Portu- England/
lands 1995 gal Wales
-judiciary 57% 49% 57% 43% 64% 69% 72% 17%
-legal aid 13% 15% 7% 5% 0.4% 38%
-prisons 28% 36% 36% 52% 36% 31% 28% 45%
Source: IRSIG-CNR, European Data Base on Judicial Systems, Bologna 2000 Not including labour courts in Germany ECU currency is the predecessor val uta of the European Union corresponding since 2002
It is obvious that the priorities and the ambitions which these systems of justice are to fulfil must be quite different.
The most outstanding comparative fact is the immensely high level of expenditure on both judiciary as well as prisons in the US, far higher than Canada and England/Wales (as well as all other common law countries)
A second remarkable observation. Germany spends a extraordinarily high amount of national budgets on courts and prosecution services, it is the only country in the comparison of rich countries in the Western world which pays more tax money for the judiciary than for prisons.
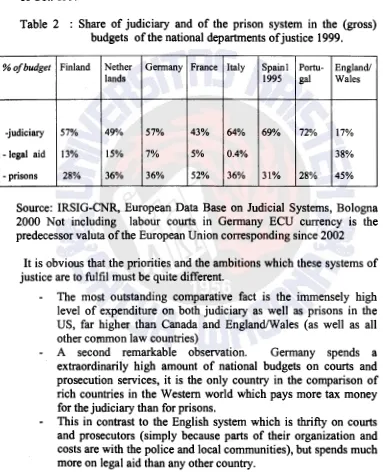
[image:4.480.35.418.128.604.2]2. Costs minus revenues: Net budget data
Revenues as a major budgetary item for the courts may seem a strange notion in some countries (such as France, Spain or Portugal), but others have developed a range of income sources which some courts manage quite skilfully. They are gained by fees and by fines imposed by courts, and to a lesser degree by prisons.
Many countries cover a small part of the costs of civil and administrative courts by raising court fees for each procedure, others do not do that all. They also gain revenues by court imposed fines, but how much that is depends on fiscal rules which leave some fines to be levied by communities (parking) or police (traffic fines), and others (more or less) to the courts.
In both cases revenues are not directly related to the costs of judicial services:
Fees are not determined by costs and time spent, but rather by fixed schemes, so that they form a mixed calculation where the mass of short routine procedures usually subsidizes the more elaborate long procedures (particularly if these are fought about small amounts at stake). The idea of public services does not allow for a strict price allocation by time and effort spent (as do hourly fees of lawyers}, but rather by some kind of re-distributive scheme.
total costs of court business relating to the civil courts. The figure includes charges for accommodation, judicial salaries, and the proportion of management costs attributable to the civil courts but it does not include capital costs. ·
The logic is different as far as the second, mostly bigger sort of revenues are concerned: fines imposed by courts. If the offenders are charged before court, or if they protest an administrative fme and thus have to appear in court, they will benefit their budgets. This also includes
transaction fees by the prosecution which are used for the mass of petty crime by French, Belgian and Dutch prosecutors. The degree to which penal and administrative fines go to court varies, but usually, fines imposed by police and by communities (p.e. for parking and traffic offences) are budgeted with fiscal authorities. Even within single countries coverage can vary: among the German states they vary from almost 100 % coverage in Bavaria and Baden-Wiirttemberg, to 40% in others, with an average c:>f 57%. But usually, fines imposed by courts as well as settlement fees are budgeted with the judicial services. They can cover a great deal of judicial costs. (A unique invention has been introduced in Germany with art. 153 a StPO which allows to allocate settlement fees to charitable organizations.)
Table 3 : Gross and net budgets of the judiciary 1995
Dpt. of Justice Germany Nether United
Budgets 1995 lands Kingdom
ECU per capita
Judiciary Civil justice
- expenditures 87,6 33.1
-
revenues -57% -60% 91%-
(fines, coUrt fees settlement fees)Net budget* 37.4 23.5
[image:6.483.53.424.73.567.2]Table 3 shows the effect of revenues for four countries where the judicial budgets receive considerable revenues from court fees and imposed fines. Elegant (in budgetary terms) are settlement fees which prosecutors may offer in Gennany and in the Netherlands. Soine other countries (France, England/Wales) only publish gross data, which may be a partly explanation of their low budgets for the judiciary. However, some judiciaries such as the Spanish, the Italian and Portuguese do not -as far -as we know and apart from prison revenues- gain significant revenues.
Germany stands out with the most extensive court system in Western Europe, but it manages to cover more than half of its costs by revenues. This way the overall budget comes close to the Italian or Portuguese expenditures which are hardly compensated by revenues. Other countries like Austria, England/Wales and The Netherlands stay well below their expenditures, and as they receive considerable revenues, they remain with a relatively low net budget. In France and England we did not receive budgetary data on revenues so that we can only compare the net budget.
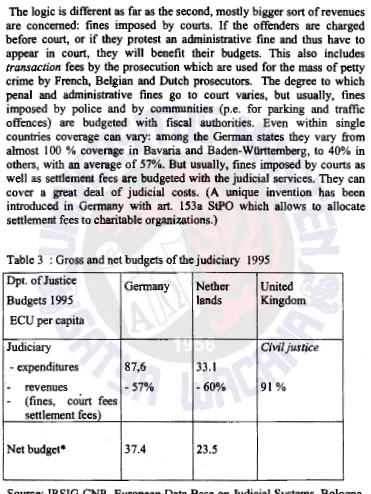
3. Western European comparison under French auspices.
The most precise and well documented budget comparison of five European Union countries has been attempted by Douat et al (200 1 ). It specifies personnel costs in detail and analyses their the growth rates in judicial budgets from 1990 to 1997. it is clearly French inspired by including institutions of probation and supervision of juveniles which in . other countries mostly resort with communal social services. The results give somewhat higher budgets than our overview in table 4 (without always being able to trace the divergence to the data sources) which is mainly due to the inclusion of local budgets (British magistrates' courts being pid for by towns and communities, French courts of first order (like first instance prud 'hommes for labour conflicts as well as administrative and fiscal tribunals). Also 90% of juvenile protection in France is on budgets of the (regional) departements, only 10% in the national budget.
Table 5 : Overall budgets and juvenile protection
France Belgium Germany Italy United Spain
ECU per capita Kingdom
Gross judicial expenditure
Incl. prisons, legal aid, 108.6 113.2 164.9 98.8 161.4 44.7 juvenile supervision
... ofthese 53 29 10 2.3 0.5
•
Juvenile protection
Source: Douat et al, Paris 200 l. Including local budgets of magistrates courts in UK/ regional budgets ( departemental ) for courts of 1st order as well as juvenile protection in France/Figures for Germany include labour courts
The French study includes more expenses than the two studies above, for France this amounts to almost 80% higher costs. It applies a broader concept of the 'system of justice' due to including a greater range of judicial tasks, such as juvenile protection which the French concept of the "justice system" includes. Part of the effect is also due to (rightly) including local budgets of magistrates courts in UK, regional budgets (departemental) in France and labour courts in Germany, while other studies have been restricting themselves to national judicial budgets.
Sometimes a mix of gross and net data adds to the confusion. Nevertheless, all three studies agree in the rank order of their public expenditures as well as in rough volume of the national justice systems and their main components.
4. Legal aid as a cost factor
of justice means including parts of the forensic activity of the lawyer profession in the concept of"public costs of justice".
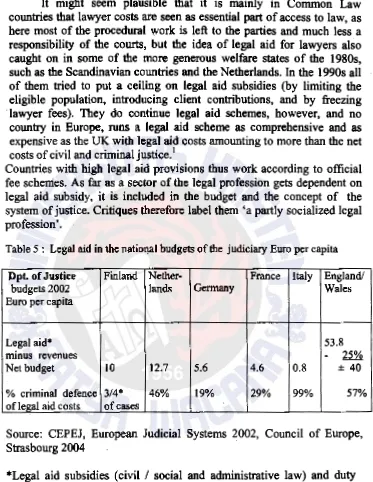
It might seem plausible that it is mainly in Common Law countries that lawyer costs are seen as essential part of access to law, as here most of the procedural work is left to the parties and much less a responsibility of the courts, but the idea of legal aid for lawyers also caught on in some of the more generous welfare states of the 1980s, such as the Scandinavian countries and the Netherlands. In the 1990s all of them tried to put a ceiling on legal aid subsidies (by limiting the eligible population, introducing client contributions, and by freezing lawyer fees). They do continue legal aid schemes, however, and no country in Europe, runs a legal aid scheme as comprehensive and as expensive as the UK with legal aid costs amounting to more than the net costs of civil and criminal justice. 1
Countries with high legal aid provisions thus work according to official fee schemes. As far as a sector of the legal profession gets dependent on legal aid subsidy, it is included in the budget and the concept of the system of justice. Critiques therefore label them 'a partly socialized legal profession'.
Table 5 : Legal aid in the national budgets of the judiciary Euro per capita
Dpt. of Justice Finland Nether- France Italy England/
budgets 2002 lands Germany Wales
Euro per capita
Legal aid* 53.8
minus revenues
-
25%Net budget 10 12.7 5.6 4.6 0.8 ± 40
% criminal defence 3/4* 46% 19% 29% 99% 57%
of le_g_al aid costs of cases
Source: CEPEJ, European Judicial Systems 2002, Council of Europe, Strasbourg 2004
*Legal aid subsidies (civil I social and administrative law) and duty solicitors (criminal defence) in most countries remain within the judicial
11 See my comparative overview on Lawyers' Lobby and the Welfare
[image:9.478.82.455.39.521.2]budgets, while in England/Wales and The Netherlands they are listed separately. 25% of the English legal aid expenses are recovered by revenues, in NL contributions by clients are being raised several times since 1995, revenues not shown in the budget above.
For a policy evaluation of the expenses for legal aid, it is important to distinguish those for criminal defence from those in other fields of law, as well as those for representation in court from programs for consultation out of court. British, Scandinavian and Dutch legal aid include an infrastructure for out of court consultation, the French program has been financing some local institutions to that effect. As far as that is not spent for criminal defence, it concerns clients with social insurance, immigration and dismissal problems.
All other countries mainly support court fees and lawyer fees in court. Most of the non-criminal legal aid is spent for representation in divorce procedures (particularly in the German court fee law).
S. Western European Union compared to post-communist new members
It took little more than ten years for the new member states of the European community to reconstruct their national legal institutions from soviet-inspired law. New Constitutions were enacted or the old ones amended, constitutional review and administrative courts established, independence of the judiciary from politics was safeguarded and criminal prosecution separated from the courts. (Slovenia had already realized some of these standards while being part of Yugoslavia.) Rule of law standards of the European Union were enforced during the years of negotiations for membership. At the time of official membership in 2002 the legal system was effectively westernized, but a much lower economic level still left quite a gap to be filled up.
All of the countries in our comparative sample have seen fast growing law sctiools and a wave of new attorneys being admitted. In the post-communist countries some of them came changing job description from former economic (and political) consultants. Consequently, lawyer density is rising quickly, but still remaining well below the West-European countries. (Particularly that of Italy and Spain where registering as advocate can be a status achievement rather than indication of forensic activity.)
explains it as a consequences of the low salary levels in Central Europe. The lower economic level is also responsible for legal aid being mostly absent (table 6), even though it might have been particularly urgent after the political turnover and at the beginning of an entirely new legal system.
·Table 6 : Attorneys, judges 1990 and 2002, budgets of the judiciary 2002
·
1
G
0
1lH1
NMセ@
6
Lawyers
1 ()() ()()() inhabitants Finland Nether Germany France Italy Spain England/
lands Wales
Attorneys 1990 43 72 33 105 208 150
2002 33 77 ll4 68 225 259 197
Prof. Judges 1990
.s . .s
28 ? 10.4 8.0 4 2002 17 11,3 25.3 10.4 11.7 9.8 4.2 Public expenditureper capita
-
courts 41 41.0 53.2 28.4 46.0 23.5 16.9-
legal aid10 12.7 5.6 4.6 0.8 ? 53.8
Lawyers per
100 000 inhabitants/ Estonia Poland Czech Hungary Slovenia
gross expenditure per republic
capita
Attorneys 1990 <10 16 20 17 23
2002 68 69 72 84 47
Prof. Judges 1990 12 16 21 20 20
2002 17.5 20.3 26.6 27.2 39.4
Public expenditure per capita
·courts 12.2 17.3 21.0 27.0 51.4
-legal aid 1.0 0.4 0.8 ? ?
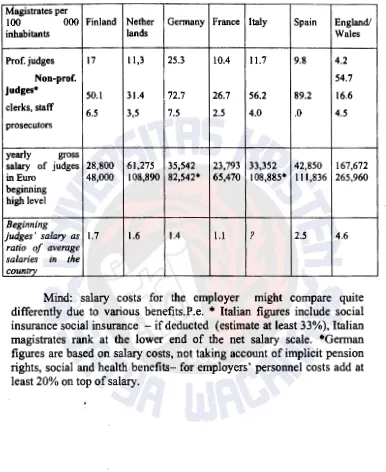
Table 7 : Professional magistrates per 100.000 inhabitants (2002)
- gross salaries and ratio of magistrates/ staff
Magistrates per
100 000 Finland Nether Germany France Italy Spain England/
inhabitants lands Wales
Prof. judges 17 11,3 25.3 10.4 11.7 9.8 4.2
Non-prof. 54.7
judges*
50.1 31.4 72.7 26.7 56.2 89.2 16.6 clerks, staff
6.5 3,5 7.5 2.5 4.0 .0 4.5
prosecutors
yearly gross
salary of judges 28,800 61,275 35,542 23,793 33,352 42,850 167,672 in Euro 48,000 108,890 82,542* 65,470 108,885* 111,836 265,960 beginning
high level
Beginning
judges' salary as 1.7 1.6 1.4 1.1 ? 2.5 4.6 ratio of average
salaries in the country
[image:12.481.48.434.60.532.2]Professional
magistrates per Estonia Poland Czech Hungary Slovenia
100 000 inhabitants .Republic
judges 17.5 20.3 26.6 27.2 39,4
prosecutors 12.5 14.5 10.5 14.0 8,5
clerks, staff 17.5 20.3 26.6 27.2 39.4
yearly gross salary of
judges in Euro 18,744 12,563 15,153 17,239 22,084
beginning 25,776 22,100 47,100 44,165
high level 33,695
Beginning judges'
salary as ratio of 3.8 1.9 2.5 3.0 ?
average salaries in the country·
Source: CEPEJ, European Judicial Systems 2002, Council of Europe, Strasbourg 2004
Most of the costs of the justice system are paid for personnel.. Thus, it should not surprise that salaries and size of personnel explains most of the cost differences in expenditure.
- Numbers of judges (in comparative terms 'magistrates') in Germany range high among the Western countries, they are more than matched by post-communist countries with a pre-war Austrian tradition. The greater size of their prosecutors' staff may still be seen as a legacy of the communist times, in spite of politicallustration maintaining more staff than in Western Europe. Salaries, however, are much lower in post-communist countries, so that in tenns of all-over costs of the judiciary Germany remains champion .
In Italy and Spain considerable numbers of non-professional magistrates are fulfilling (part-time) judicial tasks, while the German judiciary (and other German language countries) stick to a strict privilege of professional judgeship. They do, however, employ court clerks who fulfil routine tasks (Rechtspjleger Amtsanwiilte) with quasi- judicial authority. In the French budget study these are included among 'non-professional magistrates'.
average court clerks. The post-communist countries employ a rather high number of professional magistrates, but less than average staff-possibly a legacy of the low salaries of professional magistrates and of few court clerks before the change-over.
Post-communist countries have a considerably lower salary level, particularly with respect to higher levels of the career. Nevertheless, young judges gain considerably more than an average income in their country which is much lower than in the European West. The rather high numbers of judges and staff may be taken for granted by the dilemma of having to continue personnel from earlier times as well as trying to renew the ranks with younger law school graduates. Political attempts in a rather well developing country like Slovenia on getting young law graduates to choose for a judicial career at the same time as the numbers of the judiciary as a whole are to be reduced show the dilemma.
The British system falls out of the Continental pattern altogether. It
rests on a great number of (moderately paid) magistrates with a small number of (highly paid) professional judges on top of the scale. It
employs few (well paid) professional judges and a moderate staff of court clerks on the national budget. More personnel is (very moderately) paid by communities in local magistrates courts. The British device of saving personnel costs builds on 'non-professional magistrates' fulfilling judicial tasks, these are partly salaried, often part-time without university degree but with practical expertise and some training.
6. Measuring criminal justice: what is crime?
if they see no chance to clear them. They report only those which are "cleared" i.e. if the police names a suspect. Police in France reports 60% of all prosecutor. cases are without suspect, another 28% are dropped ( "sans suite").In most countries prosecution statistics count all registered crime reported to the police disposing (far) more than half of it as uncleared ('suspect Unknown'), others are dropped because they seem to petty to take action. Other countries (such as the Netherlands and Italy) count only those which have been cleared by indicating at least a suspect. Minor delinquency might be done away by penal order (the German Strajbefehl) or negotiated non-judicial retribution in (§ 153 StPO).). The Netherlands allow for disposal by a settlement fee
(transactie).
England/Wales, the Czech Republic an Hungary allow the police to sanction petty crime without reporting to the prosecution, the . Netherlands allow for alternative sanctions for juveniles under a
summary agreement with prosecution.
What counts as caseload of courts are those which are charged. It seems clear that prosecution disposals need interpretation before being taken as indicator of delinquency. The European sourcebook of crime for 1995 and 2000, which reports only cases which are considered within the scope of crime, shows constan or lower levels in Western Europe, but an overall increase in all post communist countries (which they have seen since 1990). While some Western European countries (such as the Netherlands) saw diminishing crime rates (of police registration as well as victim surveys) in recent years which also relieved the courts of some of their caseload.
However, the media and the general perception still believe in crime nsmg They remain impressed by a few spectacular cases, particularly if violence in the streets or public transport is involved. Statistically they form a minority, car theft or pick pocketing (not to speak of bicycle theft or shoplifting) count for much more volume. Statistically the treatment of minor crime makes a difference, including such conceptual policy issues as the treatment of drug users and drug trafficking. If drug users in Bavaria (or Sweden) are arrested, while they · are tolerated in northern Germany (or Holland), the volume of
prosecution and court statistics looks significantly different. Comparing their rates would assume that the composition of crime would be similar. Thus, we can only use them in order to ask the right questions as to what is hiding behind obvious country differences.
they include violations reported by customs and local authorities, alien law and other·violations (p.e. not paying TV and radio permits). On the other hand, they do not imply petty delinquency (p.e. of juveniles) which (in countries with so called 'opportunity' discretion) the police might not have cared to report to the prosecution. Prosecution and court cases in the (quantitatively relevant) sector of petty violations therefore differ from those of the セイゥュ・G@ figures of the police. However, in general the rank order of the various countries remain the same.
Finland gives the best example for the inflation of crime rates. Its highest rank among the police crime rate in Europe might be mitigated by considering that 20% of it concern traffic offences: hazardous driving , and ftrSt of all driving under alcohol. Nevertheless, Finland still rests above the West European average on homicide or ot:Qer clearly defined delinquency, ranging below only when compared to Estonia and Poland (see table 10 and the discussion of single types of crime).
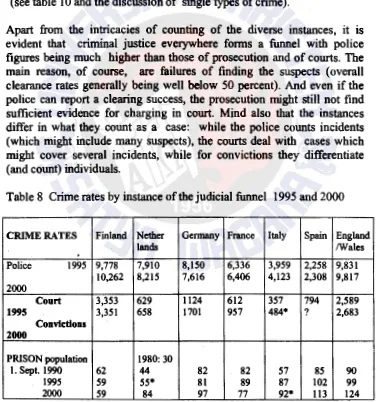
[image:16.482.55.435.211.613.2]Apart from the intricacies of counting of the diverse instances, it is evident that criminal justice everywhere forms a funnel with police figures being much higher than those of prosecution and of courts. The main reason, of course, are failures of finding the suspects (overall clearance rates. generally being well below 50 percent). And even if the police can report a clearing success, the prosecution might still not find sufficient evidence for charging in court. Mind also that the instances differ in what they count as a case: while the police counts incidents (which might include many suspects), the courts deal with cases which might cover several incidents, while for convictions they differentiate (and count) individuals.
Table 8 Crime rates by instance of the judicial funnel 1995 and 2000
CRIME RATES Finland Nether Germany France Italy Spain England
lands /Wales
.
Police 1995 9,778 7,910 8,150 6,336 3,959 2,258 9,831 10,262 8,215 7,616 6,406 4,123 2,308 9,817 2000
Court 3,353 629 1124 612 357 794 2,589
1995 3,351 658 1701 957 484• ? 2,683
Convictions 2000
PRISON population 1980:30
1. Sept 1990 62 44 82 82 57 85 90
1995 59 55• 81 89 87 102 99
Estonia Po1and Czech Hungary Slovenia
CRIME RATES Republic
Police 2,667 2,525 3,638 4,876 2,019
1995 4,038 3,278
2000
3,811 4,445 3,614
Court 540 506 523 938 207
1995 717 577 615 1,034 358
Convictions
-2000
Prison population
1990 146* 42
1995 163* 188 122 32
2000 329 169 210 153 59
*data of previous year.
Source: European sourcebook of crime and criminal justice statistics, Den Haag 2003.
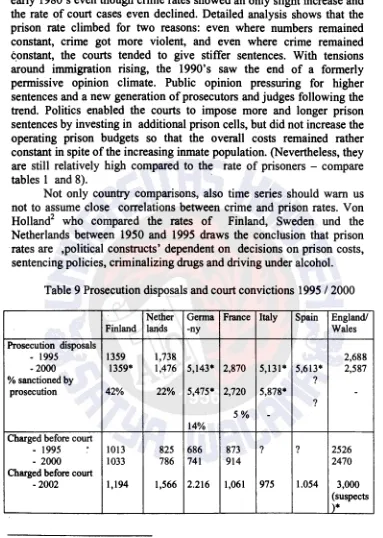
Whatever the counting, crime indicators at the police as well the prosecution are dominated by mass delinquency. If police incidents get cleared and presented to the prosecution at all, they are dealt with by summary procedures end up with penal orders or settlement fmes. Criminal justice of hooliganism and small theft is bureaucratic routine, with registration and possible court appearance of those who re-appear as multiple offenders. (In Table 9 most courts statistics do not include such prosecutor disposals, only Finland and Germany account for 'penal orders 'as charged before court'. Consequently their court figures are . rather high. Prison rate in table 8, however, show here as well as in other Western countries less than 1 0 percent are convicted to prison sentences.
In post-communist countries, except Slovenia, prison rates are much higher, Immediately after 1990 they had been reduced from their high level in communist times (due to releasing many convicts for political reasons), but with crime levels rising throughout the 1990s, the prisons tilled again above the rate before turnover of communist
regimes. ..
early 1980's even though crime rates showed an only slight increase and the rate of court cases even declined. Detailed analysis shows that the prison rate climbed for two reasons: even where numbers remained constant, crime got more violent, and even where crime remained c_onstant, the courts tended to give stiffer sentences. With tensions around immigration rising, the 1990's saw the end of a formerly permissive opinion climate. Public opinion pressuring for higher sentences and a new generation of prosecutors and judges following the trend. Politics enabled the courts to impose more and longer prison sentences by investing in additional prison cells, but did not increase the operating prison budgets so that the overall costs remained rather constant in spite of the increasing inmate population. (Nevertheless, they are still relatively high compared to the rate of prisoners - compare tables 1 and 8).
Not only country comparisons, also time series should warn us not to assume close correlations between crime and prison rates. Von Holland2 who compared the rates of Finland, Sweden und the Netherlands between 1950 and 1995 draws the conclusion that prison rates are ,political constructs' dependent on decisions on prison costs, sentencing policies, criminalizing drugs and driving under alcohol.
Table 9 Prosecution disposals and court convictions 1995 I 2000
Nether Germa France Italy Spain England/
Finland lands -ny Wales
Prosecution disposals
- 1995 1359 1,738 2,688
-2000 1359• 1,476 5,143• 2,870 5,131• 5,613• 2,587
% sanctioned by ?
prosecution 42% 22% 5,475• 2,720 5,878•
-?5%
-14%Charged before court
- 1995
.
1013 825 686 873 ? ? 2526- 2000 1033 786 741 914 2470
Charged before court
-2002 1,194 1,566 2.216 1,061 975 1.054 3,000 (suspects
1.
2
[image:18.480.46.429.18.556.2]Czech
Estonia Poland Republic Hungary Slovenia
Prosecution disposals
- 1995 2,595 1,493 ? 886
-2000 3,970 1,697 ? 1,060 1,123
% sanctioned by
prosecution 17%
-
10%-Charged before court
--
-
1995 396 573 673 533-
- 2000 461 623 ? 700 666Charged before court
-2002 652 1,024 756 1,039 737
(suspects)
Mind different data sources: Disposal by prosecutor and charges 1995/ 2000 according to European sourcebook of crime and criminal justice statistics, Den Haag 2003. Charges before court 2002 according to CEPEJ, Strasbourg 2004* Germany, Italy and Spain include all cases reported even if no procedure is opened. The Czech Republic, Estonia and Hungary include procedures against unknown offenders, in France, Poland and Slovenia these are deducted. In Slovenia and :England 2002 suspects are counted, while all others count cases (often with multiple suspects).
Of course, any overall rates of crime and criminal justice remain rough as long as they are not differentiated by specific violations and charges. Many of the classifications change, first at the police, then with prosecution and courts, particularly if we want to confront them with independent survey data of the victims of crime. But a few types of crime we can follow throughout the criminal justice funnel: homicide is a good candidate, because we have independent registrations of the police, the courts and hospitals resp. doctors. Police data if they include 'attempts' are often inflated3, but we can compare the completed' cases
3 The most hilarious case are the Netherlands which in 2002 was singled
to data from the health services. Domestic4 burglary is another candidate, as we can compare the crime rates (per 100 000 of the population) with victim surveys (per 100 households). Drug related crime is most revealing as countries follow different strategies with ·respect to criminalizing drug users. Countries like the Netherlands (also some German states) do not treat drug users as criminal offenders, but charge hard drug dealing and sentence drug trafficking rather stiffiy. Thus court convictions are high, even their police rates for drug s remain low. The contrary holds true for Germany, Austria or France. Higher on all accounts of crime indicators are England/ Wales.
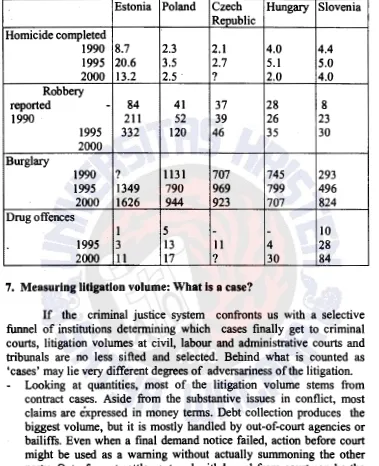
Post communist countries generally rank much higher on most types of crime, but (in 2000 still) lower than Western Europe on drug offences. Homicide is high (with Estonia beating all records), and so is burglary whether domestic or overall. As we saw in table 8, the prison population is correspondingly high.
Ta le 10 : Cnme rates or b fi diffi erent types o cnme 200 f . 0
Finland Nether Germany France Italy Spain England
lands /Wales
Homicide
Police incl. attempt 9.9 17.4* 3.8 4.0 4.3* 3.0 3.0 Police completed 3.4 1.4 1.6 2.1 1.5* 1.2 1.2 Health service 2.6 1.3* 0.9 0.7 1.2* 0.8* 0.8
Homicide
- court convictions 3.2 6.9 1.1 1.1 1.3 0.7
- prison inmates 9.4 5.3 5.7 6.4
Burglary police
-total 881 3,172 565 630 ? 562 1.587
-domestic 179 ? 282 317 407* 220 765
VIctim surveys
% households 0.4 2.2% ? 1.6% 2.4% ? 3.0%
.
Drugs
- police 277 73 246 177 93* ? 175
- court convictions 113 42 66 38 32 18* 52
-. prison inmates 7.0 13.9 5.6 3.2 16.5
as • attempted homicide', thus receiving higher court charges but also rather inflated crime rates.
4
Estonia Poland Czech Hungary Slovenia Republic
Homicide
Police incl. attempt 13.2 3.7 2.7 3.5 4.8
Police completed 10.0 2.5 1.8* 2.0 1.5
Health service 13.6 2.1 1.5 2.5 1.4*
Homicide
- court convictions 7.7 1.6 1.6 3.0 2.5
- prison inmates 12.1 11.4- 14.8
s.o
Burglary poUee
-total 1,626 944 723 706 824
-domestic 509
2_®.
110 265 51Victim surveys t .(' (urban) (urban)
% households 4.5% . 2.l% 6.9% 2.9% 2.4%
Drugs
• police 44 17 ? 30 84
.
court convictions 23 79.5
15 13-
prison inmates 7.5 2.7Source: European sourcebook of crime and criminal justice statistics, Den Haag
2003.
Table 11 : Crime developments in post-communist countries 1990 - 2000
Estonia Poland Czech •Hungary Slovenia Republic ...
Homicide completed
1990 8.7 2.3 2.1 4.0 4.4
1995 20.6 3.5 2.7 5.1 5.0
2000 13.2 2.5 . ? 2.0 4.0
Robbery
reported
-
84 41 37 28 81990 211 52 39 26 23
1995 332 120 46 35 30
2000 Burglary
1990 ? 1131 707 745 293
1995 1349 790 969 799 496
2000 1626 944 923 707 824
Drug offences
1 5
-
-
10.
1995 3 13 11 4 282000 11 17 ? 30 84
7. Measuring litigation volume: What Is a case?
If the criminal justice system confronts us with a selective funnel of institutions determining which cases finally get to criminal courts, litigation volumes at civil, labour and administrative courts and tribunals are no less sifted and selected. Behind what is counted as 'cases' may lie very different degrees of adversariness of the litigation.
[image:22.482.50.429.60.526.2]might intend not more than a rather short action, but it might also lead to a full procedure with claims, counter-claims and taking evidence. A special kind of contract cases are construction cases. They form a headache for many judges, because quarrel gets complicated in social as well as in technical terms. Decisions often have to be made on the basis of expert opinions, and those can be contradictory according to which party has asked for them. A prudent system might let the experts decide in the first place, by arbitration for example. So does the Dutch construction industry, on basis oftheier standard contracts already, and they ask themselves why the Germans have to go to court for it.
Consumer complaints follow a similar logic. A decent industry offers complaint boards, and there must be high values at stake (or organizations behind the plaintiffs) to risk a court procedure. Thus, the efficacy of consumer protection will determine the volume of litigation.
Another frequent kind of cases concerns liability for damages (tort). Quantitatively again, most of them stem from traffic accidents, not from the interesting cases of neighbourhood quarrels which fill the magazines or medical malpractice which fill the legal journals. Again, many lawyers ftle a traffic tort case -"just in case" - and never take it up again. It gets a real case only, if high damages are claimed, often in relation to personal injury. And whether it is necessary to go before court with it depends on the speed and generosity of insurance companies - in Germany about 2% of all traffic accidents lead to a litigious court case (which makes for about 10% of their civil litigation), in the Netherlands where insurance services are quick (but not always generous) around 0.2 %.
In most European countries landlord-tenant issues take a special place in litigation. In post-communist countries, but also in Western Europe depending on the liberalization of rent control, its growth continued throughout the 1990s. Because many cities still maintain rent control schemes, most disputes are initiated by landlords threatening to evict tenants for non-payment of rent. While the tenants can afford to play for time, the landlords might use the threat of eviction to reach some sort of settlement,. Tenants sometimes demand repairs, but they rarely file court claims against their landlords. Their rights often can be defended only when group actions force housing corporations to negotiate. In such cases, courts are usually invoked only after collective bargaining has failed.
Legal po1icy in many countries reacted to routine divorcing by introducing simple request procedures, sometimes even without summoning the parties to appear before court. Property claims and support, including social insurance rights which make for dramatic story telling, are increasingly negotiated before filing divorce in court. (Lawyers in the Netherlands account for about 60%, in Denmark for 90% of divorce dealt without adversary litigation.). What keeps family courts busy are post-divorce proceedings. They follow in only a minority of all divorces, but as they often concern revolving-door problems such as child custody, spousal and child support their case load is high. ostly they are handled by one sided request proceedings, but their frequencies have increased disproportionately so that most countries now count more post-divorce cases than post-divorce proceedings.
Finally, special consideration is needed for the variety of special courts and tribunals which deal with labour law and with public administration. Some countries such as the Netherlands include all of these in an overall judicial system, differentiating at best by procedural law. Others specialize independent judicial pillars for each of them. Such as the Gennan tradition with independent social, administrative, fiscal and labour courts. Some, like the British deal with them in a multitude of internal procedures and tribunals.
National traditions vary in the degree to which they allow their public administration to be challenged by some type of judiciary. The greatest variety of judicial forms, however, was invented for treating labour issues, which in most countries institutionalizes some kind of tri-partite participation of the industrial partners in the judicial process.
'·
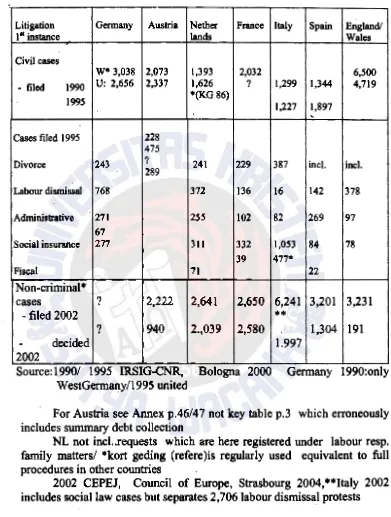
Table 12 : First instance civil and administrative litigation rates per 100.000 inhabitants
Litigation Germany Austria Nether France Italy Spain England/
111
instance lands Wales
Civil cases
w•
3,038 2,073 1,393 2,032 6,500- filed 1990 U: 2,656 2,337 1,626 ? 1,299 1,344 4,719
1995 *(KG 86) 1,227 1,897
'
Cases filed 1995 228 475
Divorce 243 ? 241 229 387 incl. incl.
289
Labour dismissal 768 372 136 16 142 378
Administrative 271 255 102 82 269 97
67
Social insurance 277 311 332 1,053 84 78
39 477*
Fiscal 71 22
Non-criminal*
cases ? 2,222 2,641 2,650 6,241 3,201 3,231
-filed 2002
••
? 940 2.,039 2,580 1,304 191
-
decided 1.9972002
Source: 1990/ 1995 IRSIG-CNR, Bologna 2000 Germany 1990:only WestGennany/1995 united
For Austria see Annex p.46/4 7 not key table p.3 which erroneously includes summary debt collection
NL not incl..requests which are here registered under labour resp. family matters/ *kort geding (refere )is regularly used equivalent to full procedures in other countries
[image:25.480.65.456.44.561.2]Litigation Estonia Poland Czech Hungary Slovenia
1st instance Republic
Cases filed 1995
1,108 2,120 1,842 1,350
Civil 1,292
229 incl.
Divorce incl. 387 incl.
136 378
Labour 63 16 142
102 97
Administrative 123 82 269
332 78
Social insurance 84
Fiscal 22
Non-criminal* cases
-filed 2002 1,939 6,970 2,609 5,261 1,936
-:- decided 2002 1,703 5,370 ? 5,203 2,476
Sources: For 1990/1995 WRR, Den Haag 2000 For:2002: CEPEJ, Strasbourg 2004
*CEPEJ table 23 documents what they call "non-criminal' cases apart from divorce, labour dismissal which leaves civil and · administrative cases in so far as these are not treated by special tribunals
2002.
Table 12 tries to sum up5 the overall results of litigation comparisons. It separates civil law cases from cases which deal with divorce, ャ。「ッオイセ@ dismissal or administrative, social or fiscal law. (In some countries (as p.e. The Netherlands where these are organized in a single judicial organization so that national documentations often present them by a single indicator.
5
[image:26.481.45.420.11.518.2]The CEPEJ documentation 2002 documents as "non-criminal" rather clean civil law cases separating them from divorce and labour dismissal and social administration (with obvious exception of Italy). It also allows for looking at litigation without the large amount of early terminations, withdrawals, default and settlements. The degree to which this might inflate litigation figures should be visible from the difference between 'cases filed' and 'decisions'. Unfortunately, however, the. data source remains unclear on that. "Decisions"should only include judgement after litigious proceedings ('streitiges Urteil'). The interpretation of this criterion, however, seems widely different among the reporters from different countries: The British data apparently only report judgments after a full trial, the French and Dutch all decisions · including default and the German figures we left out 」ッューャセ・ャケ@ because they do not match with any official statistics which we could look at. Finland is not included in the CEPEJ study, but we know from historical data that together with Denmark and Sweden litigation figures in the '20th century have been relatively low. This contrasts with high litigation rates in the 19th century when particularly in the rural environment litigation in Finland was higher. 6
While taking all corrections into consideration, the data on Continental countries in table 13 might largely be cleared of doubts and questions about whether the indicators really measure comparable kinds of cases and procedures. British data, however, might be on a different scale, because they count all and any procedure of mass litigation, while the 'decisions' only count a strict selection of those which have undergone a full trial procedure.
Among the Continental judicial systems, the West German litigation rates have clearly been the highest. The distance got smaller in 1995 when the former parts in Eastern Germany (GDR) joined thanks to unification. Litigation rates were lower in the economically less active . 'LAnder', and they remained so until 15 years after unification. We hold that it is mainly economic activity which explains the higher litigation rates in Western rather the Eastern Germany {as well as other post-cottimunist countries). The same economic dependence might also account for the rise of litigation rates in Western Europe.This holds certainly true of the. Netherlands where much of the increase shown in 2002, however, is accounted for by labour dismissal and by administrative law procedures which had undergone legal changes in the
1990's. Litigation growth led to increased efforts of the Dutch legislator to at the same time encourage settlements and informal alternatives in court. Taking together theories which explain the differences of litigiousness, we resort to input-theories like those which relate litigation rates to economic activity on the one side, to procedural theories on the other. In a comparison of the amazing differences of Dutch litigation rates compared to the neighbouring Nordrhein-Westfalen, we found the explaining factor lying in the great variety of pre-court alternatives which help the Dutch to avoid litigation where the Germans had no choice but to choice but to invoke a court 7•
Alternative procedures, providing shortcuts by summary ·proceedings and encouraging settlements are vital responses to overburdened courts. Potential litigants, particularly those seeking to maintain long-standing relations, may want to avoid escalation to a full-blown lawsuit. Their increased use may explain many changes in litigation frequencies, sometimes also sudden jumps of decrease (p.e. when amendments to procedural law introduce short-cuts for mass procedures.)
At the other end of the spectrum, however, some parties pursue their cases all the way to appeal. The figure below shows (for German 1st instance courts, but plausibly for kinds of cases in other countries as well) that the funnel from early termination in civil courts up to the appeal rates on the other end varies with the characteristics of issues at stake.
TERMINATION: withdrawal etc., default, settlement, adversary decision, appeal
7 Blankenburg, Mobiliserung von Recht 1989. A strict ceteris-paribus
INSERT FIG
8. Duration of procedutres and appeal rates as performance Indicators for courts of justice
Table
13
Appeal rates and the duration of procedures2002
Litiption in I" instance
Finland Nether g・イョャ。セ@ France Italy Spain England
lands ny /Wales
% appeal
non-
21 criminal (civil ) cases7
Length in days• of
セ@ robbery incl. prosecution
190 190
- divo:rce 1" inst - dismissal
Length in days ••
180 110 260 60
incl. enfo:rcement: 240 - cashing cheque 120
52 39 - tenant eviction
Litigation• Estonia in 1" instance
% appeal non-criminal (civil
) 12
casesLength* in days of
-
robbery inc I1
prosecution
-
divorce lit inst350
-
dismissal280
Length in days •• incl. enforcement:
-
cashing cheque305
-
tenant eviction305
18 220 310 ? 331 154 Poland ?
180
280
110
1080
1000 ? 200 360 320 226 181 Czech ·republic ?170
300
110
330
270
17 16
? 250 700 ? 260 70 100 ?
630 183 160 . 654 147 190
Hungary Slovenia
8
29
340
?320
170
290
430
365
1003
365
1003
Source:
CEPEJ,
European Judicial Systems2002, Council
ofEurope,
' Strasbourg
2004.
[image:30.481.46.423.48.532.2]Where table 13 shows differences of the duration of different procedures, we have take into consideration the selectivity of pre-court handling which can be quite different from one country to the nt(xt (p.e. in divorce) The Lex mundi data measure the length of two cases of rights enforcement which in some countries may be handled by urgent speed procedures (kort gedingl refere in the Netherlands).
It Is evident, that more detaUed In-depth study and additional indicators for performance quality would be needed before drawing conclusions from these puzzles. Litigation frequencies as they are used here refer to procedures filed, they may terminate by default, withdrawal, settlement or decision. Which kind of termination prevaUs depends on the Issue of the cases. High frequencies of litigation (such as those for clvU litigation In England/Wales or social Insurance courts in Italy) indicate that a large number of routine cases can be done with by summary procedures. A stroke of the legislator suffices to eUminate them from the register of "litigation". Nevertheless, in depth studies which controlled for the different profiles of the kinds of Issues (cf. our own study 1989) demonstrated that the puzzles remain.
9. Puzzles of judicial cost and quality comparisons
Judicial statistics so far have not much more to offer than appeal rates and data for the duration of procedures. Average duration over all (criminal I civil) litigation would be useless, specific duration is used in the Council of Europe study as well as the Lex Mundi data collected with the help of advocates in the major city of each country: (cashing a cheque) and tenant eviction are taken .. the of some frequent routine cases such as debt enforcement
Rank order coefficients lead to a few puzzles which might stimulate further reading of the comparative tables:
Germany which employs a high number of professional judges, also has the highest litigation rates of all countries compared. In spite of its sizeable personnel, however, the duration of cases is more than average. Appeal rates are high.
Compare this to the performance of the Dutch judiciary which employs a low rate of judges, with a high ratio of cases, but low appeal rate and very short duration of procedures (at least for the routine cases compared here).
instance but an extremely high appeal rate, but nevertheless takes the longest duration for routine cases and battles with high appeal rates . . France, and Spain employ moderate/ low numbers of judges;
compared to their first instance civil litigation they have to handle a rather high appeal rate.
· British figures contain a great number of petty cases which are dealt with by summary procedures. Other countries do not count them among their litigation figures.
Looking at the ・ョエセ@ range of countries we might conclude that additional personnel does not guarantee a better quality of services (measured in terms of appeal rates and duration of procedures). It is evident, that greater size of personnel regularly results in a lower case ratio per professional judge/ court clerk, but this does not lead to better performance in the terms measured.
While for a long time appeal to a higher court was considered the exclusive avenue for clients to challenge a court decision, court managers nowadays try also to be responsive to other complaints about the handling of cases corrected. They include waiting times, information transparency and friendly treatment as elements of performance quality. Courts are seen as public services which have to meet the expectations of their clients - instruments such as complaint boards and justice ombudsmen can render court organizations responsive to their clients, quality measurements can make use of indicators of waiting times, information on the progress of a case is improved and the duration of procedures is controlled.
It has to be admitted that judicial systems with more personnel do not necessarily terminate ease quicker nor do not show lower appeal rates than those where personnel is searee. The time which judges (and court personnel) spend varies enormously, with no apparent correlation to efficiency of their services. Productivity is not only measured in numbers of eases terminated, but also in terms of more or less scrutiny spent on eases (spending mof# time for preparing a ease, more extensive motivation). But parties might be ,ore interested in speedy decisions rather than scrutiny. It remains to show which scrutiny is really in tbe interest of (which) party, or whether it is but satisfying self-imposed professional standards.
Last not least, one of the limitations of country comparisons is the lack of regional or even local insight. Keeping the legislative and institutional context constant would make comparisons of caseloads, . costs and quality easier. Metropolitan areas produce higher volumes of litigation, their courts are bigger and they usually battle with more problems of delay. Under the caseload pressure they might develop routine ways of handling summary procedures. On the other hand, on a smaller scale courts might find it easier to develop an infrastructure of alternative dispute institutions which relieve from case load. Even Civil Law countries where rules of procedures are given by codes of law, have some leeway in changing their rules of court according to priorities of efficiency and management. Even more so in Common Law courts which can seek to optimize procedural efficiency locally.
Local priorities can be implemented by using summary procedures extensively (cf. the use of preliminary injunctions (refere) by some P.residents of the court in the Netherlands and in some French districts, while other courts under the same national jurisdiction stick to the full adversary procedure).
If parties agree, they can be given a choice of summary procedures ( cf. the general trend towards simplifying non-controversial divorce procedures which in the past thirty years has alleviated the case load of civil courts in many countries),
And finally, many countries enacted legislation to allow for (local) experiments with mediation and settlement procedures, which may be encouraged as a means of cost control, but more regularly are promoted for quality reasons.
Not only legislation, also court management determines, how much procedural scrutiny courts follow, whether parties may expect quick decisions and which possibilities other parties have for prolonging decisions. In this sense, local litigation patterns may have an impact on the quality and costs of the judicial system.
Finally, a remark might be made about indicators on judicial quality which are still missing. Political systems have been compared by using increasingly sophisticated corruption indices8• Even though based
purely on reputation, they have been instrumental in stimulating the ambition to improve corruption controls. Would it out of the way to think of developing similar devices ·measuring professionalism and judicial independence of judicial systems?
Sources
WRR, Blankenburg et al., Legal Culture in Five Central European Countries, Wetenschappelijke Raad voor het Regeringsbeleid 19, Den Haag2000
CEPEJ, European judicial systems 2002, Council of Europe Strasbourg 2004
European sourcebook of crime and criminal justice statistics,
Council of Europe, WODC Den Haag 2003
>WWW.WODC.NLIOB212<
IRSIG-CNR, F. Contini ed., European Database on Judicial Systems, Bologna 2001 (copy available)
Etienne Donat (dir), Les budgets de Ia justice en Europe, Documentation francaise, Coli. perspectives de Ia justice, Paris 2001
Frans van Dijk I Jaap de Waart, Judicial Infrastructure in International Perspective, Ministerie van Justitie Den Haag 2000
LEX MUNDI, Andrei Shleiffer et al. (Harvard/ Yale University), Legal Structure and Judicial Efficiency: Worldbank, Lex Mundi Project, report by, Washington 2002 (copy asvailable)
Appendix: Costs of parties seeking justice
Stage of the procedure Models of regulation Who pays ? - parties behind parties
Pre-court legal advice Hourly fees Plaintiff investment Fee scheme: by action Defendant investment by value at stake
Contingency fees
Representation in court Each party for Legal cost insurance themselves Membership (trade unions, Looser pays all Automobile clubs)
Legal aid
Court fees -- Court decision: split of Liability insurance
costs Collective interest (consumer, associations
Issue at stake Frequent constellations
Civil: debt enforcement Plaintiff investment, defendant looser !pays costs
consumer complaint Plaintiff investment, settlement, costs are split
liability Plaintiff investment covered, by insurance/ contingency fee defendant insured, split of costs traffic tort Both sides insurance covered
Divorce Parties pay, split of costs
Woman plaintiff legal aid covered
Labour dismissal Plaintiff insurance covered/legal aid settlement, split of costs
Criminal Justice Indicators 1995 per 100.000 of the population
NL
F
ISP
E/WSF
セ@
D Victims reportingcnme %
0.6 2.3 1.3 2.4 2.4 1.6 2.7
households
burglarized 0.5 0.4 0.4 2.0 2.7 1.4 2.7
- motor vehicle
0.7 0.8 0.8 0.6 1.3 3.1 1.7
stolen . 4.0
3.8 3.1 2.8 0.8 3.1 3.9
% persons robbed assaulted
Police reg. crime
per I 00.000 pop Intentional
Homicide 10 19.3 2.5 2.7
Incl. attempt reg as 4.8 5.1 5.0
completed. by- 3 1.8 ? 1.4
- Police 1.1 0.9 3.5
Rape
8.7
4.1
Incidents
·5
8.9
7.6
12.6
1.7
('94)
9.6
offenders
7
6
2
3
5
10
Robbery
43
50
?132
Incidents
32
102
78
128
15
45
20
44
ofl"enden
46
35
Assault
434
38
23
393
incidents
386 181
371
122
26
321
offenders
50*
117
447
136
Burglary
1890
•
Incidents ?
3,058 838
745
373
96 2,395
offenders
302
119
82
34
123
Motor vehicle
387
253
theft ?
461
322
780
537
?982
?
offend en
65
67
29
39
Drug offences.
177
67
188 22** 194
136
84 39**
41**
ofl"enden ?
166
57** 152
136
Victims reporting Estonia Poland Czech Hungary Slovenia
crime % of Republic Urban**
households
--5.0 2.0 3.1 2.5 1.9
burglarized
1.3 0.8 1.1 1.8 0.2
- motor vehicle stolen
3.3 1.8 1.2 0.7 0.9
%
of persons robbed5.4 3.9 3.0 1.7 4.6
assaulted
Police reg. crime national
per 100.000 pop
Intentional Homicide
Incl. attempt 20.6 3.5 2.7 5.1 5.0
reg as completed. by
- Police 16.7 2.2 1.8 3.9 3.6
- Health service 22.3 2.8* 1,8* 3.5 3.5
Rape incidents 6.9 6.1 7.0 4.1 6.2
offenders
Robbery 39 52 39 26 17
incidents 84 33 24 19 20
offenders
Assault 28 48 78 102 24
incidents 18 30 65 64 26
offenders
Burglary 1,394 790 969 799 288
incidents 221 167 191 148 126
offenders
Motor vehicle 133 142 265 125 74
theft
.
incl. 44 22 52 10 51offenders
Drug offences· 3 13 11 4 23
Mind: household experience might be much lower than that of foreign travellers and tourists •• As everywhere urban figures are considerably higher than national averages • Previous year
Court convictions NL F* I SP E/W
persons convicted D
1995
Intentional. 5.8 1.1 1.3 1.3 1.0 1.0
homicide
Rape 2.1 1.5 2.1 1.7 0.6 1.1
Robbery 22 11 11 10 92 16
Assault 35 51 68 5 8 53
Burglary ? 37 ? ? ? 68
Motor vehicle ? ? ? 0.9 13 15
theft
Drug offences
L
2.9 47 40 4 19 61Operating costs
prisons 1995- 4,257 ? 1,530 ? 331 3,046
ECU I 100.000 p()p.
Capital costs prisons ? ? 89 ? 16 752
Court convictions persons convicted 1995
Intentional. homicide 13.6 1.7 1.3 2.8 1.9
Rape 4.1 2.5 1.8 2.3 2.1
Robbery 61 14 12 15 2
Assault 17 18 22 61 15
Burglary ? 85 ? ? 14
Motor vehicle theft ? ? ? ? 5.7
Drug offences 1 94 2 2 2
Operating costs
prisons 1995 691 466 888 478 793
ECU I lOO.OOOpop.