Jurnal Administrasi Bisnis (JAB)| Vol. 28 No. 1 November 2015| administrasibisnis.studentjournal.ub.ac.id
193
THE COMPARISON BETWEEN FAMA-FRENCH THREE FACTORS MODEL
(FF3FM) AND CAPITAL ASSET PRICING MODEL (CAPM)
AS INVESTING DECISION ON EFFICIENT SHARE
(Study of LQ45 Listed In Indonesian Stock Exchange Periods of July 2010
–
June 2014)
Sutan Indra Hanif Suhadak
Raden Rustam Hidayat Faculty of Administrative Science
Universitas Brawijaya Malang
Email :[email protected]
ABSTRACT
This research aims to analyze the implementation of Fama-French Three Factors Model (FF3FM) method in Indonesia than Capital Asset Pricing Model (CAPM) , and it is not about determining the best method between CAPM and FF3FM. The research concern about the companies listed in Indonesian Stock Exchange (IDX), whose include in LQ45 period July 2010 - June 2014. The type of research in this undergraduate thesis is descriptive using quantitative approach. The collecting data method in this research is documentary, with the data of shares of the companies listed in Indonesian Stock Exchange (IDX) period July 2010 – June 2014 which include in LQ45 as population. The sampling done using purposive sampling, and generates 22 samples from 45 populations. The results show that the implementation of CAPM method generates 13 efficient shares and 9 inefficient sahres; while FF3FM generates 20 efficient shares and only 2 include in inefficient shares. In the end, the analysis shows that the FF3FM is the development of CAPM that can be seen on their same trend of SML. The main differences of CAPM and FF3FM are SMB and HML which are owned by FF3FM formula.
risk of business will provide higher profit as well. In order to earn this high profit businessman will apply various strategy they can done, and it not impossible if the professional investor will receive much gain without losses. The most important ingredients to formulate best strategy are informations and mostly the winners in business competition are people who have more information needed than other people. Having much information than others does not always assure investors to become the winner without any proper method to analyze it.
The main core of analyzing the information in business environment is predicting the future of business in global. These desires of predicting the futures profit leads the business analyst to formulate the business calculation to predict the return they will earn in the future for investment they done, and at its development process, this calculation known as Asset Pricing Models Theory.
The first well-known Asset Pricing Models Theory in the world is Modern Portfolio Theory (MPT) by Harry Max Markowitz in 1952, from his
journal research titled “Portfolio Selection”. The
famous asset pricing theory after MPT by Markowitz is known as CAPM (Capital Asset Pricing Theory), first introduced in 1961 by Jack Treynor. In the developing process of CAPM, this theory was improved by William Sharpe (1964), John Lintner (1965), Jan Mossin (1966) and Fischer Black (1972) until it become the famous Theory of CAPM that existing until nowadays. The CAPM Theory, as quoted from Pettengill, Chang & Hueng (2013:2), is "systematic risk of a security can be determined by a single variable, the
security’s sensitivity toward changes in the overall market, the security’s market beta; in other word
CAPM is a prediction using beta.”
The researchers and business practitioners find out that from both research and direct application in business did not generate the result
expected. Many researchers consider that “beta” as
the single indicator of CAPM cannot represent the whole phenomenon of a business in asset pricing. Suh (2009:2) mentioned that there are empirical result using asset pricing model been disappointing. Suh also mentioned that Roll (1988) in his research finds that his test results of the
CAPM are “extremely disappointing.” Roll find that with “all explanatory factors” included, less
than 40% of the monthly return volatility in the
typical stock can be explained for a sample of the largest firms, and explanatory power with daily data is even less.
Besides CAPM, other factor pricing models that have attempted to explain the cross-section of average assets returns, they are the Intertemporal Capital Asset Pricing Model, (ICAPM) by Merton in 1973, the Arbitrage Pricing Theory (APT) by Ross in 1976, and the Consumption-Based Capital Asset Pricing Model (CCAPM) by Rubinstein (1976), Lucas (1978), Breeden (1979), Mehra and Prescott (1985). Among those new theories, The Arbitrage Pricing Theory (APT) tends to be the favourite in the further of asset pricing theory. The
term “Arbitrage” itself, according to Bodie, Kane,
Marcus (2014:324) defined as the exploitation of security mispricing in such a way that risk-free profits can be earned.
In the past, Fama already has done such an asset pricing theory with MacBeth in 1973, resulting the theory of Two Pass Procedures. Goyal (2012:12-13) mentioned that Fama-MacBeth research in 1973 was the pioneer of an approach to asset pricing that is very widely used; this is an extension of the two-pass procedure. In 1992 Fama and French had done their research and in 1993 they declare the new theory of asset pricing models
namely “Fama-French Three Factor Models” (FF3FM). Fama-French believed that beta as the single indicator of market are not able to explain the stock return, whereas size and book-to-market (BE/ME) able. Sudiyatno and Irsad (2011:127 stated that FF3FM was a theory formulated from the combination of both CAPM and APT because beta as the single indicator of market are not able to explain the stock return, whereas size and book-to-market (BE/ME) able. Sharma and Mehta (2013:90), mentioned that “In June 1992, Fama and French documented that on an average only 70% return of a portfolio are explained by the beta of the portfolio and rest 30% returns are expressed by
some other factors.”
Jurnal Administrasi Bisnis (JAB)| Vol. 28 No. 1 November 2015| administrasibisnis.studentjournal.ub.ac.id
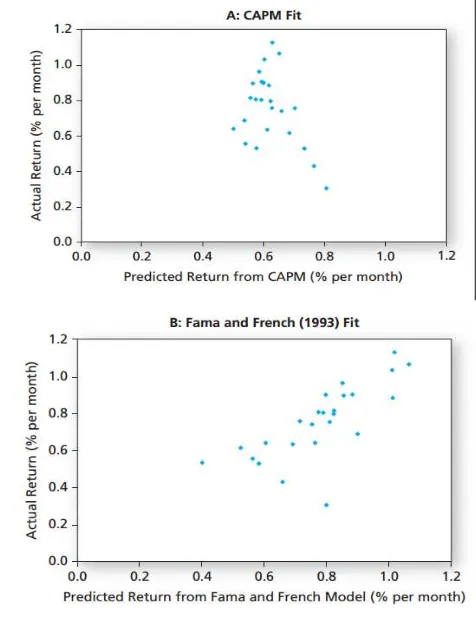
195 Figure 1. CAPM versus the Fama-French model.
Source : Bodie, Kane, Marcus (2014:428)
Figure 1shows the average actual return of each portfolio over the 1946–2010 against returns predicted by the CAPM and FF3FM. In this test, the FF3FM model provides a clear improvement over the CAPM. Based on the figure 1 above, Goyal (2012:27) stated that it is quite evident that the three-factor model does a better job of explaining the returns than does CAPM.
The author interested in LQ45 as research object, because LQ45 contains 45 liquid stocks in Indonesia, and updated twice in a year. It would be a great accomplishment for the companies whose the stock included in to LQ45. In other hand, according to the research of Elvira (2014:7) done her research using LQ45 research object, taking 18 sample, resulting that 4 from 6 stocks which include in inefficient (Overpriced) were stocks of LQ45 company which were consecutively distribute the dividend period (2010-2012). The research shows that even the best stock did not provide the assurance expected after calculated with CAPM. Based on previous explanation, it triggering the new passion to implementing the FF3FM, using LQ45 as the research object. It is kind of a unfortunate if researchers and business practitioners in Indonesia did not take the advantages of new tested theory such as FF3FM. In the end, perhaps this FF3FM theory will generate advantages in the business environment in
Indonesia or at least as a comparison for existing method in order to provide better result.
2. LITERATURE REVIEW
A. Investment
Investment is the current commitment of money or other resources in the expectation of reaping future benefits. The example is such as an individual might purchase shares of stock anticipating that the future proceeds from the shares will justify both the time that her money is tied up as well as the risk of the investment. (Bodie, Kane, Marcus, 2014:1)
B. Capital Market
The capital market according to Bodie, Kane, and Marcus (2014:28) is part of financial markets which its instruments include longer term and riskier securities. Brigham and Ehrhardt (2014:24) stated that capital markets are the markets for corporate stocks and debt maturing more than a year in the future. Van Horne and Wachowicz (2008:505) stated that the capital market deals with relatively long-term (greater than one year original maturity) debt and equity instruments (e.g., bonds and stocks).
C. Stock
Stock is the instrument traded in the capital market. Stock generally divided into two, there are Common Stock and Preferred Stock (Bodie, Kane, Marcus, 2014:54). As quoted from Van Horne & Wachowicz (2008:538), both common and preferred stock as no maturity date, however shareholders can still liquidate their investments by selling their stocks in the secondary market.
D. Risk and Return
Risk is defined in Webster’s as “a hazard; a peril; exposure to loss or injury” (Brigham and
Ehrhardt, 2014:237&277). Van Horne & Wachowicz (2008:105) define the risk into two components, ther are : (1) systematic risk, is due to risk factors that affect the overall market – such as
changes in the nation’s economy, tax reform by
Jurnal Administrasi Bisnis (JAB)| Vol. 28 No. 1 November 2015| administrasibisnis.studentjournal.ub.ac.id
196
be offered the investor (Van Horne & Wachowicz, 2008:98).
1. Return of Common Stock (Ri)
It is the return from holding an investment over some period (a year) is simply any cash payments received due to ownership, plus the change in market price, divided by the beginning price (Van Horne & Wachowicz, 2008:98-99).
(Van Horne & Wachowicz, 2008:98-99) Description:
R = the actual (expected) return
t = particular time period in the past (future)
Dt = a benchmark value in the previous period
Pt = the stock’s price at time period t Pt−1 = the stock’s price at time period t−1
2. Market Return
Sudiyatno & Irsad (2011:129) also Elvira (2014:3) defined market return as a rate of return based on the stock price index. In this the rate of market return can be calculated from Index Harga
Saham Gabungan (IHSG) (because this research
conducts in Indonesia). The IHSG are value-weighted index, that the calculation using the value of market capitalization.
(Sudiyatno & Irsad, 2011:129) & (Elvira, 2014:3) Description:
Rm = return market
CPI(t) = Composite price index on period t
CPI(t-1) = Composite price index on period t-1
E. Beta
Beta is the security’s sensitivity to the index, It is the amount by which the security return tends to increase or decrease for every 1% increase or decrease in the return on the index. (Bodie, Kane, Marcus, 2014:260). Van Horne & Wachowicz (2008: 108) define beta as an index of systematic risk that measures the sensitivity of a
stock’s returns to changes in returns on the market
portfolio.
(Brigham & Ehrhard, 2014 : 254)
Description :
βi = beta
Cov (ri, rM) = Covariance of company profit
period i, with market profit index
σ2
M =Variance ofmarket profit index
F. The Fama-French Three Factor Model Fama-French Three factor Model (FF3FM) is a asset pricing models which explains the stock returns, introduced by Eugene Fama and Kenneth French in 1992 and developed in 1993.
(Sharma and Mehta, 2013:93) Description:
E(Ri) = expected return Rf = risk free rate
βi = beta / Systematic Risk
E(Rm) = expected excess return of the market portfolio beyond the risk free rate / equity risk premium.
1. Portfolio Formation
According to Fama and French, the split of the stocks into different categories they are two ME (market equity) /Size groups and three BE/ME (Book to Market Equity) groups (Osamwonyi & Ajao, 2014: 347-349).
a. The Size Classification
The size is Market Equity which is market price multiplied by number of outstanding shares for each of the sample firm. All the sampled stocks were ranked according to the size capitalization computed and then they determine the median of the stocks in order to split the market into two halves become “Small“ and “Big” Equity firms. (Osamwonyi & Ajao, 2014: 347-349)
b. The Book-to-Market Equity (BE/ME) Classification
The BE/ME calculated as =��
Jurnal Administrasi Bisnis (JAB)| Vol. 28 No. 1 November 2015| administrasibisnis.studentjournal.ub.ac.id
197
medium (called medium BE/ME); and the last group, 30% of all stock with lowest BE/ME (called low group). All stocks with negative BE/ME were excluded from the grouping in order to prevent distortion of the results. (Osamwonyi & Ajao, 2014: 347-349)
2. SMB and HML
Based on the explanation above, classification by Size (ME) and Book-to-market equity (BE/ME) constructed six (6) intersecting portfolios, namely: S/L, S/M, S/H, B/L, B/M and B/H. (Osamwonyi & Ajao, 2014: 347-349)
S/L: stocks in the small market equity group that are also in the low BE/ME group. S/M: stocks in the small market equity group
that are also in the medium BE/ME group. S/H: stocks in the small market equity group
that are also in the high BE/ME group. B/L: stocks in the Big market equity group that
are also in the low BE/ME group.
B/M: stocks in the Big market equity group that are also in the medium BE/ME group. B/H: stocks in the big market equity group that
are also in the high BE/ME group.
a. SMB (Small Minus Big)
SMB is the difference of the average monthly return of the three portfolios of small stocks of small companies (S/L, S/M, S/H) with an average per month of the return on the three major stock portfolios of a big company (B/L, B/M, B/H).
(Eraslan, 2013:16) and (Sudiyatno & Irsad , 2011:130)
Description:
SMB = difference between the monthly average of the returns on the three small stock portfolios (S/L, S/M, S/H) and the between of the monthly average of the returns on the two portfolios which the BE/ME is high (S/H and B/H) and the average of the returns on the two portfolios which is the BE/ME is low (S/L and B/L).
(Eraslan, 2013:16) and (Sudiyatno & Irsad , 2011:130)
Description:
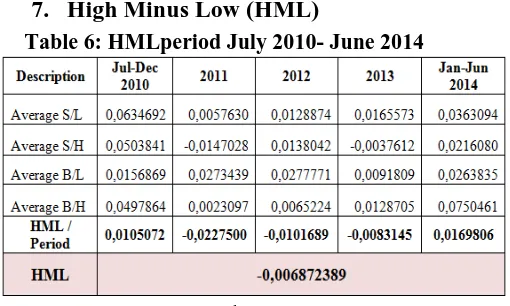
HML = difference between the monthly average of the returns on the two portfolios which the BE/ME is high (S/H and B/H), and the average of the returns on the two portfolios which is the BE/ME is low (S/ L and B/L).
G. The Security Market Line (SML)
The SML describes the relationship between an individual security’s expected return and its systematic risk, as measured by beta (Van Horne & Wachowicz (2008: 109). Bodie, Kane, and Marcus (2014:1) define the SML as The expected return–beta relationship can be portrayed graphically.
The equation of SML for CAPM are as follows:
(Van Horne & Wachowicz, 2008:109)
The equation of SML for FF3FM are as follows:
(Fama-French, 1993:24) and (Sharma & Mehta, 2013:93) Description:
E(Ri) = Expected Return Rf = The risk free rate
These loadings also represent the slope(s) in the time series regression.
3. RESEARCH METHODS
The type of research in this undergraduate thesis is descriptive using quantitative approach. Descriptive research based on Greener & Martelli (2015:47) is a research that answers the research
questions which are largely “factual” in nature.
Cooper & Schindler (2014:146) also quoted that
“Quantitative research attempts precise
measurement of something. In business research, quantitative methodologies usually measure consumer behaviour, knowledge, opinions, or attitudes; such methodologies answer questions related to how much, how often, how many, when,
and who.”
This undergraduate thesis using the Indonesian Stock Exchange (IDX) as the research location using documentary as data collection method. The populations in this research is the is the stock of the companies listed in Indonesian consecutively listed in the Indonesian Stock Exchange (IDX) period July 2010 – June 2014. b. The stocks of the company which are consecutively included in LQ45 period July 2010 – June 2014.
c. The stocks of the company which are consecutively distributing the dividends for period July 2010 – June 2014.
The sampling process generates 22 samples from 45 populations, there are AALI, ADRO, ASII, BBCA, BBNI, BBRI, BDMN, BMRI, CPIN, GGRM, INDF, INTP, ITMG, JSMR, KLBF, LSIP, PGAS, PTBA, SMGR, TLKM, UNTR, and UNVR.. The analyzing data technique of this research are as follows :
1. Calculate The Rate of Return of Common Stock in One Period (Ri)
2. Calculate The Rate of Market Return (Rm) 3. Calculate The Risk-Free Rate of Return (Rf)
(Elvira, 2014:3) Description:
Rf = Rate of Risk-Free Rate
Ʃ Rf = The total of Rate of Risk-Free Rate
n = period of observation
4. Calculate The Systematic Risk or Beta (β) 5. The Sample Grouping Based on Size
6. Sample Grouping Based on Book-to-Market Equity (BE/ME)
7. Calculate The SMB (Small Minus Big) 8. Calculate The HML (High Minus Low) 9. Calculate The Expected Return
10.Drawing the Security Market Line (SML) 11.Grouping and Determining of Efficient Stock
Investment
4. RESULT AND DISCUSSION
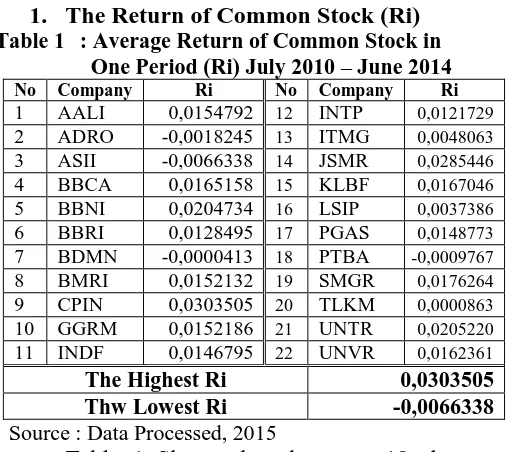
1. The Return of Common Stock (Ri) Table 1 : Average Return of Common Stock in
The Highest Ri 0,0303505
Thw Lowest Ri -0,0066338
Source : Data Processed, 2015
Table 1 Shows that there are 18 shares generate positive return {(Ri)>0}, and the rest 4 companies generate negative return {(Ri)<0}. The Charoen Pokphand Indonesia (CPIN) is the company which have the highest Ri, that is 0,0303505042 or about 3,03%. The Astra Internasional (ASII) is the company with lowest Ri for period July 2010–June 2014, that is -0,0066337913 or about -0,66%.
Jurnal Administrasi Bisnis (JAB)| Vol. 28 No. 1 November 2015| administrasibisnis.studentjournal.ub.ac.id
199 2. The Rate of Market Return (Rm)
Figure 2. IHSG period of June 2010-June 2014 Source : Data Processed, 2015
The Figure 2 above shows the lowest value of IHSG is on July 2010, which is only 3.069,28. The highest value of IHSG is on May 2013, which is reach about 5.068,63. The highest return of IHSG period July 2010–June 2014 is on September 2010 which is reach about 13,6% and the lowest is on August 2013 which is about -9%.
3. The Risk-Free Rate of Return (Rf) Based on the analysis, the Risk-Free rate in Indonesia period July 2010–June 2014 is fluctuatively increasing from 5,75% to 7,5%. The Average rate of Rf/ year is about 0,064591837. The Average rate of Rf/ Month, as the data required in this research is about 0,005382653.
4. The Beta (β)
Source : Data Processed, 2015
Table 2 shows there are only 8 companies
having Beta (β) more than 1 (β>1). The rest 14 companies having Beta (β) below 1 (β<1). The
(CPIN) is the most Aggressive, because of the Beta
(β) value is about 1,773409096. The share of (UNVR) is the most defensive, because the Beta (β) is less than 1, which is only 0,254607118.
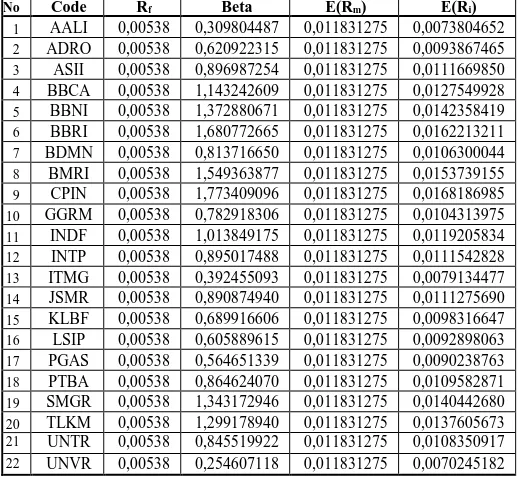
a. The Expected Return (E(Ri)) by CAPM Table 3: Expected Return Based on CAPM
No Code Rf Beta E(Rm) E(Ri)
1 AALI 0,00538 0,309804487 0,011831275 0,0073804652
2 ADRO 0,00538 0,620922315 0,011831275 0,0093867465
3 ASII 0,00538 0,896987254 0,011831275 0,0111669850
4 BBCA 0,00538 1,143242609 0,011831275 0,0127549928
5 BBNI 0,00538 1,372880671 0,011831275 0,0142358419
6 BBRI 0,00538 1,680772665 0,011831275 0,0162213211
7 BDMN 0,00538 0,813716650 0,011831275 0,0106300044
8 BMRI 0,00538 1,549363877 0,011831275 0,0153739155
9 CPIN 0,00538 1,773409096 0,011831275 0,0168186985
10 GGRM 0,00538 0,782918306 0,011831275 0,0104313975
11 INDF 0,00538 1,013849175 0,011831275 0,0119205834
12 INTP 0,00538 0,895017488 0,011831275 0,0111542828
13 ITMG 0,00538 0,392455093 0,011831275 0,0079134477
14 JSMR 0,00538 0,890874940 0,011831275 0,0111275690
15 KLBF 0,00538 0,689916606 0,011831275 0,0098316647
16 LSIP 0,00538 0,605889615 0,011831275 0,0092898063
17 PGAS 0,00538 0,564651339 0,011831275 0,0090238763
18 PTBA 0,00538 0,864624070 0,011831275 0,0109582871
19 SMGR 0,00538 1,343172946 0,011831275 0,0140442680
20 TLKM 0,00538 1,299178940 0,011831275 0,0137605673
21 UNTR 0,00538 0,845519922 0,011831275 0,0108350917 22 UNVR 0,00538 0,254607118 0,011831275 0,0070245182
Source : Data Processed, 2015
Based on the calculation using CAPM in Table 3, it shows the rate of expected return from the shares of Sample Companies. From 22 sample the lowest E(Ri) owned by (UNVR), and the highest owned by (CPIN). The result is the same
with the common theory which is higher Beta (β)
provide higher Return; and the result is higher Beta
(β) provide higher return, and vice-versa.
5. The Sample Grouping Based on Size and Book-to-Market Equity (BE/ME)
Table 4: FF3FM Portfolio Formation
Jurnal Administrasi Bisnis (JAB)| Vol. 28 No. 1 November 2015| administrasibisnis.studentjournal.ub.ac.id
200
Table 4 shows the samples formulation into 6 FF3FM “unique” Portfolio (S/L, S/M, S/H, B/L, B/M, B/H); after grouping based on “Size” (Small/Big) and “Book-to-Market Equity (BE/ME)” (High/Medium/Low).
6. The Small Minus Big (SMB) Table 5: SMB period July 2010- June 2014
Source : Data Processed, 2015
Table 5 shows the calculation of SMB for the whole periods. The result per periods mostly generates minus score of SMB. In the end the average of whole SMB is -0,0050857253.
7. High Minus Low (HML)
Table 6: HMLperiod July 2010- June 2014
Source : Data Processed, 2015
Jurnal Administrasi Bisnis (JAB)| Vol. 28 No. 1 November 2015| administrasibisnis.studentjournal.ub.ac.id
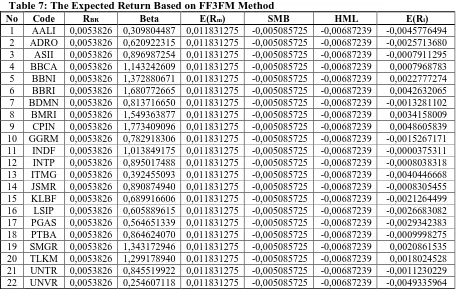
201 8. The Expected Return by FF3FM Method (E(Ri))
Table 7: The Expected Return Based on FF3FM Method
No Code RBR Beta E(Rm) SMB HML E(Ri)
1 AALI 0,0053826 0,309804487 0,011831275 -0,005085725 -0,00687239 -0,0045776494 2 ADRO 0,0053826 0,620922315 0,011831275 -0,005085725 -0,00687239 -0,0025713680 3 ASII 0,0053826 0,896987254 0,011831275 -0,005085725 -0,00687239 -0,0007911295 4 BBCA 0,0053826 1,143242609 0,011831275 -0,005085725 -0,00687239 0,0007968783 5 BBNI 0,0053826 1,372880671 0,011831275 -0,005085725 -0,00687239 0,0022777274 6 BBRI 0,0053826 1,680772665 0,011831275 -0,005085725 -0,00687239 0,0042632065 7 BDMN 0,0053826 0,813716650 0,011831275 -0,005085725 -0,00687239 -0,0013281102 8 BMRI 0,0053826 1,549363877 0,011831275 -0,005085725 -0,00687239 0,0034158009 9 CPIN 0,0053826 1,773409096 0,011831275 -0,005085725 -0,00687239 0,0048605839 10 GGRM 0,0053826 0,782918306 0,011831275 -0,005085725 -0,00687239 -0,0015267171 11 INDF 0,0053826 1,013849175 0,011831275 -0,005085725 -0,00687239 -0,0000375311 12 INTP 0,0053826 0,895017488 0,011831275 -0,005085725 -0,00687239 -0,0008038318 13 ITMG 0,0053826 0,392455093 0,011831275 -0,005085725 -0,00687239 -0,0040446668 14 JSMR 0,0053826 0,890874940 0,011831275 -0,005085725 -0,00687239 -0,0008305455 15 KLBF 0,0053826 0,689916606 0,011831275 -0,005085725 -0,00687239 -0,0021264499 16 LSIP 0,0053826 0,605889615 0,011831275 -0,005085725 -0,00687239 -0,0026683082 17 PGAS 0,0053826 0,564651339 0,011831275 -0,005085725 -0,00687239 -0,0029342383 18 PTBA 0,0053826 0,864624070 0,011831275 -0,005085725 -0,00687239 -0,0009998275 19 SMGR 0,0053826 1,343172946 0,011831275 -0,005085725 -0,00687239 0,0020861535 20 TLKM 0,0053826 1,299178940 0,011831275 -0,005085725 -0,00687239 0,0018024528 21 UNTR 0,0053826 0,845519922 0,011831275 -0,005085725 -0,00687239 -0,0011230229 22 UNVR 0,0053826 0,254607118 0,011831275 -0,005085725 -0,00687239 -0,0049335964
Source : Data Processed by Author, 2015
Based on the calculation using FF3FM method in table 7, it shows the rate of expected return from the shares of Sample Companies. The result is linear with the CAPM method, because the other 2 variables in FF3FM (SMB and HML) is fixed number for all samples. From 22 sample the lowest E(Ri) owned by Unilever Indonesia (UNVR), and the highest owned by Charoen Pokphand Indonesia (CPIN). The result is the same
with the common theory which is higher Beta (β)
provide higher Return.
9. The Security Market Line (SML)
Figure 3. SML of CAPM and FF3FM Source : Data Processed by Author, 2015
Figure 3 shows the SML of CAPM and FF3FM. Both method shows similar trend, because FF3FM is the development of CAPM; it can be shown by sililarities on both formulas.
10.Grouping and Determining of Efficient Stock Investment
Efficient share is the shares with the Rate of Return of Common Stock in One Period (Ri) higher than expected return (E{Ri}) or in other word [(Ri) > E(Ri)]. The inefficient shares means [(Ri) < E(Ri)]. The good shares can be called with Efficient, and the bad shares can be called with Inefficient. The comparation of Ri and E(Ri) for both CAPM and FF3FM can be shown by the figures as follow:
Figure 4. The Efficient and Inefficient shares based on CAPM and FF3FM
Source : Data Processed, 2015
Jurnal Administrasi Bisnis (JAB)| Vol. 28 No. 1 November 2015| administrasibisnis.studentjournal.ub.ac.id
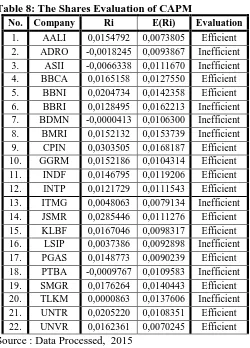
202 11.The Evaluation For The Efficient and
Inefficient Shares of CAPM and FF3FM Table 8: The Shares Evaluation of CAPM
No. Company Ri E(Ri) Evaluation
1. AALI 0,0154792 0,0073805 Efficient 2. ADRO -0,0018245 0,0093867 Inefficient 3. ASII -0,0066338 0,0111670 Inefficient 4. BBCA 0,0165158 0,0127550 Efficient 5. BBNI 0,0204734 0,0142358 Efficient 6. BBRI 0,0128495 0,0162213 Inefficient 7. BDMN -0,0000413 0,0106300 Inefficient 8. BMRI 0,0152132 0,0153739 Inefficient 9. CPIN 0,0303505 0,0168187 Efficient 10. GGRM 0,0152186 0,0104314 Efficient 11. INDF 0,0146795 0,0119206 Efficient 12. INTP 0,0121729 0,0111543 Efficient 13. ITMG 0,0048063 0,0079134 Inefficient 14. JSMR 0,0285446 0,0111276 Efficient 15. KLBF 0,0167046 0,0098317 Efficient 16. LSIP 0,0037386 0,0092898 Inefficient 17. PGAS 0,0148773 0,0090239 Efficient 18. PTBA -0,0009767 0,0109583 Inefficient 19. SMGR 0,0176264 0,0140443 Efficient 20. TLKM 0,0000863 0,0137606 Inefficient 21. UNTR 0,0205220 0,0108351 Efficient 22. UNVR 0,0162361 0,0070245 Efficient Source : Data Processed, 2015
Based on the table 8 and figure 4 above, the analysis result shows that the efficient shares contain Higher Rate of Return of Common Stock than Expected return {(Ri) > E(Ri)}. Based on the CAPM method, from the 22 sample Companies, there are 13 companies contain efficient shares, and the rest 9 companies are inefficient.
Table 9: The Shares Evaluation of FF3FM
No. Company Ri E(Ri) Evaluation
1. AALI 0,0154792 -0,0045776 Efficient 2. ADRO -0,0018245 -0,0025714 Efficient 3. ASII -0,0066338 -0,0007911 Inefficient 4. BBCA 0,0165158 0,0007969 Efficient 5. BBNI 0,0204734 0,0022777 Efficient 6. BBRI 0,0128495 0,0042632 Efficient 7. BDMN -0,0000413 -0,0013281 Efficient 8. BMRI 0,0152132 0,0034158 Efficient 9. CPIN 0,0303505 0,0048606 Efficient 10. GGRM 0,0152186 -0,0015267 Efficient 11. INDF 0,0146795 -0,0000375 Efficient 12. INTP 0,0121729 -0,0008038 Efficient 13. ITMG 0,0048063 -0,0040447 Efficient 14. JSMR 0,0285446 -0,0008305 Efficient 15. KLBF 0,0167046 -0,0021264 Efficient 16. LSIP 0,0037386 -0,0026683 Efficient
No. Company Ri E(Ri) Evaluation
17. PGAS 0,0148773 -0,0029342 Efficient 18. PTBA -0,0009767 -0,0009998 Efficient 19. SMGR 0,0176264 0,0020862 Efficient 20. TLKM 0,0000863 0,0018025 Inefficient 21. UNTR 0,0205220 -0,0011230 Efficient 22. UNVR 0,0162361 -0,0049336 Efficient Source : Data Processed, 2015
Based on the table 9 and figure 4 above, the analysis result shows that the efficient shares contain Higher Rate of Return of Common Stock than Expected return {(Ri) > E(Ri)}. Based on the FF3FM method, from the 22 sample Companies, there are 20 companies contain efficient shares, and the rest 2 companies are inefficient.
The expected return E(Ri) results of FF3FM in this research are less (smaller) than the result calculation of CAPM, it caused by the SMB and HML in this research which is negative. The SML of both methods have the same trend, and it differ by SMB and HML. In the end, the Investing decisions are depend on the investors themselves, because the assumption, is that the perception for each investor is different from the others.
5. CONCLUSION AND SUGGESTION
1. Conclusion
The shares will be categorized into the efficient shares if the Ri is higher than E(Ri) {Ri > E(Ri)}. The average of SMB and HML for period July 2010 – June 2014 are both negative. The sample companies mostly contain positive Ri with
only 4 negative Ri. The highest Beta (β) is owned
by CPIN which resulted highest Ri also owned by CPIN; it is prove that higher beta contain higher return. The result of FF3FM analysis resulted that from 22 sample companies, there are only 2 companies which contain inefficient shares or Ri is less than E(Ri) {Ri.<.E(Ri)}.
Jurnal Administrasi Bisnis (JAB)| Vol. 28 No. 1 November 2015| administrasibisnis.studentjournal.ub.ac.id
203
a. The main differences of the FF3FM than CAPM are that Fama and French added SMB and HML in FF3FM formula, it can be seen from the same trend of SML from both methods.
b. From 22 samples of company shares in this research, CAPM calculation resulting 13 Efficient shares and 9 Inefficient shares; while FF3FM calculation resulting 20 Efficient shares, and only 2 Inefficient shares.
2. Suggestion
For Investors, it would be better if the investors implement both methods in order to generate the best investing decision; because even if we can forecast the future, but the future is still uncertain and unpredictable. For the next researchers who interested in Asset Pricing Models or other related topics, better keep updating the development of Asset Pricing Models; because The Asset Pricing Models is a favourite theory in the business environment. Besides, the best Asset Pricing Model Theory are not yet Found, so it would be interseting to studied.
6. BIBLIOGRAPHY
Bodie, Z. Kane, A. & Marcus, A.J. 2014.
Investments, 10th ed. McGraw-Hill
Brigham, E. F. & Ehrhardt, M. C. 2014. Financial
Management: Theory and Practice,
Fourteenth Edition. South-Western, Cengage Learning.
Eraslan, Veysel. 2013. Fama and French Three-Factor Model: Evidence from Istanbul Stock Exchange. Business and Economics
Research Journal. Volume 4 Number 2
2013. pp. 11-22. ISSN: 1309-2448
Fama, E. F. and K. R. French. 1993. Common Risk Factors in The Returns on Stocks and Bonds. Journal of Financial Economics 33 , 3-56. North Holland.
Goyal, Amit. 2012. Empirical Cross-Sectional Asset Pricing: A Survey. Swiss Society for Financial Market Research. Finance Mark
Portf Manag. 26:3–38. DOI
10.1007/s11408-011-0177-7.
Osamwonyi, I. Osad & Ajao, M. Gabriel. 2014. An Application Of The Fama And French Three Factor Model In The Nigerian Stock Market. Indian Journal of Economics & Business,
Vol. 13, No. 3 : 341-361
Sharma, Renuka & Mehta, Kiran. 2013. Fama and French: Three Factor Model. SCMS Journal of Indian Management
Sudiyatno, Bambang & Irsad, Moch. 2011. Menguji Model Tiga Faktor Fama Dan French Dalam Mempengaruhi Return Saham Studi Pada Saham Lq45 Di Bursa Efek Indonesia. Jurnal Bisnis dan Ekonomi (JBE),
September, Hal. 126 – 136. Vol. 18, No. 2
Suh, Daniel. 2009. Stock Returns, Risk Factor Loadings, and Model Predictions: A Test of the CAPM and the Fama-French 3-factor Model. UMI 3395071.Copyright 2010 by ProQuest LLC.
Van Horne, J. C. & Wachowicz Jr, J. M. 2008.
Fundamentals of Financial Management,
thirteenth edition. Pearson Education