ISSN 0024-9521
IJG Vol. 45, No.1, June 2013 (15 - 23) © 2013 Faculty of Geography UGM and The Indonesian Geographers Association
SPATIAL INEQUALITIES IN THE PROVISION OF PRIVATE
HEALTH FACILITIES IN OYO STATE
Olaniyan Femi Abiodun
Department of Geography, University Ibadan
ABSTRACT
This paper examines the spatial pattern of the provision of private health facilities and what the pattern portends for health needs in an era of global warming using the 33 Local Government Areas of Oyo State as spatial units of analysis. The data used for this study were collected from Oyo State Hospital Management Board and the National Population Commission. The findings of the study generally show that there are enormous spatial inequalities in the provision of private health facilities in the study area. Gini Coefficient and the associated Lorenz Curve confirm that there is generally an unequal distribution of private health facilities in the study area. The curve suggests that the most vulnerable segment of the population to the health consequences of global warming are precluded from utilizing private health facilities. Oyo state’s experience thus shows that there is need for policy measures that will ensure unrestricted access to health facilities in an era of global warming.
Keywords: Health facilities, Private provider, Spatial inequalities, Provision, Global warming.
ABSTRAK
Tulisan ini membahas mengenai pola spasial dari pengadaan fasilitas kesehatan oleh sektor swasta dan bagaimana pola penanda kebutuhan kesehatan dalam era pemanasan global pada wilayah pemerintah daerah di Propinsi Oyo sebagai unit-unit spasial dalam analisis. Data yang digunakan dalam penelitian ini dari Badan Pengelolaan Rumah Sakit dan Komisi Populasi Nasional Propinsi Oyo-Nigeria. Hasil penelitian menunjukan bahwa terdapat kesenjangan spasial yang besar dalam pengadaan fasilitas kesehatan oleh sektor swasta pada daerah penelitian. Koefisien Gini dan Kurva Lorenz yang terkait mengkonfirmasi bahwa secara umum terjadi ketidakmerataan distribusi fasilitas kesehatan swasta pada daerah penelitian. Kurva tersebut menunjukan bahwa segmen dari populasi yang berpotensi mengalami dampak kesehatan dari pemanasan global terkendala dalam memanfaatkan fasilitas kesehatan swasta. Kejadian yang dialami Propinsi Oyo menunjukan perlunya langkah-langkah kebijakan yang menjamin akses fasilitas kesehatan secara bebas dalam era pemanasan global.
INTRODUCTION
Human has substantially modified the physical environment on which his/her existence is inextricably linked. Scientific research and knowledge on climate change have confirmed that there is some link between the current warming of the earth climate and human activities, such as burning of fossil fuel and deforestation, among others [GreenFacts, 2007]. Eleven of the last twelve years (1995 -2006) rank among the 12 warmest years over the last 100 years (1906 – 2005); global temperature has increased by 0.740C
[GreenFacts, 2007]. This phenomenal increase in the global average temperature is aptly described as global warming. Global warming is already having measurable consequences and future impacts are expected to be wide ranging and costly [GreenFacts, 2007]. Global warming has adverse effects on the most fundamental determinants of health such as food, air, water and its health impact will be disproportionately greater in vulnerable population: the very young, elderly, the medically infirm and low income countries where under nutrition is wide spread [Adegboyega, 2008]. There are public health concerns that global warming will expand the areas in which tropical vector diseases can occur. Under warmer conditions, arthropods reproduce faster and hence take more frequent blood meals and thus could result into higher transmission to people [Melinda, et al, 2000]. Warming temperatures, alternating periods of drought and deluges, and ecosystem disruption have contributed to more widespread outbreaks of infections like malaria, dengue fever, tick-borne encephalitis, and diarrheal illnesses. Disease-carrying mosquitoes are spreading as the climate allows them to survive in formerly inhospitable areas. Mosquitoes that can carry dengue fever viruses were previously limited to elevations of 3,300 feet but recently appeared at 7,200 feet in the Andes Mountains of Colombia. These portend new risks to millions of
impoverished people whose health is already challenged. Apparently, the need for health facilities and medical services will increase appreciably because of harsh climatic conditions occasioned by global warming.
SPATIAL INEQUALITIES IN Olaniyan Femi Abiodun
efficiency, acceptability and equity [Wikipedia, 2010]. This paper examines the spatial pattern of provision of the private health facilities in the study area in a bid to ascertaining the extent to which expanded private sector participation in the provision of health facilities has translated to more equitable distribution and improved accessibility of health facilities in an era when the need for health facilities and associated services will increase considerably.
The concepts of Threshold and Range associated with Central Place Theory credited to Christaller, [1933] give some useful insight into some of the underlying factors influencing health facility provision and of the spatial organization of health facilities. Threshold refers to the minimum population that will justify the location of a given facility in any given area or that will make the facility viable. The range is the maximum distance users of a given facility will be willing to travel so as to utilize such a facility. The practical implication of this is that if the threshold population cannot be found within an appropriate range, such a facility will not be provided. These basic concepts provide explanatory framework as to the where and how questions of health facility provision. In other words, the decision of providers of health facilities is influenced to a large extent by the threshold factor availability of good care varies inversely with the need of the population served. In situation of gross socio – economic inequalities, the concept of equity will continue to arouse strong intellectual curiosity. Geographers examine equity from a distinctively spatial perspective. The geographers’ perspective may be summarized as a concern with who gets what, where and how. The stress on where
underlines the geographers’ preoccupation with spatial equity [Smith, 1979].
Spatial equity is defined as a distribution of resources to each area according to the level of need in the area [Davies, 1969, cited in Smith, 1979]. An unequal distribution is not necessarily unjust. Understanding this is vital to the interpretation of inequality, its origin and justification [Smith, 1979]. Equality and equity are by no means synonymous. Equality implies every person receiving the same treatment irrespective of who or where he may be, while equity means fairness or as the Oxford English Dictionary defines it, ‘ recourse to principles of justice’, which implies that people may be given differential treatment if this is deemed fair or just [Smith, 1979]. Aristotle drew a similar distinction by employing two concepts – Arithmetic and proportional equality. Arithmetic equality implies that everyone is treated the same, while proportional equality requires that people receive things in proportional to desert i.e. equal treatment in the same circumstances [Smith, 1979]. Circumstance therefore justifies unequal treatment. differentiation in relation to widely acceptable criteria of distribution inequality. These we may recognize as cases of spatial discrimination. Thus spatial discrimination implies a process with an unfair outcome.
THE METHODS
The list of available private health facilities per Local Government Area (LGA) in Oyo state was obtained from the Oyo State Hospital Management Board in the state’s ministry of health. Total Population of each of the LGAs is used as index of need in this study. The 2006 Census Population data for each LGA were obtained from the National Population Commission (NPC). The study used the best-known inequality index – Gini Coefficient and associated Lorenz Curve to find out the equitable or otherwise in the distribution of private health facilities in the study area. The Pearson Product Moment Correlation was used to test the association (relationship) between private health facilities provision and level of need. The value of (r) ranges from –1 < r < 1. The higher the r coefficient, the stronger the nature of the relationship between observations.
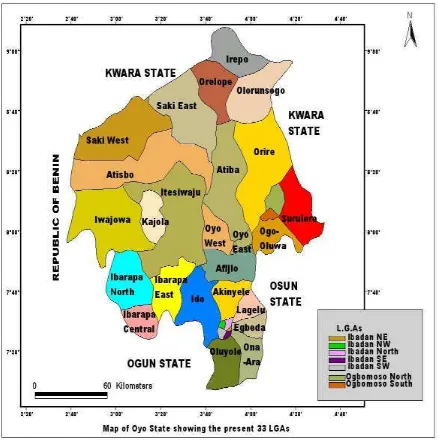
Study Area
Oyo State came into existence on April 1976 when the former Western States of Nigeria was divided into Oyo, Ogun and Ondo states. The total population of Oyo state according to the 2006 Nigeria population census is 5,591,589. Oyo state falls within the South Western zone of Nigeria. The state comprised of 33 Local Government Areas, which are vastly dispersed. The state shares an international boundary with the Republic of Benin to the West; to the South is Ogun State, Osun State to the South East, to the North and North East, Kwara State. The state capital is Ibadan: the largest city in West Africa. The predominant occupation in Oyo State is farming. About 70 percent of the population is engaged in agricultural activities. The State lies between the savannah area to the north and the forest areas of the South. As a result there are both rainforest and savannah areas in the State. The fertile soils in the rain forest areas of the South and South - East are soils that support the cultivation of crops
SPATIAL INEQUALITIES IN Olaniyan Femi Abiodun
Figure.1. Map of Oyo State showing the predent LGAs
RESULTS AND DISCUSSION
Table 1. shows clearly that Ibadan North and Ibadan South LGAs – the most urbanized LGAs in Oyo State account for a substantial proportion of private hospitals in the study area. Each accounts for 27 % and 22% respectively. With the exception of Ibadan South East, Ibadan North West and Egbeda LGAs, the other 28 LGAs each accounts for less than 4% of private hospitals. In fact, Atisbo,
Table.1 Spatial pattern of provision of private health facilities by type to the 33LGAs of Oyo State (2009)
S/N LGAs Percentage private
hospitals Percentage private maternities Percentage private health clinics
1 Ibadan North 27 15 2.3
2 Ibadan NorthWest 5.0 2.7 5.6
3 Ibadan North East 4.0 4.0 5.6
4 Ibadan South West 22 14.6 16
5 Ibadan South East 3.2 7.0 6.8
6 Ibarapa North 0.3 0.2 0
7 Ibarapa East 0.3 1.4 1.7
8 Ibarapa Central 0.5 1.4 1.1
9 Ona Ara 3.2 7.0 1.7
10 Oluyole 2.8 3.3 5.6
11 Lagelu 2.8 4.3 1.7
12 Egbeda 4.0 5.7 5.6
13 Akinyele 3.6 4.1 5.1
14 Iddo 2.3 3.3 2.8
15 Iseyin 2.8 1.6 2.3
16 Itesiwaju 0.5 0.5 1.7
17 Iwajowa 0.5 0.5 0
18 Kajola 0.9 0.5 0.6
19 Atisbo 0.9 0.8 0
20 Saki West 1.4 3.8 2.8
21 Saki East 0.4 0.3 0
22 Irepo 0.9 0.8 1.7
23 Oorelope 0.4 0.3 0
24 Olorunsogo 0.5 0.5 1.1
25 Atiba 0.9 1.9 0.6
26 Oyo West 3.2 1.6 4.0
27 Oyo East 2.3 2.2 0.6
28 Afijio 1.4 1.6 0
29 Orire 0.5 0.8 0
30 Ogbomoso North 2.3 4.3 2.8
31 Ogbomoso South 0.2 1.9 2.3
32 Ogo oluwa 0.3 0.2 0.6
33 Surulere 0.7 1.4 0
SPATIAL INEQUALITIES IN Olaniyan Femi Abiodun
Measurement of inequalities
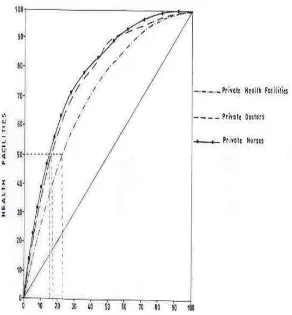
The study used Gini Coefficient (G); one of the best-known inequality index to find out the equitable or otherwise of the spatial distribution of private health facilities in the study area. The Gini coefficient compares the percentage frequency of some attribute with a distributional criterion (Okafor, 1987). The distributional criterion in the context of this study is the population which is the index of need for health facilities i.e. population. A graphical device called Lorenz curve is used in depicting inequality. In plotting the graphs territories are ranked according to their ratios of advantage and the cumulative percentages of the distributed phenomenon (health facilities) are plotted against the cumulative percentages of the distributional criterion (population size). A 45-degree diagonal curve is the line of perfect equality and if the Lorenz curve coincides with the diagonal, then there is perfect equality in the distribution of
facilities. The greater the departures of the Lorenz curve from the diagonal the grater the inequality. The Gini coefficient on the other hand ranges from 0 to 100 or from 0 to 1. 0. A coefficient of zero indicates perfect equality and 100 indicate maximum inequality. The Gini coefficient is given by the following formula:
G = ½ X – Y
Where x is the proportion of the health facilities in Oyo state located within LGi and Y is the proportion of the total population – the index of need in LGA.
Table 2. Gini coefficient for private health facilities
Health Facilities Gini coefficient
Private Health Facilities 30.0
Private Doctors 41.0
Private Nurses 44.0
Table 2 gives the results of Gini-coefficient for private health facilities and personnel. The G values for private health facilities, doctors and nurses are 30, 56, and 41 respectively. Thus indicating that there is enormous spatial inequality in the provision health facilities by private providers. The associate Lorenz curves in Fig.4 equally confirms that there is generally an unequal distribution of private health facilities. Apparently the curves are far away apart from the main 450 diagonal.
Another fascinating thing about Lorenz curve is that it can be used to determine the proportion of the population which controls a given proportion of health facilities. The curves indicate that 25% of the population controls 50% of private health facilities; 20% of the population controls 50% of private nurses and 18% of the population controls 50% of private doctors.
This study has shown quite clearly that the spatial pattern of provision of private health facilities in Oyo State is lopsided. The urbanized LGAs have a disproportionate share of private health facilities to the detriment of the LGAs in rural areas where the most vulnerable population to the health consequences of global warming resides. A very negligible proportion of the population controls a considerable proportion of private health facilities, beds, doctors and nurses. Obviously the segment of the population that can afford the cost of private health services. It cost extremely much to get medical services in private health facilities. And the harsh economic realities in the country preclude the poor masses from utilizing private health facilities. Sadly, the public health facilities that are supposed to be the most accessible are being commercialized. Oyo state’s experiencerepresents in microcosm what obtains in the whole country.
Deriving from the Inverse Care Law, it can be hypothesized that the level of provision of private health facilities is inversely
related to the level of need. Using population as the index of need, a Pearson correlation coefficient was calculated for the relationship between need and provision of private health facilities. A moderate positive correlation (r) value of 0.567 that is significant at 0.01 was found, indicating a significant relationship; i.e., there is a positive correlation between the level of need for health facilities and the provision of private health facilities. In other words private providers respond to the level of need for health facilities. However, the coefficient of determination, which is the square of the correlation coefficient,gives added insight. The coefficient of determination indicates that need accounts for just 32% of the variation in the provision of health facilities by private providers. This suggests that there are other factors, which account for 68% that can be said to be more important to private providers than the need for health care facilities.
SPATIAL INEQUALITIES IN Olaniyan Femi Abiodun (Nigeria inclusive) from malaria to
diarrhea and malnutrition are highly sensitive to climate [Medical News, 2005]. Nigerian populace will be hardest hit by the global surge in infectious diseases, because of chronic poverty in which they are enmeshed. In a recent chilling assessment, the World Health Organization (WHO) reported that human-induced changes in the Earth's climate now lead to at least 5 million cases of illness and more than 150,000 deaths every year [Science Daily, 2005].
CONCLUSION
This study has demonstrated that expanded private sector participation in the provision of health facilities has contributed to spatial inequalities in the provision of health facilities in Oyo State and by extension in Nigeria. A systematic withdrawal of the government from being the main financier and provider of health facilities is not desirable especially in an era of global warming. There is thus the need to put in place measures that will ensure unrestricted access to health facilities, so as to insulate the poor masses from the harsh climatic condition occasioned by global warming.
REFERENCES
Adegboyega, T. (2008), World Health Organization calls for Awareness on Climate Change, The Punch, Friday, April 4.
Christaller, Walter (1933). Die zentralen Orte in S?ddeutschland. Jena: Gustav Fischer, (Translated (in part), by Charlisle W. Baskin, as Central Places in Southern Germany. Prentice Hall 1966).
GreenFacts (2007), Scientific Facts on Climate Change. Retrieved from http://www.greenfacts.org/print.ph p on April 23th 2008.
Hart, J.T (1971), The Inverse Care Law. Lancett 1, 405 - 412.
Meidcal News (2005), Alarming Health Effects of Global Warming Outlined on Regional Scale. Retrieved from [email protected] om on February 6th , 2011.
Melinda, S. and Meade, R (2000), Development Change and Human Health. In Medical Geography 2nd Edition. The Gulford press. New York.
Okafor, S.I (1987), Inequalities in the Distribution of Health Care Facilities In Nigeria. In health and Disease in Tropical Africa ed. Akhtar. R London: Gordon and Breach, pp383-401.
Olaniyan, F.A (2011), Effects of Privatization on the Provision of Health Facilities in Nigeria. Germany: LAP LAMBERT Academic Publishing. ISBN: 978-3-8473-1040-2.
Science Daily (2005), Growing Health Effects of Global Warming Outlined on Regional Scale. Retrieved from http://www.sciencedaily.com on February 6th , 2011.