ENVIRONMENTAL CARRYING CAPACITY BASED ON SPATIAL
PLANNING
Luthfi Muta'ali [email protected]
Faculty of Geography, Universitas Gadjah Mada
ABSTRACT
The aims of this research were to examine environmental carrying capacity analyzed based on aspects of spatial planning and eco-region. The result showed that Kulonprogo Regency has low value of environmental carrying capacity and can only support as much as 79.81% of its total population. Analysis of variance showed significant difference of environmental carrying capacity of protected and cultivated area. The main factor among 12 variables determining the degree of environmental carrying capacity is man-land ratio (contributed 39.72%). Priority should be given to 28 villages or 31.81% of the area with low environmental carrying capacity. Eco-region and spatial plan approaches in environmental management practice are also strongly recommended.
Keywords: carrying capacity, eco-region, spatial planning
ABSTRAK
Tujuan dari penelitian ini adalah untuk menentukan daya dukung lingkungan yang dianalisis berdasarkan aspek perencanaan tata ruang dan eko-wilayah. Hasilnya menunjukkan bahwa Kabupaten Kulonprogo memiliki nilai daya dukung lingkungan rendah dan hanya dapat mendukung 79,81% dari total penduduk. Analisis varians menunjukkan perbedaan yang signifikan antara daya dukung lingkungan kawasan lindung dan budidaya. Faktor utama di antara 12 variabel yang menentukan tingkat daya dukung lingkungan adalah rasio/perbandingan manusia dan lahan (berkontribusi sebesar 39,72%). Prioritas harus diberikan kepada 28 desa atau daerah sebesar 31,81% dengan daya dukung lingkungan yang rendah. Eko-wilayah dan pendekatan tata ruang dalam praktik manajemen lingkungan juga sangat dianjurkan.
Kata kunci : daya dukung, eko-wilayah, perencanaan tata ruang
INTRODUCTION
Development always raises a paradox, one of which is the reduction in environmental quality and carrying capacity. Some experts mentioned that those trends are increasing along with the increasing
human needs Meadows, in Berry, et.al.
[1993]; Djojohadikusumo, [1981]. This
condition, if continuously occurs, at some point will cause environmental crisis characterized by threat of air and water
purity, threat of food ingredients availability, threat of the productivity of the natural wealth of flora and fauna continuity, and so on. If the ecological power has been so weakened, then achieved human welfare becomes meaningless.
Martopo, [1991] stated that many regional development plans pay little attention to environmental carrying capacity resulting © 2011 Faculty of Geography UGM and
capacity of region. Sugandhy, [1994] indicated that the variation of the
environmental carrying capacity,
especially agricultural land has not been considered in spatial planning. Therefore, frequent confusion occurred in decisions making concerning the areas and activities priority, particularly regarding to spatial utilization.
The opinion was supported by the
Association of Planner [IAP, 2010], which
stated that ideal planning should be synchronized with existing conditions as well as to the environmental carrying capacity so that the indication of decline in environmental carrying capacity and potential of disasters can be anticipated and minimized. Nevertheless, in reality, most of the current existing spatial plans have not accommodated or been based on the environmental carrying capacity.
This is understandable, given that there has been information scarcity of variation of environmental carrying capacity which is integrated with spatial planning. Thus, the environmental carrying capacity in a spatial perspective needs to be examined in relation to regional development and spatial planning. Besides the mentioned practical aspect, theoretical issues are also the reason for conducting this research. There is still lack of literatures linking environmental carrying capacity with spatial aspects.
From the above descriptions, a number of research issues are raised in this study:
1. What are the amount and variety of
environmental carrying capacity in research location in terms of the variety of structures and spatial utilization?
2. What are the elements of
environment that become the determinant of the amount of variation of environmental carrying capacity in research location?
3. What is the balance estimation
between the population and environmental carrying capacity on
a variety of structures and spatial utilization?
4. What is the policy implication of
the spatial plan model that is integrated with environmental carrying capacity?
In general, this study aimed to 1) assess the amount of environmental carrying capacity in research location in terms of the variety of structures and spatial utilization, 2) analyze elements of the environment determining the amount of variation of environmental carrying capacity, 3) predict or estimate the balance between population and environmental carrying capacity on a variety of structures and spatial utilization, 4) prepare and determine an alternative of spatial plan integrated with the environmental carrying capacity as a prerequisite for sustainable development.
Region as "living systems" reflects the linkage between development and environment. Changes in it will affect the environmental components and quality. Often the changes bring negative impacts due to exceeding environmental carrying capacity. However, in a period, the carrying capacity can be increased due to factors of social change and technological intervention McConnell, and Daniel C.
Abel, in JCN, [UNEP , WWF, 2007].
Environmental carrying capacity is the ability of the environment in supporting
population resulting in a balance [Young,
1976; Catanesse, 1986; Anonymous,
2009]. During its development, carrying capacity is applied to various dimensions,
for instance Soemarwoto, [1985] examined
from the side of population pressure on agricultural land; Odum, Howard, and
Issard in Dasman, [1992] examined from
the harvested area and productivity approaches.
New concept was developed by Rusthan,
coefficient value: natural reserve (1.00), wildlife (1.00), tourism parks (1.00), hunting parks (0.82), protected forest (1.00), reserved forest (0.61), production forest (0.68), large plantation (0.54),
community plantation (0.42), rice field (0.46), field (0.21), pasture (0.28), lakes/ponds (0, 98), timber plant (0.37), urban settlement (0.18), vacant land (0.01).
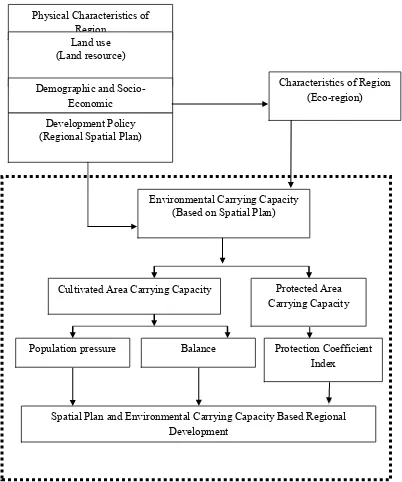
Figure 1. Framework showing the link between concepts and environmental carrying capacity based on spatial planning
THE METHODS
This research was an analytical descriptive study with analysis of secondary data and field observations (primary data). To obtain a spatial phenomenon, spatial analysis approach was used.
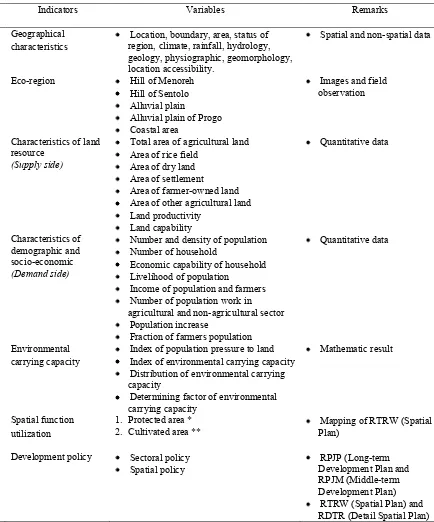
The study was conducted in Kulonprogo Regency with village as the unit of analysis, 88 villages are divided into 12 districts with a variety of spatial functions. The substance of the research related to indicators and variables of the study are illustrated in Table 1.
Cultivated Area Carrying Capacity Protected Area Carrying Capacity Physical Characteristics of
Region
Characteristics of Region (Eco-region)
Environmental Carrying Capacity (Based on Spatial Plan)
Population pressure Balance Protection Coefficient Index
Land use (Land resource)
Demographic and Socio-Economic Development Policy (Regional Spatial Plan)
Table 1. Used indicators and variables of this research
No Indicators Variables Remarks
1 Geographical
characteristics region, climate, rainfall, hydrology, Location, boundary, area, status of geology, physiographic, geomorphology, location accessibility.
Spatial and non-spatial data
2 Eco-region Hill of Menoreh Hill of Sentolo Alluvial plain
Alluvial plain of Progo Coastal area
Images and field observation
3 Characteristics of land resource
(Supply side)
Total area of agricultural land Area of rice field
Area of dry land Area of settlement Area of farmer-owned land Area of other agricultural land Land productivity
Land capability
Quantitative data
4 Characteristics of demographic and socio-economic (Demand side)
Number and density of population Number of household
Economic capability of household Livelihood of population
Income of population and farmers Number of population work in agricultural and non-agricultural sector
Population increase
Fraction of farmers population
Quantitative data
5 Environmental
carrying capacity Index of population pressure to land Index of environmental carrying capacity Distribution of environmental carrying capacity
Determining factor of environmental carrying capacity
Mathematic result
6 Spatial function
utilization 1.2. Protected area * Cultivated area ** Plan) Mapping of RTRW (Spatial
7 Development policy Sectoral policy
Spatial policy Development Plan and RPJP (Long-term RPJM (Middle-term Development Plan)
RTRW (Spatial Plan) and RDTR (Detail Spatial Plan)
Description:
*) Consists of Subordinate Protected Area (Forest Protection and Water Infiltration); Local Protected Area, Natural reserves, conservation and heritage; Disaster Prone Areas and Geological Protection
**) Consists of the Forest Zone (production forest and community forest), Agriculture, Fishery, Livestock, Mining, Industry, Tourism, Settlement (Rural and Urban Area)
The technique of determining the environ-mental carrying capacity was conducted by using two approaches, namely the concept of population pressure on agricultural land by Soemarwoto, Otto, [1984] modified to index of environmental carrying capacity
and protection function index of [Rusthon;
maps of the determination of environmental carrying capacity on various spatial utilization, (2) correlation analysis to determine the relationship of protection index and environmental carrying capacity, (3) analysis of variance to analyze differences in protection index and environmental carrying capacity in various types of eco-regions, and (4) factor analysis, to assess the determinants of en-vironmental carrying capacity.
RESULT AND DISCUSSION
Environmental Carrying Capacity of Kulonprogo Regency
Two main approaches used to assess the environmental carrying capacity in Kulonprogo Regency are the index of
protection and carrying capacity.
Protection index describes the environ-mental conditions and carrying capacity describes the ability of the environment in supporting activities of people living on it. Protection index ranges from 0 to 1. The closer the number to 1 signifies better environmental conditions, otherwise the farther the number from 1 signifies worse environmental conditions. Likewise the carrying capacity value, the higher the value (above 1), the better its ability to support population activities. Conversely, the lower the value (<1), the worse its ability to support activities of people living on it.
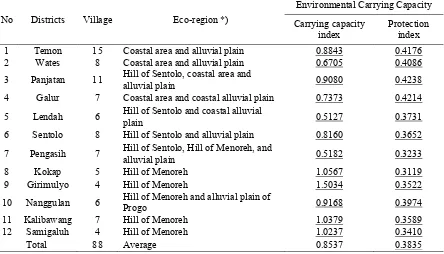
The result of the calculation of environmental capacity in Kulonprogo Regency illustrated that the current environment of Kulonprogo Regency is less capable of supporting current existing population (carrying capacity value of 0.85).
Several districts in Kulonprogo need to be concerned if there are restrictions on land conversion program due to the population pressure, including district of Pengasih, Lendah, and Wates. Environmental
conditions in those districts are relatively low compared to other districts. Socio-economic activities, such as industry, trade, and services look fairly crowded. In addition, the availability of basic service facilities is also more complete. As a result, there is a relatively high concentration of population and increase of land pressure. Fertile eco-region condition of district of Wates, Pengasih, and Lendah, where most of their territories consist of alluvial plains, is another factor that causes the high land pressure (see Table 2).
Kulonprogo Regency Protection Index (Table 2) described the environmental conditions of Kulonprogo. Protected Index was compiled by taking into account wide variations of land use for the utilization of protection and cultivation functions. Constant value was given for each utili-zation function reflecting its ability to support the environment. The main concept was the utilization of protected functions which has a constant value higher than the utilization of cultivation function. As the implication, the broader the availability of land intended for protection function, the higher the value of protection index.
Table 2. Environmental carrying capacity Index of Kulonprogo Regency
No Districts Village Eco-region *)
Environmental Carrying Capacity Carrying capacity
index Protection index 1 Temon 15 Coastal area and alluvial plain 0.8843 0.4176 2 Wates 8 Coastal area and alluvial plain 0.6705 0.4086 3 Panjatan 11 Hill of Sentolo, coastal area and alluvial plain 0.9080 0.4238 4 Galur 7 Coastal area and coastal alluvial plain 0.7373 0.4214 5 Lendah 6 Hill of Sentolo and coastal alluvial plain 0.5127 0.3731 6 Sentolo 8 Hill of Sentolo and alluvial plain 0.8160 0.3652 7 Pengasih 7 Hill of Sentolo, Hill of Menoreh, and alluvial plain 0.5182 0.3233
8 Kokap 5 Hill of Menoreh 1.0567 0.3119
9 Girimulyo 4 Hill of Menoreh 1.5034 0.3522 10 Nanggulan 6 Hill of Menoreh and alluvial plain of Progo 0.9168 0.3974 11 Kalibawang 7 Hill of Menoreh 1.0379 0.3589 12 Samigaluh 4 Hill of Menoreh 1.0237 0.3410
Total 88 Average 0.8537 0.3835
Environmental index value in each district does not tend to be much different, especially in the southern districts of Kulonprogo like Temon, Wates, Panjatan, and Galur. The average of environmental index values in those areas is over 0.4. Protection functions in flood prone areas dominate the role of utilization function to index establishment. Whereas in other districts such as Sentolo, Girimulyo, Nang-gulan, Kalibawang, and Samigaluh, the role of protection functions in flood prone areas is relatively low.
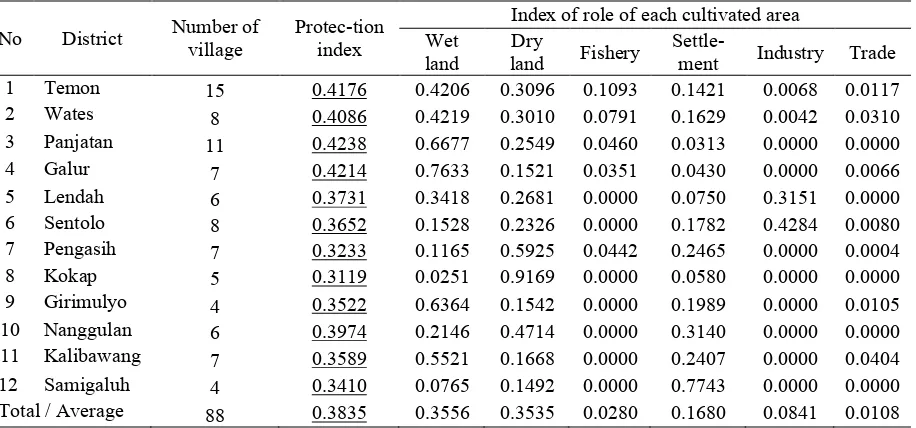
The value of protection index in cultivation area is not much different from the value of the index in the protected area. This fact illustrated that the environmental conditions in the cultivated area is still fairly good. Meanwhile, when examined from the utilization, it can be seen that the wetland and dry land have a dominant role to the environment conditions in Kulonprogo. The contribution of the environmental index of wetland and dry land is 0.3556 and 0.3535 consecutively.
Of the 12 analyzed districts, it was identified that three districts need the attention associated with the efforts to increase environmental functions. These
three districts are Kokap, Pengasih, and
Samigaluh. The value of the
environmental index of the three villages is lower compared to other districts, which is 0.350 lower. Efforts to improve environmental conditions are primarily focused on the utilization functions of fishery and industrial areas. It is based on the low index value of the role of the environment, amounting to 0.00 (Table 4).
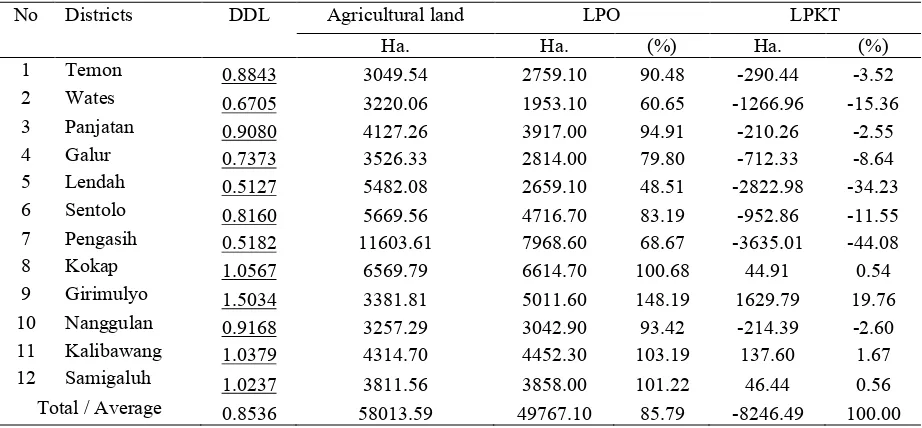
It was identified that Kulonprogo Regency required an optimal area of 49,767.10 hectares of agricultural land to support the balance of the environmental carrying capacity. In fact, Kulonprogo currently lacks of about 8246.49 ha of agricultural land (Table 6). Meanwhile, of the 12 districts in Kulonprogo, there are four districts that still have agricultural land above the optimum area, i.e. districts of Girimulyo, Kalibawang, Samigaluh, and Kokap. Other districts have less agricultural land. In those areas, agricultural production is only able to meet the food needs for half of the population, so that the food needs must be imported from other regions to meet the needs of the other half of the population.
Relations Index of Environmental Protection and Carrying Capacity
Identification of relationships between Index of protection and Environmental Carrying Capacity was conducted using a cross-table of two components of the environmental carrying capacity. The results of the correlation analysis showed that, although not too closely, the
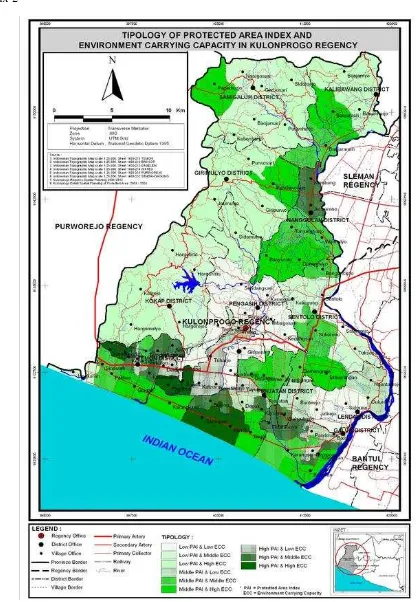
relationship between the index of protection and environmental carrying capacity is positive, meaning that the higher the protection indexes, the higher the environmental carrying capacity. Based on the analysis of the cross-table, nine types of environmental control are also proposed as presented in Table 7, and shown spatially in Figure 2. (Appendix-2).
Table 3. Protection index in protected areas of Kulonprogo
No Districts Number of Village
Protection Index
Index of role of each protected area Subordinate
protection protection Local
Flood prone area
Landslide
prone area Heritage 1 Temon 15 0.4176 0.0000 0.0426 0.9358 0.0216 0.0000 2 Wates 8 0.4086 0.0000 0.0755 0.9131 0.0114 0.0000 3 Panjatan 11 0.4238 0.0000 0.0312 0.9688 0.0000 0.0000 4 Galur 7 0.4214 0.0000 0.5597 0.4403 0.0000 0.0000 5 Lendah 6 0.3731 0.0000 0.7745 0.2255 0.0000 0.0000 6 Sentolo 8 0.3652 0.0000 1.0000 0.0000 0.0000 0.0000 7 Pengasih 7 0.3233 0.5707 0.0579 0.0068 0.3646 0.0000 8 Kokap 5 0.3119 0.6538 0.0028 0.0012 0.3421 0.0000 9 Girimulyo 4 0.3522 0.3975 0.0041 0.0000 0.5984 0.0000 10 Nanggulan 6 0.3974 0.8060 0.0881 0.0000 0.1058 0.0001 11 Kalibawang 7 0.3589 0.3728 0.0683 0.0000 0.5185 0.0404 12 Samigaluh 4 0.3410 0.4353 0.0001 0.0000 0.5646 0.0000
Total/
Average 88 0.3835 0.4552 0.0563 0.0771 0.4066 0.0048
Description: The value of 0.000 indicates that in the region there is no corresponding spatial function.
Table 4. Protection Index on Cultivated area of Kulonprogo.
No District Number of village Protec-tion index Wet Index of role of each cultivated area
land land Dry Fishery Settle-ment Industry Trade 1 Temon 15 0.4176 0.4206 0.3096 0.1093 0.1421 0.0068 0.0117 2 Wates 8 0.4086 0.4219 0.3010 0.0791 0.1629 0.0042 0.0310 3 Panjatan 11 0.4238 0.6677 0.2549 0.0460 0.0313 0.0000 0.0000 4 Galur 7 0.4214 0.7633 0.1521 0.0351 0.0430 0.0000 0.0066 5 Lendah 6 0.3731 0.3418 0.2681 0.0000 0.0750 0.3151 0.0000 6 Sentolo 8 0.3652 0.1528 0.2326 0.0000 0.1782 0.4284 0.0080 7 Pengasih 7 0.3233 0.1165 0.5925 0.0442 0.2465 0.0000 0.0004 8 Kokap 5 0.3119 0.0251 0.9169 0.0000 0.0580 0.0000 0.0000 9 Girimulyo 4 0.3522 0.6364 0.1542 0.0000 0.1989 0.0000 0.0105 10 Nanggulan 6 0.3974 0.2146 0.4714 0.0000 0.3140 0.0000 0.0000 11 Kalibawang 7 0.3589 0.5521 0.1668 0.0000 0.2407 0.0000 0.0404 12 Samigaluh 4 0.3410 0.0765 0.1492 0.0000 0.7743 0.0000 0.0000 Total / Average 88 0.3835 0.3556 0.3535 0.0280 0.1680 0.0841 0.0108
Description: The value of 0.000 indicates that in the region there is no corresponding spatial
Table 5. Balance of Environmental Carrying Capacity and Population of Kulonprogo
No Districts DDL Population JPO JPTT
Inhabitant Inhabitant (%) Inhabitant (%) 1 Temon 0.8843 24428 22038 90.21 -2391 3.69 2 Wates 0.6705 27698 16306 58.87 -11392 17.59 3 Panjatan 0.9080 30707 28810 93.82 -1897 2.93 4 Galur 0.7373 27653 21803 78.85 -5849 9.03 5 Lendah 0.5127 38438 18706 48.67 -19732 30.47 6 Sentolo 0.8160 39391 32934 83.61 -6458 9.97 7 Pengasih 0.5182 82697 55501 67.11 -27196 41.99 8 Kokap 1.0567 41230 40947 99.31 283 +0.44 9 Girimulyo 1.5034 43569 33019 75.78 10550 +16.29 10 Nanggulan 0.9168 25725 23814 92.57 -1910 2.95 11 Kalibawang 1.0379 31364 30493 97.22 871 +1.34 12 Samigaluh 1.0237 27378 27019 98.69 359 +0.55 Total/Average 0.8536 440279 351391 79.81 -64762 100.00 Environmental Carrying Capacity (DDL), Number of optimum population able to be supported by agricultural land (JPPO), JPPO = DDL. f. Po (1 + r )t, Number of Population not able to be supported by agricultural land (JPTT), JPTT = (1-DDL). f. Po (1 + r )t
Table 6. Balance of Environmental Carrying Capacity and Area of Land of Kulonprogo
No Districts DDL Agricultural land LPO LPKT
Ha. Ha. (%) Ha. (%)
1 Temon 0.8843 3049.54 2759.10 90.48 -290.44 -3.52 2 Wates 0.6705 3220.06 1953.10 60.65 -1266.96 -15.36 3 Panjatan 0.9080 4127.26 3917.00 94.91 -210.26 -2.55 4 Galur 0.7373 3526.33 2814.00 79.80 -712.33 -8.64 5 Lendah 0.5127 5482.08 2659.10 48.51 -2822.98 -34.23 6 Sentolo 0.8160 5669.56 4716.70 83.19 -952.86 -11.55 7 Pengasih 0.5182 11603.61 7968.60 68.67 -3635.01 -44.08 8 Kokap 1.0567 6569.79 6614.70 100.68 44.91 0.54 9 Girimulyo 1.5034 3381.81 5011.60 148.19 1629.79 19.76 10 Nanggulan 0.9168 3257.29 3042.90 93.42 -214.39 -2.60 11 Kalibawang 1.0379 4314.70 4452.30 103.19 137.60 1.67 12 Samigaluh 1.0237 3811.56 3858.00 101.22 46.44 0.56 Total / Average 0.8536 58013.59 49767.10 85.79 -8246.49 100.00 Environmental Carrying Capacity (DDL), Area of Optimal Agricultural Land (LLPO), LPO = b.Ltot x (1/DDL), Area of additional agricultural land to support population (LPKT), LPKT = (1/DDL–). b.Ltot
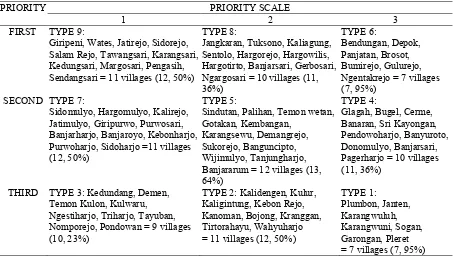
Table 7. Relationship of Index of Protection and Environmental Carrying Capacity
Protection
Index High Environmental Carrying Capacity Moderate Low
High = 7 villages (7, 95%) Type 1: = 11 villages (12, 50%) Type 2: = 9 villages (10, 23%) Type 3:
Moderate = 10 villages (11, 36%) Type 4: = 12 villages (13, 64%) Type 5: = 7 villages (7, 95%) Type 6:
Low =11 villages (12, 50%) Type 7: = 10 villages (11, 36%) Type 8: = 11 villages (12, 50%) Type 9
Based on those assumptions, from the table above, it can basically be grouped into three priority areas, namely:
1. The first priority, consisting of region of type 6, type 8 and type 9, has the characteristics of the low carrying ca-pacity and moderate to low protection index.
2. The second priority, consisting of region of type 4, type 5 and type 7, has the characteristics of moderate to high carrying capacity and the moderate protection index.
3. The third priority, consisting of region of type 1 (low protection index, high environmental carrying capacity), type 2 (low protection index, moderate environmental carrying capacity), and type 3 (low protection index, low environmental carrying capacity), has the characteristics of low to high carrying capacity and low protection index.
Based on the priority model in controlling environmental problems, typology table of environmental management is created (Table 8).
Determinant Factors of Environmental Carrying Capacity
Environmental carrying capacity is influenced by many factors. Some identified factors are the number and density of population, number of farmer population, percentage of population income from non-agricultural sector, land area for a decent living, intensity of land use, area of irrigated field, rained rice field, garden, field, settlement, and other non-agricultural land use.
Statistically, the KMO test and Bartlett’s test to 12 variables show that those variables are worth further analysis to measure the environmental carrying capa-city. This stated that the 12 variables are mutually independent and have adequate variance to the formation of the carrying capacity of Kulonprogo. Therefore, the tests are able to simplify variance of 12 variables into four variables in explaining the environmental carrying capacity (Table 9).
Table 8. Environmental Controlling Priority Based on the Spatial Plan of Kulonprogo
PRIORITY PRIORITY SCALE Sendangsari = 11 villages (12, 50%)
TYPE 8:
Jangkaran, Tuksono, Kaliagung, Sentolo, Hargorejo, Hargowilis, Hargotirto, Banjarsari, Gerbosari, Ngargosari = 10 villages (11, 36%) Banjararum = 12 villages (13, 64%)
Table 9. Variance Test, Number of Component Factors Formed on the Environmental Carrying Capacity Variable of Kulonprogo Regency.
Component Initial Eigenvalues Extraction Sums of Squared Loadings Total % of Variance Cumulative % Total % of Variance Cumulative % 1 5.561 39.719 39.719 5.561 39.719 39.719 2 1.959 15.990 55.709 1.959 13.990 53.709 3 1.482 8.587 64.296 1.482 10.587 64.296
4 1.053 7.518 71.814 1.053 7.518 71.814
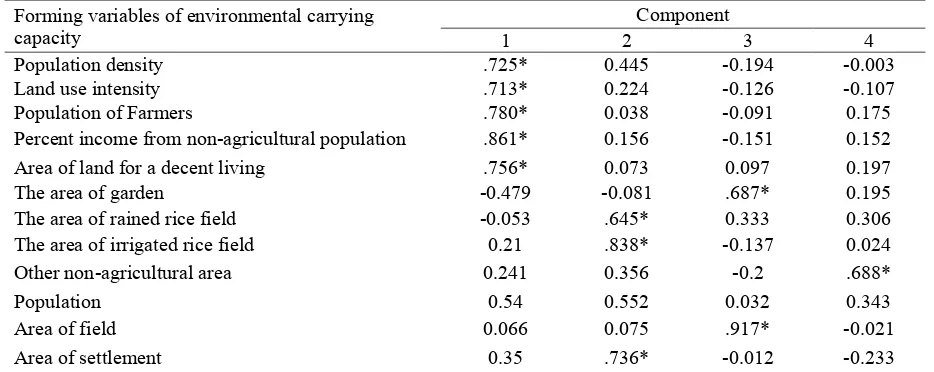
To determine the role and relationship strength of each variable on the formed factors, the calculation of the loading factor (figures in the table) by conducting the rotation of matrix components was conducted. Component or factor 1 is formed by five variables marked with (*) i.e. (sorted from the biggest influence) the income of non-agricultural, non-farm worker population, land area for a decent
living, the population of farmers, and land-use intensity. Factor 2 is formed by area variable for irrigated and rained agricultural land and settlements. Factor 3 is formed by agricultural potential variables, and the potential of gardens and fields, whereas Factor 4 is formed by other non-agricultural variables. More can be examined in Table 10.
Table 10. Rotated Component Matrix Test in Factor Analysis, Variables Forming the Environmental Carrying Capacity of Kulonprogo Regency.
Forming variables of environmental carrying
capacity 1 2 Component 3 4
Population density .725* 0.445 -0.194 -0.003 Land use intensity .713* 0.224 -0.126 -0.107 Population of Farmers .780* 0.038 -0.091 0.175 Percent income from non-agricultural population .861* 0.156 -0.151 0.152 Area of land for a decent living .756* 0.073 0.097 0.197 The area of garden -0.479 -0.081 .687* 0.195 The area of rained rice field -0.053 .645* 0.333 0.306 The area of irrigated rice field 0.21 .838* -0.137 0.024 Other non-agricultural area 0.241 0.356 -0.2 .688*
Population 0.54 0.552 0.032 0.343
Area of field 0.066 0.075 .917* -0.021
Area of settlement 0.35 .736* -0.012 -0.233
Extraction Method: Principal Component Analysis. Rotation Method: Varimax with Kaiser Normalization.
*) Variable-forming factors
Based on the above variable characteristics of determining factors, then the naming of factors was performed:
1. Factor 1, with contribution of
39.72%, is MAN-LAND RATIO
2. Factor 2, with contribution of
15.99% is RICE LAND FACTORS
3. Factor 3, with contribution of
8:58% is NON-RICE FIELD FACTOR
4. Factor 4, with contribution of
7:52% is NON AGRICULTURAL LAND
Thus, the factor of environmental carrying capacity of Kulonprogo Regency is determined by the MAN-LAND RATIO. The higher the ratio of land and population characterized by the magnitude of land-population ratio, then it is expected that the environmental carrying capacity process will increase.
The second factor affecting the environmental carrying capacity is agricultural land, especially the rice field that includes both irrigated and rained rice fields, and settlement variables. As an agricultural area, the environmental carrying capacity in Kulonprogo is largely determined by the presence of agricultural land. On the other hand, although the contribution of the settlement area is not too high, there is a tendency that the more the density of the settlement increases, the lower the environmental carrying capacity. Two other influential factors are the variable of agricultural land, especially non-agricultural land (garden and field) and other utilization areas (trade and industry), although the effect is not too large. Based on the components of the above factors, it a model of environmental carrying capacity of Kulonprogo Regency can be set up as follows:
Y = a + b1 MAN-LAND RATIO + b2 RICE FIELD FACTOR + b3 NON-RICE
FIELD AGRICULTURAL LAND
FACTOR + b4 NON AGRICULTURAL LAND
Y = dependent variable (carrying capacity) a = constant
bn= regression coefficients
CONCLUSION
Based on the results of the study and analysis, it can be concluded that:
1 Environmental condition in
Kulonprogo Regency is only capable of supporting 79.8 percent of the population. This condition indicates that its environmental carrying capacity is relatively low. Of the 12 districts, there are only four districts that are still able to
provide adequate support. Based on
the eco-region, the terrain
experiences high pressure, whereas in hilly eco-region, although the protection index is small, the intensity of the utilization and population pressure is very high. 2 The result of the analysis of the
environmental carrying capacity based on the spatial pattern also shows the variation in the role of utilization functions. In the utilization of protected areas, the highest contribution index is in the subordinate protected area (0.45), while in the cultivated area, it is located in the cultivation of wetland agricultural and dry land (0.350).
3. The tests of KMO and Bartlett’s
identified 12 variables used to measure environmental carrying capacity. Of the 12 variables, there are four groups of important factors that contributed 71.8 percent of the total information. The first factor that gives the largest contribution of 39.72% is the man-land ratio. Furthermore, based on the analysis of these factors, a model of levels of environmental carrying capacity can be set up as follows:
Y = a + b1 MAN-LAND RATIO + relationship patterns of index of protection and environmental carrying capacity (cross tab), 9 typology regions, which can further be simplified into three priorities of development and environmental management, are obtained. The first priority should be given to as much as 28 villages, or 31.81%, with the characteristics of low
carrying capacity, and the
ACKNOWLEDGEMENT
I would like to give my grateful thanks to the Graduate School of Gadjah Mada University which has funded the research under the HIBAH PASCASARJANA 2010 scheme
REFERENCES
Undang - Undang Nomor 32 (2009),
tentang Pengendalian Pengelolaan Lingkungan Hidup (in bahasa).
Undang - Undang Nomor 27 (2007),
tentang Penataan Ruang (in bahasa).
Berry, Brian J.L., C. Edgar C. and D.M.
Ray (1993), The Global Economy:
Resource Use, Locational Choice and International Trade, Prentice Hall, (New Jersey).
Catanesse, J. Anthony and J. Snyder
(1990), Pengantar Perencanaan
Kota, Airlangga, Jakarta (in bahasa).
Dasman, R. (1992), Prinsip Ekologi Untuk
Pembangunan. Terjemahan Idjah Soemarwoto, Gramedia, Jakarta (in bahasa).
Djojohadikusumo, S. (1981), Indonesia
Dalam Perkembangan Dunia: Kini dan Masa Datang, LP3ES, Jakarta.
IAP (2010), KLHS: Integrasi Pengelolaan
Lingkungan dalam Rencana Tata Ruang Wilayah, www.iap.or.id (in bahasa).
JCN, UNEP and WWF (1991), Carrying for the Earth: A Strategy for Sustainable Living, The World
Conservation Union, United
Nations Environment Programme and World Wide Fund for Nature, Gland, Switzerland.
Mantra, I.B. (1991), Profil Penduduk Indonesia Menjelang Era Tinggal
Landas, Kertas Kerja Seminar
Penduduk dan Lingkungan Hidup,
PAU Studi Sosial UGM,
Yogyakarta (in bahasa).
Martopo, S. (1991), Aplikasi Penelitian
Geografi Untuk Perencanaan Pengembangan Wilayah, Suatu Pendekatan Ekosistem. Fakultas Geografi UGM, Yogyakarta (in bahasa).
Muta’ali, L. (1993), Analisis Daya Dukung
Lingkungan Kabupaten Kebumen.
Fakultas Geografi UGM,
Yogyakarta (in bahasa).
Lang R. and A. Andrey (1991),
Environmental Planning. McGill
College Publication, Canada.
Rusthon, U. (1998), Dinamika Perubahan
Penggunaan Lahan dengan
Menggunakan Sistem Dinamis.
Disertasi, IPB, Bogor (unpublished).
Salim, E. (1996), Pembangunan
Berwawasan Lingkungan, LP3ES, Jakarta (in bahasa).
Salim, E. (1991), Pembangunan
Berkelan-jutan, Majalah Prisma, Edisi
Planning, Indonesian Journal of
Demography,i-ii, 1-15.
Sugandhy, A. (1994), Penataan Ruang Wilayah Berwawasan Lingkungan dalam Menunjang Pembangunan
Berkelanjutan, Jurnal PWK, 5(16),
13-21.
Appendix-1.
Techniques of Analysis of Environmental Carrying Capacity
Some of the methods used to analyze the results of the study:
1. To determine the environmental carrying capacity, the modified concept of population
pressure on agricultural land by Otto Soemarwoto, [1984] was used.
Description:
Z = Area of land for a decent life, operationally land use approach will
be used
A = non-agricultural income of farmers (%)
F = population of farmers (%)
Po = population at the beginning of the year
R = Population growth
T = Period of the year
B = agricultural land that can be utilized by residents (%)
Ltot = Total area of agricultural land
The higher the index values of environmental carrying capacity, the better the environmental conditions of a region. To determine balance of population and resources, modified formula of Muta'ali was used (1993)
Number of optimal population able to be supported by agricultural land (JPPO)
JPPO = DDL. f. Po (1 + r) t
Number of population not able to be supported by agricultural land (JPPTT)
JPPTT = (1-DDL). f. Po (1 + r) t
Area of optimal agricultural land (LLPO)
LLPO = b.Ltot x (1/DDL)
Area of additional agricultural land to support population (LLPT)
LLPT = (1/DDL - 1). b.Ltot
2. To determine the environmental carrying capacity, the concept of protection function
index (IL) by Uton Rusthon was used (1998).
IKLL = ((il + 1.a1 + il2.a2 il3.a3 iln.an +) / LW
IKLL = Index of Environmental Protection Area
a1 = Area of land use type 1
il = Protection coefficient for land use i
LW = Area of region
The protection coefficient values: natural reserve (1.00); wildlife (1.00), tourism parks (1.00); hunting parks (0.82), protected forest (1.00); reserved forest (0.61), production forest (0.68); large plantation (0.54), community plantation (0.42), rice field (0.46); field (0.21), pasture (0.28); lakes/ponds (0, 98); timber plant (0.37); urban settlement (0.18); vacant land (0.01).
The higher the protection coefficient value, the greater the ability of regions to give environmental protection and maintain sustainable development
DDL = 1/TP
DDL = Environmental Carrying Capacity
TP = Pressure of Population
TP = Z (1-a) f. Po (1 + r) t
ENVIRONMENTAL CARRYING CAPACITY Lutfhi Muta’ali
155
Appendix-2