IJG Vol. 47, No.2, December 2015 (124 - 131) © 2015 Faculty of Geography UGM and he Indonesian Geographers Association
Land Use Projection for Spatial Plan Consistency in Jabodetabek
Diyah Novita Kurnianti, Ernan Rustiadi and Dwi Putro Tejo Baskoro
Received: 23 09 2015 / Accepted: 05 12 2015 / Published online: 15 02 2016 © 2015 Faculty of Geography UGM and he Indonesian Geographers Association
Abstract Land use changes in Greater Jakarta area are very dynamic because of the need for settlements and converting
agricultural land. It indicates land use inconsistency regard to spatial plan that can cause land damage in the future. Land use which has potential inconsistency in the future are requires for land use control in this region. his study uses spatial analysis to look at the potential inconsistencies by comparing land use projection in the future in two scenarios that is with and without control by policies. Policies in this study are land suitability and forest allocation. he result shows that land use consistency with policies raise until 97,4 % but only 93.9 % without control by policies. Areas that could potentially have inconsistency in the future are Bogor, Bekasi, Tangerang and Jakarta North City for area which is directed as forest and bufer zones of cultivation.
Abstrak Perubahan penggunaan lahan di kawasan Jabodetabek sangat dinamis dimana kebutuhan lahan permukiman
meningkat dan mengkonversi lahan pertanian. Hal ini mengindikasikan terjadinya inkonsistensi penggunaan lahan terha-dap rencana tata ruang yang beresiko menyebabkan terjadinya kerusakan lahan. Potensi inkonsistensi penggunaan lahan di masa datang diperlukan dalam pengendalian pemanfaatan ruang di kawasan ini. Penelitian ini menggunakan analisis spasial untuk melihat potensi inkonsistensi yaitu dengan membandingkan proyeksi penggunaan lahan di masa datang yang diserahkan sepenuhnya kepada mekanisme pasar tanpa kontrol kebijakan dan yang mendapat kontrol kebijakan. Kontrol kebijakan dalam penelitian ini berupa kesesuaian lahan dan peruntukan kawasan hutan. Penggunaan lahan di masa datang yang mendapat kontrol kebijakan menaikkan nilai konsistensi penggunaan lahan terhadap rencana tata ruang menjadi sebesar 97,4 % dibandingkan tanpa kontrol sebesar 93,9 %. Wilayah yang berpotensi terjadi inkonsistensi terhadap tata ruang di masa datang adalah Bogor, Bekasi, Tangerang dan Kota Jakarta Utara pada zona yang diarahkan sebagai hutan dan kawasan penyangga budidaya.
Keywords: Inconsistency, Land use change, Land use projection, Potential inconsistencies
Kata kunci: Inkonsistensi, Perubahan penggunaan lahan, Proyeksi penggunaan lahan, Potensi inkonsistensi
Jakarta as well as capital of the state and also capital of government, has great interests. he high economic activity and availability of facilities and infrastructure caused Jakarta has a high interest to people around Jakarta and also from the other regions. Urbanization has an impact on area development not only on population growth, but also economy, social and political structures (Bhatta, 2010).
Land requirement for those economic activities cause land use changes. Agricultural land is the most land use converted into other land use especially for settlements. Area development of Jakarta leads to areas surrounding Jakarta that is Bogor, Depok, Tangerang and Bekasi supported by transport facilities such as roads and transportation (bus, train and another type of transportation).
he emergence of settlements and industries around Jakarta or called Bodetabek showed
Diyah Novita Kurnianti
Bogor Agricultural Institute, Geospatial Information Agency Email: [email protected]
Ernan Rustiadi and Dwi Putro Tejo Baskoro Bogor Agricultural Institute
suburbanization (Rustiadi and Panuju, 2002). he emergence of corridors manufacturing and low density settlements causing problems for urban sustainability in the development of the Greater Jakarta area (Hakim 2010). According to Rustiadi et al. (2009), land use has problems can’t be solved with partial approaches and require integrative approaches such aseiciency of allocation and distribution resources, resources possess and environmental degradation.One of the problems is land use ineicient such as emergence of corridors of manufacture and low density settlements like sprawl following the road pattern.
Peter and Glenn (2014) said that ater 1980, urban expansion was most likely to occur close to existing buildings and arterial roads, suggesting nucleation outside the historical urban core. he research of Trisasongko et.al (2009) said that highways connecting Jakarta with cities surround it were one factor in agricultural land conversion into settlements. It because of access is one of the main considerations in selecting location for settlement.
Nowadays, land use change tends to be supported by informal processes which dominate land use allocation in Jabodetabek (Susantono 1998). his
informal process indicates less obedient from people as user and less control from the government itself. It causes land use that is not appropriate with spatial plan called inconsistency. Land suitability is one of the considerations uses in making spatial plan. Spatial plan inconsistency is feared have negative impact such as land degradation which can damage sustainability of land resources.
Generally, this study analyzed land use in Jabodetabek in the future which has potential inconsistencies which is required in spatial plan control. Speciically, there are 4 objectives to be achieved as follows:
a. Analyze land use change period between 1995 and 2012 and the factor inluence;
b. Analyze land use projection in 2028;
c. Analyze the consistency of existing land use in 2012 and 2028 projections with Jabodetabek spatial plan deined by Presidential Decree number 54 year 2008; d.Analyze potential inconsistencies occurred in Jabodetabek.
2. he Methods
he study is conducted in Jabodetabek which has area is about 680,775.69 hectares. Greater Jakarta area has 3 landform characteristics. Northern region in this area is coastal area, in the middle is lowland area and in southern are hills and highlands. hose landform characteristic afect the physical characteristics of the land and afects the types of land use.
he complexity of Jabodetabek situation needs method which can give solution that can integrates physic and socio-economic factors. Arsanjaniet. al (2013) said that a hybrid model consisting of logistic regression model, Markov chain (MC), and cellular automata (CA) was designed to improve the performance of the standard logistic regression model which integrating environmental and socio-economic factors, which are not considered in current CA models. here are 3 analyzes in this study as follows: (1) spatial analysis, (2) statistical analysis and (3) tabular analysis. he data used in this study are spatial data as follows:
a. Land use in Jabodetabek in 1995, 2012 and 2028 scale 1:50.000;
b. Indonesian topographical base map for Jabodetabek year 2011 scale 1:25.000;
c. Land system for Jabodetabek in scale 1: 250.000; d. Forest allocation map from Ministry of Forestry scale 1:25.000; and
e. Spatial plan for Jabodetabekpunjur year 2008 scale 1:50.000.
Land use data in Jabodetabek in 1995 and 2012 were secondary data which derived from Centre for Regional System Analysis, Planning and Development–Bogor Agricultural Institute. Land use data were interpreted from Landsat imagery with resolution 30 meters.
a. Spasial Analysis
Spatial analysis was performed in: (1) analyzing land use change, (2) making scenarios and land use projections, (3) analyzing land use consistency towards spatial plan and (4) analyzing land use potential inconsistencies.
Land use change information in Jabodetabek was derived from analysis using markov chain method. his analysis using data land use in certain period which is in this research using year 1995 and 2012 depend on data availability and considering year of land use projection will make. 2028 was chosen as the year of land use projection because it is ending of spatial plan regulation in Jabodetabek namely Presidential Decree number 54 year 2008.
his research use CA-Markov method in making land use projection. his method was combining form markov- chain and cellular automata.
Markov chain is a technique used to estimate the changes in the future by calculate probability of land use change over a period of time. his technique can also be used to make predictions of dynamic variables in the future mathematically. Markov chain explains the movements of several variables over a period of time in the future based on the movements of these variables in the present. he formula can be written as below:
Kt(j) = P x Kt(j-1) Where:
Kt(j) = probability in t(j) P = transitional probability t(j) = time for j
Basic concept of Markov is transition where the transition is only depends on present and not from previous condition. In other words, Markov chain is a series of events in which conditional probability upcoming events depending on current events. Table 1 illustrates land use change into other land uses.
Cellular Automata (CA) is a grid or cell-based modeling, in which nucleus of cells interact with neighboring cells. CA is a common method for spatial interaction models, to make land use model and simulate several types of land use. CA is counting pixels based on the weight of its surrounding pixels (neighborhood). One method used in CA is the Von-Neumann Neighborhood where pixel cell value is inluenced by the value of neighbor cells. CA set pixel to change based on inluence of its closest neighbors. CA with he Von-Neumann Neighborhood can be described in Figure 1.
Land use projection was made in 2 scenarios as follows: (1) land use change is following market mechanism without control by policy, (2) land use change inluenced by policy. Policies in this research were land suitability and forest allocation from Ministry of Forestry. hose scenario were using in cellular automata to ilter pixel value changes.
using overlay method to determine suitability of land use with spatial plan while land use potential inconsistencies was analysis using data of land use projection scenario 1 and 2 with also overlay method.
Table 1. Markov Transition Matrix
Transition to
Expected to C1 C2 . Cn
C1 C11 C12 . C1n
C2 C21 C22 . C2n
. . . . C.n
Ci Ci1 Ci2 Ci. Cin
Figure 1. CA with the Von-Neumann neighborhood Source: http://cell-auto.com
b. Statistical Analysis
Statistical analysis was performed to determine the amount of the factors afecting land use changes using binary logistic regression method, which was performed by spatial data too. Statistical method used in this research was binary logistic regression. Land use change for settlement was used as dependent variable and distance from roads as independent variables. Type of road used are arterial, collector and highway. Roads data were derived from Indonesian topographical map and spatial plan from each city/regency in Jabodetabek. his analysis resulted in two outputs that are regression equation and land use change for settlement probability showed in a map.
Binary logistic regression expressed as below: Y’ = α + b1X1 + b2X2 + … + bkXk
Y’= dependent variable
a= constant
b1,b2, bk = regression coeisient from each independent variable
X1, X2, Xk = independent variables
c. Tabular Analysis
Tabular analyzes was conducted to obtain more information from the results of spatial analysis.
3. Result and Discussion
Land use data in this research was divided into 5 classes that is forest, rice ield, dry land agriculture, settlement and water body. Description of each class is presented in Table 2.
Table 2. Description of Each Class
Class Description
Forest Primary and secondary forest Settlement Settlement and industrial area Dry land agriculture Plantations, shrubs, open space Rice ield Rain fed and irrigation rice ield Water body Lake, pond, river, swamp
a. Spatial Analysis (1) Land Use Change
Land use change in Jabodetabek was dominated by land use change into settlements. It showed on two land use data in year 1995 and 2012 illustrated in Figure 2. From those data showed signiicant increase in settlements leads to east, west and south of the Greater Jakarta area while forest is quite signiicant converted into dry land agriculture and rice ield.
Land use change can be seen from area of each land use in those data. Spatial data was extract into data tabular to get information about area of each land use in year 1995 and 2012 and then calculate the area diference of each class. Land use change period 1995 and 2012 presented in Table 3. From Table 3 we get the information that in period between 1995 and 2012, the highest land use change is settlement which is increasing until 16,2 % while the highest land use
conversion is forest about 9,6 %.
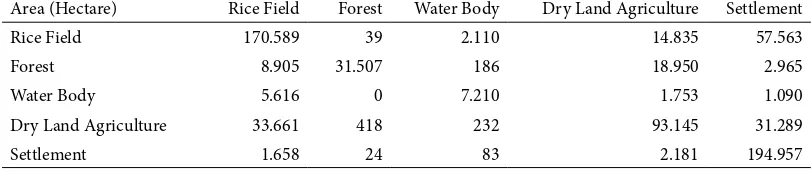
Land use change trend in period 1995 and 2012 shown by the results from markov chain method which analyzed spatially (Table 4). he result displayed in matrix containing area of each class (rows) that turn into other class (columns). he rows and columns that form a diagonal matrix show that land use remains the same as previous land use.
he largest area converted into other land use is rice ield which is converted into settlement as much as 57.563 hectares and the second is dry land agriculture turn into settlement as much as 31.289 hectares. Forest converted into other agricultural land, most of it is converted into dry land agriculture.
(2) Land Use Projection
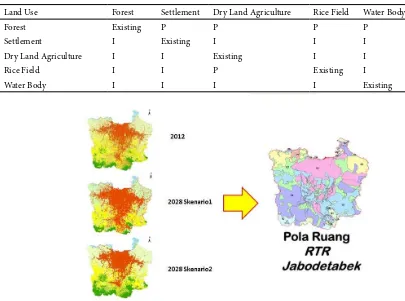
Land use projection was made in year 2028 into 2 scenarios. he purpose of making 2 scenarios is to compare land use in the future with and without control by policies. Furthermore, from those 2 scenarios we can get the information about potential infringement land use toward spatial plan. hose scenarios made in spatial data and used in cellular automata process to ilter pixel value changes which shows which area could change into other land use and which area couldn’t.
Scenario one is land use projection following market mechanism without control by policy. Land use projection was made by considering land use change trend between 1995 and 2012, existing land use and one direction land use change. Scenario 1 is illustrated in Figure 3 and one direction land use change is shown in Table 5. Color area shows areas be permitted change into other land use and white area is not. he color chosen in scenarios are adapted from the color from
land use data. From Table 5, “P” means possible and “I” means impossible.
Water body in scenario 1 and 2 using the existing water body which is obtained from land use existing data in 2012. Green color in scenarios 2 means areas be permitted change into other land use and white area is not.
Land use projection as results using scenario 1 and 2 were illustrated in Figure 5. Index Kappa for accuracy from land use projection with scenario 1 is 0,77 which means good agreement while land use projection with scenario 2 is 0,52 which means moderate agreement.
(3) Land Use Consistency Towards Spatial Plan Land use consistency was performed to show the level of compliance about land use towards spatial plan. In this research, land use consistency was performed on land use data in 2012 as existing and land use projection in 2028 scenario 1 and 2 using overlay method with spatial plan.
Spatial plan of Jabodetabek is part of spatial plan of Jabodetabekpunjur. his spatial plan was assigned in Presidential Decree no 54 year 2008. Spatial plan of Jabodetabek is regulation of land use to preserve the environment and sustainability of natural resources in this region. Spatial plan Jabodetabek is divided into several zones in which there is plan utilization in accordance with their respective zones. here are 2 zones: conservation and cultivation zone. Cultivation zone was divided into 2 zones that are cultivation zone and water area bufer cultivation zone.
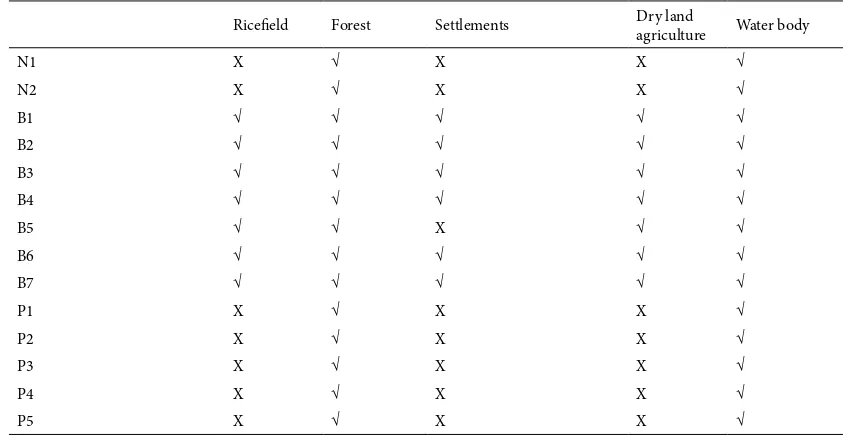
Consistency matrix was made to translate the regulation into spatial plan data by adjusting land use data with its regulation then subsequently used
Table 3. Land Use Change in Jabodetabek Period Between 1995 and 2012*
Class 1995 2012 Diference
Hectares % Hectares % %
Forest 129,571.3 18.9 63,734.5 9.3 -9.6
Settlement 91,216.5 13.3 203,109.4 29.5 16.2 Dryland
agricul-ture 174,874.7 25.5 161,635.9 23.5 2.0
Rice ield 261,262.9 38.1 243,514.5 35.4 -2.7 Water body 28,808.0 4.2 15,578.5 2.3 -1.9
*) Percent calculated by total area of Jabodetabek
Tabel 4. Land Use Change Trend Period Between 1995 and 2012
Area (Hectare) Rice Field Forest Water Body Dry Land Agriculture Settlement
Rice Field 170.589 39 2.110 14.835 57.563
Forest 8.905 31.507 186 18.950 2.965
Water Body 5.616 0 7.210 1.753 1.090
Dry Land Agriculture 33.661 418 232 93.145 31.289
Figure 6. Land use consistency analysis towards spatial plan Figure 3. Land use change in Scenario 1
Table 5. One Direction Change Scenario
Land Use Forest Settlement Dry Land Agriculture Rice Field Water Body
Forest Existing P P P P
Settlement I Existing I I I
Dry Land Agriculture I I Existing I I
Rice Field I I P Existing I
Water Body I I I I Existing
Figure 4. Land use change in scenario 2
to perform consistency analysis. Consistency matrix is shown in Table 6 and consistency analysis was illustrated in Figure 6. he sign “√” means consistent and “X” means not consistent.
he results show that in 2012 as existing land use, consistency achieve 95,8 % toward spatial plan. Land use projection scenario 1 achieve only 93,9 % while scenario 2 achieve 97,4 %. It shows that policies needed in land use control in the future, to maintain purpose achievement of spatial plan in this region.
(4) Land Use Potential Inconsistencies
Land use potential inconsistency was performed to show areas which have infringement potency towards spatial plan in the future. he analysis was done with overlay method using land use projection data scenario 1 and 2. he assumption used in this analysis is land use projection in 2028 consistent with spatial plan in scenario 2, but not consistent in land use projection in scenario 1.
he results obtained from this analysis are spatial and tabular information areas that have potential inconsistencies in the future. here are 4 administration area which has potential inconsistencies that is Bogor, Bekasi, Tangerang and North Jakarta City. Most of areas have potential inconsistencies directed as forests and aquatic bufer cultivation. Most of area in Bogor, potential inconsistencies occure in southern which are protected areas such as Halimun-Salak Mountain National Park. and Gede-Pangrango National Park. Forest potential to be converted into others land use mainly as dryland agriculture and others as rice ield and settlement.
Bekasi and Tangerang has the same potency, most of land use in this area potential to be used as settlements in the future. Northern part of Bekasi and
Tangerang which is directed as water area has potential inconsistency most to be used as settlements.
North Jakarta City has potential inconsistencies in area which is directed as forest. Forest in this city is used as mangrove forest as conservation area. Potential inconsistencies spatially illustrated in Figure 7 and information about city/regency which has potential inconsistency is described in Table 7.
b. Statistical Analysis
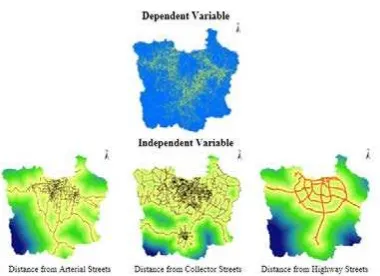
Statistic analysis was done in this research use binary logistic regression. Dependent variable in this analysis is land use change for settlement period between 1995 and 2012 and independent variable is distance from road. here are 3 types of roads as independent variable that is considered afected land use change for settlements. he roads are arterial, collector and highway. Road data used in this analysis is distance from the road, which derived from bufer from its road. his statistical analysis was done by spatial analysis using Idrisi sotware. he results from this analysis were regression equation and probability land use change for settlement map. Regression equation as result is shown below:
Y = -0,88 – 0,05*X1 – 0,03*X2 – 0,06*X3 Where:
Y = Land use change for settlement between 1995 and 2012
X1 = distance from arterial streets X2 = distance from collector streets X3 = distance from highway streets
From 3 roads used in this analysis, distance from highway is the most afected in land use change from settlement.
Dependent variable, independent variable illustrated in Figure 8. And second result from this Table 6. Concistency Matrix
Riceield Forest Settlements Dry land
agriculture Water body
N1 X √ X X √
N2 X √ X X √
B1 √ √ √ √ √
B2 √ √ √ √ √
B3 √ √ √ √ √
B4 √ √ √ √ √
B5 √ √ X √ √
B6 √ √ √ √ √
B7 √ √ √ √ √
P1 X √ X X √
P2 X √ X X √
P3 X √ X X √
P4 X √ X X √
Figure 7. Potential inconsistencies in 2028 in Jabodetabek
Table 7. Potential Inconsistencies City/Regency in 2028
City/Regency and Spatial Plan Zona Area (Hectares)
Bogor Regency (N1 and N2) 14,668
Bekasi Regency (N1, B5, P1 and P4) 5,475
Tangerang Regency (N1,B5, P1 and P5) 3,869
North Jakarta City (N1, P2, P3 and P5) 240
analysis was probability map land use change for settlement illustrated in Figure 9. From Figure 9 we get the information that the highest probability in land use change for settlement is shown by blue area while yellow area shows the lowest.
4. Conclusion
Spatial analysis is very helpful in land use change in accordance with the spatial plan which can be used in spatial controlling. Land use projection is used to predict land use in the future by using current land use. CA-Markov method is very helpful in making future projections spatially considering trend of land use changes and desired scenario. Land use projection with 2 scenarios be used to calculated the level consistencies and to obtained information about potential inconsistencies.
Consistency is one indicator of compliance of land use towards its regulation, so land use projection made in two scenarios ie with and without control policy. Both scenarios are also used to obtain information about potential inconsistencies land use in the future in accordance which is used in spatial plan control.
he highest land use change in Jabodetabek between 1995 and 2012 is for settlements. he needs of settlements threaten agricultural land such as forest, rice ield and dry land agriculture. Development of settlements in Jabodetabek indicated following growth of road network especially highway, so that area around roads especially highway needs high intention in land use control. Furthermore, from potential inconsistencies high intention in land use control is also needed in areas which is directed as forest and water area where bufer cultivation area.
References
Arsanjani JJ, Helbich M, Kainz W, Boloorani AD (2013), Integration of Logistic Regression, Markov Chain and Cellular Automata Models to Simulate Urban Expansion, Amsterdam (NL):
Elsevier-International Journal of Applied Earth Observation
and Geoinformation, 265-275, doi: 10.1016/j.
jag.2011.12.014
Bhatta, B (2010), Analysis of Urban Growth and Sprawl from Remote Sensing Data, Springer, New York, United States.
Fitriani R, Harris M (2011), he Extent Of Sprawl In he Fringe Of Jakarta Metropolitan Area From he Perspective Of Externalities, Australian Agricultural
and Resource Economics Society Conference, Melbourne, Australia.
Hakim, I (2010), Struktur Ruang dan Isu Keberlanjutan Perkotaan di Jabodetabek, Majalah Perencanaan Pembangunan, Jakarta, Indonesia.
Hardjowigeno, Widiatmaka (2007), Evaluasi Kesesuaian Lahan dan Perencanaan Tataguna
Lahan, Gadjah Mada University Press Yogyakarta,
Indonesia.
Peter ES, Glenn RM (2014), Factors Driving Land Use Change and Forest Distribution on he Coastal Plain of Mississippi, USA, Landscape and Urban Planning Journal, 121, 55-64.
Rustiadi E, Panuju DR. (2002). Spatial Pattern of Suburbanization and Land Use Change Process: Case Study in Jakarta Suburb. In Yukio Himiyama et.al, Land Use Changes in Comparative Perspective.
Enield (USA) and Plymouth (UK) : Science Publishers, Inc.
Rustiadi E, Saefulhakim S, Panuju DR (2009),
Perencanaan Pengembangan Wilayah, Crestpent Pr.
dan Yayasan Obor Indonesia, Jakarta, Indonesia. Susantono B (1998), Transportation Land Use Dynamics
in Metropolitan Jakarta, Berkeley (US): Berkeley
Planning Journal-Department of City and Regional Planning, 12(1), 126-144.
Trisasongko BH, Panuju DR, Iman LS, Harimurti, Ramly AF, Anjani V, Subroto H (2009), Analisis Dinamika Konversi Lahan di Sekitar TOL Cikampek,
Kementerian Lingkungan Hidup dan P4W-IPB, Jakarta, Indonesia.