2
nd
ANNUAL REPORT
OF THE
DIABETES IN CHILDREN
AND
ADOLESCENTS REGISTRY
2006 -2008
EDITORS:
Fuziah Md Zain
Janet Hong Yeow Hua
Wu Loo Ling
Fatimah Harun
Rahmah Rasat
2
nd
ANNUAL REPORT
OF THE
DIABETES IN CHILDREN
AND ADOLESCENTS
REGISTRY
2006-2008
Editors
Fuziah Md Zain
Janet Hong Yeow Hua
Wu Loo Ling
Fatimah Harun
Rahmah Rasat
Muhammad Yazid Jalaludin
Jamaiyah Haniff
Jaya Purany Stanley Ponniah
Mohamad Adam Bujang
Premaa Supramaniam
DiCARE is funded by a grant from:
Ministry of Health, Malaysia (MOH)
Malaysian Paediatric Association (MPA)
Published by:
Diabetes in Children and Adolescents Registry, Malaysia 1st Floor, MMA House
124, Jalan Pahang 53000 Kuala Lumpur Malaysia.
Telephone : (603) 40443060 Direct Fax : (603) 40443080 E-mail : [email protected]
Website : www.acrm.org.my/dicare
Important information:
This report is copyrighted. It may however be freely reproduced without the permission of the Diabetes in Children and Adolescents Registry. Acknowledgement would be appreciated. Suggested citation is: Fuziah Md Zain, Janet Hong Yeow Hua, Wu Loo Ling, Fatimah Harun (Eds). 2nd Report of Diabetes in Children and Adolescents Registry (DiCARE) 2006-2008. Kuala Lumpur 2012.
This report is also published electronically on the website of the Diabetes in Children and Adolescents Registry at: www.acrm.org.my/dicare
ISSN ………..1985-4900
October 2012
© Diabetes in Children and Adolescents Registry, Malaysia
Publisher:
FOREWORD
As the Chairperson and Principal Investigator of Diabetes in Children and Adolescent
Registry (DiCARE), I present the second report of the DiCARE database.
This report is an analysis of 408 patients with diabetes from 34 hospitals in Malaysia in year
2006-2008. It is the collaborative effort of hospitals under the Ministry of Health (MOH)
Universiti Kebangsaan Malaysia Medical Centre (UKMMC), University Malaya Medical
Centre (UMMC) and Clinical Research Centre.
The registry will be later expanded to involve all general hospitals nationwide as well as
private and army hospitals. The case report form (CRF), the notification form and the annual
census form were reviewed after the first technical report was published to further simplify
data collection. It includes personal profile of patients, their clinical presentation, duration
and type of diabetes, management, complications and outcomes. The result of this registry
will be presented in the executive summary.
On behalf of DiCARE, we express our sincere appreciation for the writing effort and
commitment of all those who were involved in this registry including the hospital staff
concerned. During the conduct of this data collection, we continued to identify limitations
that required improvement. It was unfortunate that DiCARE was suspended from
2008-2009 due to financial constraint but was revived in 2011. We then successfully conducted
two workshops in March and November 2011 to train new source data providers for data
collection. Subsequently, we have seen an encouraging increase in the number of
participation from more MOH hospitals. Results presented in this report may not reflect our
national data as the participation is still not nationwide.
Finally, we hope that we will still continue to provide comprehensive and ongoing database
that will enable us to improve the quality of diabetes care among the young in Malaysia.
Dr Fuziah Md Zain
Chairperson & Principal Investigator
ACKNOWLEDGEMENT
The Diabetes in Children and Adolescents Registry (DiCARE) thank the following individuals:
Our source data providers who are paediatricians, physicians, staff nurses and medical assistances from the government and university hospitals, for their commitment, hard work and timely data submission
The Paediatrics and Internal Medicine departments, Ministry of Health hospitals
The Paediatrics and Internal Medicine Departments, University hospitals
Clinical Research Centre, Kuala Lumpur
Most importantly, our special thanks to all members of the expert panels for their expertise and for devoting their valuable time and effort in preparing, analyzing, writing and editing the various chapters.
I
THE DIABETES IN CHILDREN AND ADOLESCENTS REGISTRY
(DiCARE)
What Is It About and Rationale
The Diabetes in Children and Adolescents Registry (DiCARE) is a Ministry of Health (MOH) supported registry whose aim is to collect information about diabetes mellitus in children and adolescents in Malaysia. It was officially launched on 30th August 2006 and was the first step towards establishing a national diabetes mellitus registry among children and adolescents.
The objectives are to:
1. Determine the number and the time trend of diabetes mellitus in children and adolescents in Malaysia
2. Determine the socio demographic profiles of these patients to better identify high risk groups in our Malaysian population
3. Determine the number, evaluate and monitor the outcomes of intervention in terms of metabolic control and complications
4. Stimulate and facilitate research using this registry
DiCARE is an ongoing real-time register of case series patients with various types of diabetes mellitus aged below 18 years seen in the participating Medical and Paediatric Clinics of the Ministry of Health hospitals and in the local university hospitals. The source data providers (SDP) first filled up the case report format (CRF) of notification and then the annual census CRF at the end of each year. The registry captured the required data via eDiCARE, a web-based case reporting system coordinated by the Clinical Research Centre, Hospital Kuala Lumpur. All diabetes cases among children and adolescent should be notified to this registry, and thereafter updated yearly at year end to monitor their diabetes control and complications.
II
Hospital Putrajaya (HPJ) and Hospital Kuala Lumpur (HKL). DiCARE was launched nationwide in August 2006 to act as a uniform data collection system and subsequently to provide a profile of diabetes in the young in this country.
We published the 1st Annual Report of DiCARE 2006-2007 whereby 240 patients were reported. Their age ranged from 1.1 - 19.8 years, with no gender predominance (45.8% boys and 54.2% girls). The mean (SD) age at diagnosis was 7.7 (0.6) years old with mean (SD) duration of diabetes of 3.9 (0.5) years. In terms of ethnicity, Malays constituted 45.4%, Chinese 32.5% and Indians 19.2%. Of these patients, 69.2% (166/240) have type 1 diabetes mellitus (T1DM) and 17.5% (42/240) type 2 diabetes mellitus (T2DM) while 7.5% have other types of diabetes.
The diagnoses were based on incidental, clinical and/or biochemical data. Most patients (80.4%) practised home blood glucose monitoring. At least once in the past one year, 66.7% patients were seen by dietitian, 50.0% by diabetes educator and 45.0% by ophthalmologist. However, only 10% patients carried a medic alert. The 2006 annual census on 185 patients revealed poor glycaemic control based on the reported mean HbA1c levels of 9.8%. Of these HbA1c level, 6.0% (3/50) T1DM
patients and 20.0% (4/20) T2DM patients achieved target HbA1c of less than 7.5%.
The first report’s sample size was small and would not represent the population.
In addition, under reporting by the source data providers were a major problem, causing an underestimation of the incidence and prevalence of diabetes in the young. There can be various probable reasons for under reporting of cases and these include the lack of awareness, limited infrastructure or manpower to notify and submit year-end census. During the study period, some sections in the CRF that were found to be unclear or confusing were discussed among the co-investigators and were subsequently improved.
III
Organization of DiCARE
Sponsors :
The DiCARE is sponsored by the the following organizations:
Ministry of Health (MOH)
Malaysian Paediatric Association (MPA)
Malaysian Endocrine and Metabolic Society (MEMS) Sponsor
Governance Board
CRC Technical Support
Expert Panel DiCARE Office
IV
CRC Technical Support Staff
V
Table A: Distribution of patients with diabetes mellitus by source data providers (SDPs), Malaysia 2006-2008
SDP id SDP Total
n % 1001 Putrajaya Hospital 24 5.9 1002 Kuala Lumpur Hospital 9 2.2 1003 Universiti Kebangsaan Malaysia Medical Centre 142 34.8 1004 Universiti Malaya Medical Centre 97 23.8 1005 Kluang Hospital 5 1.2 1006 Universiti Sains Malaysia Hospital 6 1.5 1007 Kuala Terengganu Hospital 13 3.2 1008 Melaka Hospital 0 0.0 1009 Ampang Hospital 0 0.0 1010 Sarawak General Hospital 11 2.7 1011 Saratok Hospital 1 0.2 1020 Sabah Women & Children Hospital, Likas/Likas
Hospital 9 2.2
1021 Tuanku Jaafar Hospital 7 1.7 1022 Tuanku Fauziah Hospital 18 4.4 1023 Sultanah Aminah Hospital 42 10.3
VI
TABLE OF CONTENTS
THE DIABETES IN CHILDREN AND ADOLESCENTS REGISTRY (DiCARE)...I ORGANIZATION OF DiCARE...III DiCARE GOVERNANCE BOARD (CUM EXPERT PANEL MEMBERS) 2006-2008..IV
TABLE A: DISTRIBUTION OF PATIENTS WITH DIABETES MELLITUS BY
SOURCE DATA PROVIDERS (SDPS), MALAYSIA 2006-2008………...……..V
TABLE OF CONTENTS...
CHAPTER 2: TYPE 1 DIABETES MELLITUS…………...7
2.1 SOCIO-DEMOGRAPHIC PROFILES OF T1DM...8
2.2 CLINICAL CHARACTERISTICS AT PRESENTATION...10
2.3 MANAGEMENT OF T1DM...13
2.4 OUTCOMES OF T1DM...21
CHAPTER 3: TYPE 2 DIABETES MELLITUS…………...29
3.1 SOCIO-DEMOGRAPHIC PROFILES OF T2DM...30
3.2 CLINICAL CHARACTERISTICS AND ANTHROPOMETRICS OF T2DM AT PRESENTATION………...32
3.3 MANAGEMENT OF T2DM...35
3.4 OUTCOMES OF T2DM...41
CHAPTER 4: OTHER TYPES OF DIABETES...48
VII
RECOMMENDATION...50
REFERENCES...52
APPENDIX 1: ...54
APPENDIX 2: ...59
APPENDIX 3: ...62
APPENDIX 4: ...64
APPENDIX 5: ...67
VIII
LIST OF TABLES
Table 1.1.1.1 Summary of patient characteristics for patients with diabetes
mellitus, DiCARE 2006-2008 (N=408)...6
Table 2.1.1.1 Summary of patient characteristics for patients with T1DM,
DiCARE 2006-2008...8 Table 2.1.3.1 Family history for patients with T1DM, DiCARE 2006-2008 N=293)..10 Table 2.1.3.2 Details of family history of diabetes for T1DM patients, DiCARE
2006-2008 (N=46)...10 Table 2.2.1.1 Presentation at diagnosis of T1DM, DiCARE 2006-2008 (N=293)...11 Table 2.2.1.2 Symptomatic presentation at diagnosis of T1DM, DiCARE
2006-2008 (N=275)...11 Table 2.2.1.3 Symptoms of non-DKA patients at diagnosis, DiCARE 2006-2008 (N=113)...12 Table 2.3.1.1 Treatment and Insulin Regimen at diagnosis of T1DM patients, DiCARE 2006-2008...14 Table 2.3.2.1 Treatment and Insulin Regimen at year-end annual census of
T1DM patients, DiCARE 2006-2008...15 Table 2.3.3.1 Self-care practices of T1DM patients at year-end annual census, DiCARE 2006-2008...17 Table 2.3.3.2 Frequency of SMBG for T1DM patients at year-end census,
DiCARE 2006-2008...18 Table 2.3.3.3 Ketone testing on sick days / severe hyperglycaemia, DiCARE
2006-2008...18 Table 2.3.4.1 Attendance for multi-disciplinary management in the last 12
months, DiCARE 2006-2008...19 Table 2.3.4.2 Number of visits to multi-disciplinary team in the last 12 months, DiCARE 2006-2008...20 Table 2.4.1.1 Outcome of T1DM patients by 31st December 2008, DiCARE
2006-2008...21 Table 2.4.2.1 Frequency of hospitalisation due to diabetes related condition of T1DM patients in the past 12 months, DiCARE 2006-2008...22 Table 2.4.2.2 Hospitalisation by diabetes-related complications for T1DM
IX
Table 2.4.3.1 Chronic complications of T1DM patients in the past 12 months, DiCARE 2006-2008...23 Table 2.4.3.2 Complications by age group of T1DM patients in the past 12
months, DiCARE 2006-2008...23 Table 2.4.3.3 Duration of diabetes in relation to chronic complications of T1DM patients, DiCARE 2006-2008...24 Table 2.4.4.1 Glycaemic control by age group of T1DM patients in the past 12 months, DiCARE 2006-2008...25 Table 2.4.4.2 Glycaemic control of T1DM patients in the past 12 months,
DiCARE 2006-2008...25 Table 2.4.4.3 Frequency of HbA1c measurement of T1DM patients in the past 12 months, DiCARE 2006-2008...26 Table 2.4.5.1 Comorbidities of T1DM patients in the past 12 months, DiCARE 2006-2008)...27 Table 2.4.6.1 Distribution of reclassification of diagnosis for T1DM patients in the past 12 months, DiCARE 2006-2008...28
Table 3.1.1.1 Summary of patient characteristics for patients with T2DM,
DiCARE 2006-2008...30 Table 3.1.2.1 Family History of Diabetes for T2DM Patients, DICARE 2006-2008 (N=72)...31 Table 3.1.2.2 Details of Family History of Diabetes for T2DM Patients, DICARE 2006-2008 (N=48)...32
Table 3.2.1.1 Presentation at diagnosis of T2DM, DiCARE 2006-2008 (N=72)…....33 Table 3.2.1.2 Symptomatic presentation at diagnosis of T2DM, DiCARE
2006-2008 (N=52)...33 Table 3.2.1.3 Symptoms of non-DKA patients at diagnosis, DiCARE 2006-2008 (N=34)...33 Table 3.3.1.1 Treatment and Insulin Regimen at diagnosis of T2DM patients, DiCARE 2006-2008...36 Table 3.3.2.1 Treatment and Insulin Regimen at year-end annual census of
T2DM patients, DiCARE 2006-2008...37 Table 3.3.3.1 Self-care practices of T2DM patients at year-end annual census, DiCARE 2006-2008...38 Table 3.3.3.2 Frequency of SMBG for T2DM patients at year-end census,
DiCARE 2006-2008...39 Table 3.3.4.1 Attendance for multi-disciplinary management in the last 12
months, DiCARE 2006-2008...40 Table 3.3.4.2 Number of visits to multi-disciplinary team in the last 12 months, DiCARE 2006-2008...40 Table 3.4.1.1 Outcome of T2DM patients by 31st December 2008, DiCARE
2006-2008...41 Table 3.4.2.1 Frequency of hospitalisation due to diabetes related condition of T2DM patients in the past 12 months, DiCARE 2006-2008...42 Table 3.4.2.2 Hospitalisation by diabetes-related complications for T2DM
X
Table 3.4.3.1 Chronic complications of T2DM patients in the past 12 months, DiCARE 2006-2008...43 Table 3.4.3.2 Complications by age group of T2DM patients in the past 12
months, DiCARE 2006-2008...44 Table 3.4.3.3 Duration of diabetes in relation to chronic complications of T2DM patients, DiCARE 2006-2008...44 Table 3.4.4.1 Glycaemic control by age group of T2DM patients in the past 12 months, DiCARE 2006-2008...45 Table 3.4.4.2 Glycaemic control of T2DM patients in the past 12 months,
DiCARE 2006-2008...45 Table 3.4.4.3 Frequency of HbA1c measurement of T2DM patients in the past 12 months, DiCARE 2006-2008...46 Table 3.4.5.1 Comorbidities of T2DM patients in the past 12 months, DiCARE 2006-2008)...47 Table 3.4.6.1 Distribution of reclassification of diagnosis for T2DM patients in the past 12 months, DiCARE 2006-2008...48
Table 4.1.1 Other types of Diabetes Mellitus, DiCARE 2006-2008...........49
XI
LIST OF FIGURES
Figure A: Distribution of patients with diabetes mellitus by source data providers (SDPs), Malaysia 2006-2008...VIII
Figure 2.1.1.1 Number of T1DM patients by age group at diagnosis, DiCARE
2006-2008...11 Figure 2.2.1.2 Symptoms of non-DKA patients at diagnosis of T1DM, DiCARE
2006-2008...14 Figure 2.2.2.1: Anthropometry at diagnosis of T1DM, DiCARE 2006-2008………...15 Figure 3.1.1.1 Age groups of T2DM patients, DiCARE 2006-2008...31 Figure 3.2.1.2 Symptoms of non-DKA patients at diagnosis of T2DM, DiCARE
1
INTRODUCTION
The incidence of T1DM is increasing in many countries and accounts for more than 90% of childhood and adolescent diabetes (under 15 years old) in most western countries. Studies have shown that the incidence is increasing more steeply in some central and eastern European countries where the disease is less common. In some European reports, the increase is greatest in children less than 5 years old. There are wide variations in the incidence rates of different countries, within countries and between different ethnic populations.1,2
The overall annual increase is estimated to be around 3%.2 In 2011, the International Diabetes Federation (IDF) estimated that worldwide, the total child population (0-14 years) with T1DM is estimated at 1.9 billion. There were 490,100 children aged 0 – 14 years with T1DM and 77,800 cases are newly diagnosed each year (2). Mean annual incidence rates for childhood T1DM (0 – 14 year age group) in different countries of the world are 0.1 to 57.6 per 100,000 (1). In Asia, the incidence of T1DM is extremely low: China 0.1 per 100,000 3, and Japan 2.4 per 100,000. 4
Type 2 diabetes mellitus (T2DM), once considered an illness of older adults is increasingly affecting more children and adolescents in some countries.2 It is becoming an increasingly important global public health issue. Many children with T2DM have the risk of developing complications in early adulthood, which would place a significant burden on the family and society.2,5 Sedentary lifestyles, obesity and insulin resistance contribute to an explosive increase in the incidence. It now accounts for 8-45% of new cases of childhood diabetes in urban diabetes centres.6 T2DM occurs in youth most often during the second decade of life, with a mean age of diagnosis of ∼13.5 years which coincides with the peak of physiologic pubertal insulin resistance.5 It affects mainly obese children of all races but at a much greater prevalence in those of non-white European descent such as African, native North American, Hispanic, Asian, South Asian (Indian Peninsula) and Native Pacific Islanders.5 In Hong Kong
>90% of young onset diabetes is T2DM 7, 50% in Taiwan 8 and nearly 60% in Japan.5
2
EXECUTIVE SUMMARY
2
ndDiCARE TECHNICAL REPORT
In Malaysia we have some modest data on diabetes mellitus (DM) in children and adolescents since the initiation of DiCARE in August 2006. The first report was published in 2007 whereby 240 patients were notified.
Currently, there are 34 sites that have registered and still actively reporting to the registry. There were altogether 408 patients registered with DiCARE from 2006-2008. The age of these patients ranged from 2 weeks to 20 years. The median age at diagnosis was 12.0 IQR (9.0, 15.0) years. The majority of patients were 10 years and older with female preponderance. There were 41.9% Malay, 35.0% Chinese, 18.6% Indian and 4.4% others.
Type 1 diabetes mellitus (T1DM) is seen in 71.8% of patient reported to DiCARE. The median age of diagnosis was 7.6 IQR (4.6,10.8) years with diabetes duration of 3.3 years. Chinese, Malays and Indians made up 39.6% (116/293), 35.8% (105/293) and 19.8% (58/293) of the T1DM patients respectively. Majority (42.3%) of the T1DM patients were between 10 to <15 years old and 57.5% presented with diabetic ketoacidosis (DKA). Positive family history (including T1DM and T2DM) was reported in 50.2% of patients. Of the T1DM patients with BMI reported, 11.8% were overweight. Over the years, there was a trend towards multiple dose insulin injections.
Only 42.3%, year-end census reports were obtained and analysed with regards to self-care practices of the T1DM patients. Self-monitoring blood glucose (SMBG) was practiced in 88.7% and ketone testing was practiced in only 5.7% during sick days or hyperglycaemia. Only 11.3% carry the medic alert and almost all did not keep glucagon at home. A substantial proportion of T1DM patients reported that they had consultation with the dietician (41.1%), diabetes nurse educator (30.7%), ophthalmologist (55.7%) and psychologist (4.0%) in the past 12 months. Approximately 11.0% reported having participated in diabetes camp in the past 12 months.
The most commonly reported complication was microalbuminuria in 7.3% patients, followed by nephropathy (3.2%), retinopathy (2.4%) and neuropathy (0.8%) Chronic complications were seen in children older than 10 years. The mean HbA1c was 10.8% which reflected poor metabolic control. Good metabolic control (HbA1c <7.5%) was only seen in 25.0% of the patients while more than half (54.2%) had poor metabolic control with HbA1c >10.0%. Children aged less than 5 years appeared to have better metabolic control, with mean HbA1c 7.2% in contrast to the adolescents with mean HbA1c of 11.3%.
3
T2DM patients were between 10 to <15 years old at diagnosis with female predominance.
Malays, Chinese and Indians constituted 63.9%, 19.4% and 13.9% of the T2DM patients respectively. Of the 72 T2DM patients, 83.3% had positive family history of diabetes mellitus among first-degree relatives. Majority of the patients were symptomatic, of whom 9.6% had DKA. Of those patients without DKA, 85.3% experienced polyuria/polydipsia, 35.3% had weight loss, 11.8% had pruritis vulvae and 5.9% had abscess/acute infections. Majority (63.9%) of the patients were overweight. Acanthosis nigricans is a characteristic feature of T2DM, but was only reported in 31.9% of the patients.
Based on the annual census at the end of 2008, 58% were on oral hypoglycaemic agent (OHA) only, 17.2 % on insulin only and another 17.2% were on a combination of insulin and OHA. Self-monitoring blood glucose (SMBG) was practiced in 51.6% and the vast majority (87.1%) did not perform ketone testing on sick days. Only 9.7% reported carrying medic alert and none of the patients keep glucagon at home.
For T2DM patients it was reported that they had consultation with the dietician (51.6%), diabetes nurse educator (32.3%), ophthalmologist (48.4%) and psychologist (3.2%) in the past 12 months. Approximately 11.0% T1DM patients reported having participated in diabetes camp in the past 12 months. Good metabolic control (HbA1c <7.5%) was only seen in 15.4% of the patients while more than half (53.8%) had poor metabolic control with HbA1c >10.0%. Co-morbidities reported were hypertension in 16.1%, dyslipidaemia in 16.1% and obesity in 45.2%.
There were 7.1% (29/408) patients who were registered under other types of diabetes mellitus. Genetic defects are the commonest (34.5%), followed by diseases of the endocrine glands (20.7%) and genetic syndrome (13.8%).
From the Second Technical DiCARE Report, it is observed that the target of ideal HbA1c level of 7.5% was not achieved in the majority of patients. More work need to be done to achive this target.
Dr. Fuziah Md. Zain
On behalf of the DiCARE Study Group
Consultant Paediatrician and Paediatric Endocrinologist Paediatric Department
4
CHAPTER 1
SOCIO-DEMOGRAPHIC PROFILE
Dr Jamaiyah Haniff
5
1.1 Socio-demographic profiles
1.1.1 Patient characteristics
There were 408 patients registered with DiCARE from 2006-2008. The age of these patients ranged from 2 weeks to 20 years. The median age at diagnosis was 12.0 (IQR 9.0, 15.0) years. The majority 73.8% (301/408) of the patients was 10 years and older.
6
Table 1.1.1.1 Summary of patient characteristics for patients with diabetes mellitus, DiCARE 2006-2008 (N=408)
Scottish-Chinese, Sikh, Punjabi, Pakistan, Ubian, Thai and Singh, Bumiputra Sabah, Bumiputra Sarawak, Non- Malaysian
c
7
CHAPTER 2
TYPE 1 DIABETES MELLITUS
Dr Fuziah Md Zain
Dr Janet Hong Yeow Hua
Professor Dr Wu Loo Ling
Associate Professor Dr Muhammad
Yazid Jalaludin
8
2.1Socio-demographic profiles of T1DM
2.1.1 Patient characteristics
Of the total 408 diabetic patients notified in 2006 - 2008, 74.4% (293/394 – due to 14 missing) were having T1DM. The median age of diagnosis was 7.6 (IQR 4.6, 10.8) years, with diabetes duration of 3.3 (IQR 1.4, 7.0) years. Majority 42.3% (124/293) of the T1DM patients were between 10 and <15 years old (Figure 2.1.1.1). Females 53.6% (157/293) slightly outnumbered males.
9
Figure 2.1.1.1 Number of T1DM patients by age group at diagnosis, DiCARE 2006-2008
2.1.2 Ethnic Distribution
Chinese, Malays and Indians made up 39.6% (116/293), 35.8% (105/293) and 19.8% (58/293) of the T1DM patients respectively.
2.1.3 Family History
10
Table 2.1.3.1 Family history for patients with T1DM, DiCARE 2006-2008 (N=293).
Yes No Unknown/Missing n (%) n (%) n
Family history 147 (53.1) 130 (46.9) 16 of diabetes
Table 2.1.3.2 Details of family history of diabetes for T1DM patients, DiCARE 2006-2008 (N=46)
Family History n (%)
One parent only 34 (73.9)
Both parents 7 (15.2)
One sibling only 5 (10.9)
More than one sibling - Parent(s) and sibling(s) - Footnote : 101 missing value from N : 147 “yes” family history.
2.2 Clinical characteristics at presentation
2.2.1 Clinical presentation and biochemical characteristics at diagnosis of
T1DM
11
Table 2.2.1.1 Presentation at diagnosis of T1DM, DiCARE 2006-2008 (N=293)
Presentation at diagnosis Cumulative n (%)
Clinical
Asymptomatic 3 (1.1)
Symptomatic 275 (98.9)
Missing 15
Biochemical
C-peptide 27 (9.2)
Insulin -
Insulin auto-antibodies 8 (2.7)
As for biochemical characteristics at the time of diagnosis, only 2.7% had insulin auto-antibodies measured and 9.2% had C-peptide level tested. This may reflect the unavailability of these tests in most centres.
Table 2.2.1.2 Symptomatic presentation at diagnosis of T1DM, DiCARE 2006-2008 (N=275)
Symptomatic Non DKA DKA Missing
n (%) n (%) n
No of patients (%) 113 (41.7) 158 (58.3) 4
12
Table 2.2.1.3 Symptoms of non-DKA patients at diagnosis, DiCARE 2006-2008 (N=113)
Figure 2.2.1.2 Symptoms of non-DKA patients at diagnosis of T1DM, DiCARE 2006-2008
Polyuria/polydipsia Weight loss Pruritis vulvae Abscess/acute
13
2.2.2 Anthropometry and clinical signs at diagnosis of T1DM
Of all T1DM patients, 98.6% (289/293) had their BMI reported, of whom 29.8% (86/289) were underweight, 58.5% (169/289) were of normal weight and 11.8% overweight (34/289) (Figure 2.2.2.1).
Figure 2.2.2.1: Anthropometry at diagnosis of T1DM, DiCARE 2006-2008
2.3 Management of T1DM
2.3.1 Treatment at diagnosis
All T1DM patients must receive insulin treatment. However, one T1DM patient received no treatment and another received only oral hypoglycaemic agent (OHA) at diagnosis in 2006. This is most probably due to misclassification of the type of diabetes. Subsequently all T1DM were reported to be on insulin (Table 2.3.1.1).
29.8%
58.5% 11.8%
14
Intensification of insulin therapy is the treatment strategy to reduce HbA1c to target, to prevent long-term complications. However 75.0% (3/4) and 87.0% (20/23) of T1DM patients were reported to be receiving once-a-day insulin in 2006 and 2007 respectively. These figures were likely to be inaccurate and do not represent the current practice in Malaysia. However, there was a trend towards multiple dose insulin injections. In 2008, none of the T1DM patients were on once a day insulin regimen. In contrast, 64.4% (38/59) patients were on twice a day insulin regimen and 33.9% (20/59) patients were on three or more times a day insulin regimen.
15
2.3.2 Treatment at year-end annual census
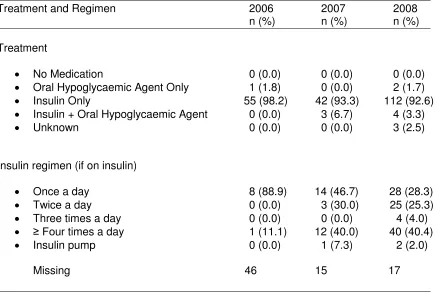
Feedback for year-end annual census had been very poor. There were only 56 and 45 responses regarding treatment at year-end of 2006 and 2007 respectively. Cumulatively at year-end of 2008, 41.3% (121/293) of T1DM patients in the registry had their annual census reports submitted. Of these, there were only 121 responses regarding treatment, i.e. 92.6% (112/121) patients received only insulin, 3.3% (4/121) received a combination of insulin and OHA, 2.5% (3/121) had unknown treatment and surprisingly, 1.7% (2/121) received OHA alone (Table 2.3.2.1).
Table 2.3.2.1 Treatment and Insulin Regimen at year-end annual census of T1DM patients, DiCARE 2006-2008 (N =121)
16
Among the patients who received insulin treatment, 16.4% (9/55), 66.7% (30/45) and 85.3% (99/116) indicated their insulin regimen in years 2006, 2007 and 2008 respectively. In the latest year-end census 2008, 28.3% (28/99) of T1DM patients were on once a day insulin regimen and 25.3% (25/99) were on twice-a-day
regimen. Only 46.5% (46/99) of the T1DM patients were on ≥ three times a day
insulin regimen or on insulin pump (Table 2.3.2.1). It is alarming to note that once-a-day insulin regimen for T1DM is still being practised in the country.
2.3.3 Self-care practice
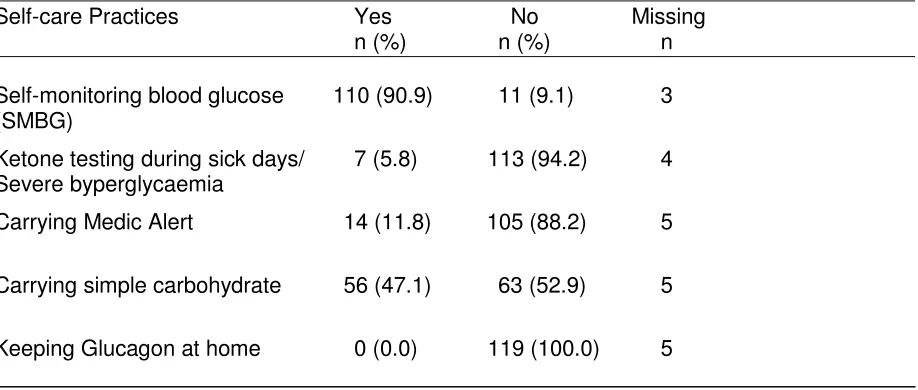
Among all the 293 T1DM patients in the registry, only 42.3% (124/293) year-end census reports were obtained. Analysis was made on these 124 patients with regards to their self-care practices such as self-monitoring blood glucose (SMBG), ketone testing, carrying medic alert, carrying simple carbohydrate and keeping glucagon at home (Table 2.3.3.1).
i. SMBG was practiced in 90.9% (110/121 – due to 3 missing) of the T1DM patients as a way of self-management of their diabetes. However, it was not so in 9.1% (11/121 – due to 3 missing) of patients.
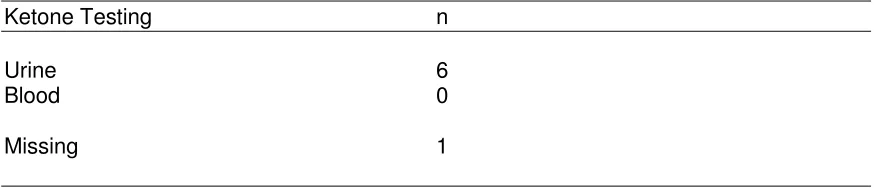
ii. Ketone testing: Surprisingly the majority of the T1DM patients did not practice ketone testing during sick days and/or during severe hyperglycaemia. Only 5.8% (7/120 – due to 4 missing) of the T1DM patients practiced ketone testing during these occasions. Of these T1DM patients who practiced ketone testing, 85.7% (6/7) of them tested urine for ketone and 14.3% (1/7) tested blood for ketone.
iii. Carrying medic alert: The majority, i.e 88.2% (105/119 – due to 5 missing) of T1DM patients reported not carrying any form of medic alert. However, 11.8% (14/119) of patients carried medic alert.
17
emergency use in the events of severe hypoglycaemia. None of the T1DM patients reported keeping glucagon at home, however 5 patients did not indicate any response.
Table 2.3.3.1 Self-care practices of T1DM patients at year-end annual census, DiCARE 2006-2008 (N=124)
Self-care Practices Yes No Missing
n (%) n (%) n
Self-monitoring blood glucose 110 (90.9) 11 (9.1) 3 (SMBG)
Ketone testing during sick days/ 7 (5.8) 113 (94.2) 4 Severe byperglycaemia
Carrying Medic Alert 14 (11.8) 105 (88.2) 5
Carrying simple carbohydrate 56 (47.1) 63 (52.9) 5
18
Among those who did SMBG as a means of self-care practice, the mean (SD) frequency of tests was 10.6 (8.5) times per week and median of 7 times per week.
This is much below the optimal frequency of ≥ 28 times per week, i.e ≥ 4 times per
day. There was a wide variation in frequency of SMBG ranging from one to 28 times per week (Table 2.3.3.2). This is most probably due to high cost and lack of subsidy for glucose strips from the hospital or government agencies.
Among those who reported testing for ketones during sick days/severe hyperglycaemia, the majority T1DM patients preferred urine test to blood test (Table 2.3.3.3). Although the number of patients was small for comparison, cost
was undoubtedly an important factor influencing patients’ choice as the cost of
blood ketone test is five times more than urine ketone test.
Table 2.3.3.2 Frequency of SMBG for T1DM patients at year-end census, DiCARE 2006-2008 (N=110)
Self-care monitoring Mean (SD) Median Min, Max
SMBG testing 10.6 (8.5) 7 (11) 1, 28
(No of times/week)
Table 2.3.3.3 Ketone testing on sick days / severe hyperglycaemia (N=7)
Ketone Testing n
Urine 6
Blood 0
19
2.3.4 Attendance for multidisciplinary management
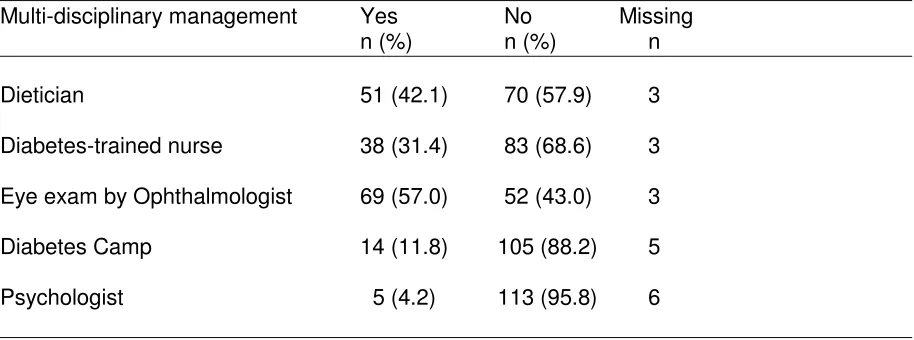
Out of a total of 293 T1DM patients, data was available in 124 patients (Table 2.3.4.1). A substantial proportion of T1DM patients reported that they had consultation with the dietician, i.e 42.1% (51/121 – due to 3 missing), diabetes nurse educator 31.4% (38/121 – due to 3 missing), ophthalmologist 57.0 % (69/121 – due to 3 missing) and psychologist 4.2% (5/118 – due to 6 missing) in the past 12 months. Approximately 11.8% (14/119) T1DM patients reported having participated in diabetes camp in the past 12 months. Many centres in Malaysia are still lacking in healthcare professionals for multi-disciplinary care of T1DM patients.
Table 2.3.4.1 Attendance for multi-disciplinary management in the last 12 months, DiCARE 2006-2008 (N=124)
Multi-disciplinary management Yes No Missing
n (%) n (%) n
Dietician 51 (42.1) 70 (57.9) 3
Diabetes-trained nurse 38 (31.4) 83 (68.6) 3
Eye exam by Ophthalmologist 69 (57.0) 52 (43.0) 3
Diabetes Camp 14 (11.8) 105 (88.2) 5
Psychologist 5 (4.2) 113 (95.8) 6
20
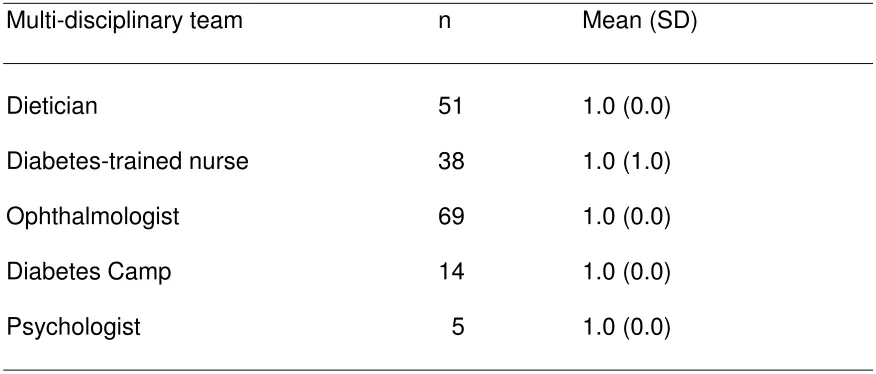
Table 2.3.4.2 Number of patients seen by multi-disciplinary team in the last
12 months, DiCARE 2006-2008
Multi-disciplinary team n Mean (SD)
Dietician 51 1.0 (0.0)
Diabetes-trained nurse 38 1.0 (1.0)
Ophthalmologist 69 1.0 (0.0)
Diabetes Camp 14 1.0 (0.0)
21
2.4 Outcomes of T1DM
This section describes the outcomes/follow-up status of all T1DM patients for the year-ending 2008.
2.4.1 Follow-up status
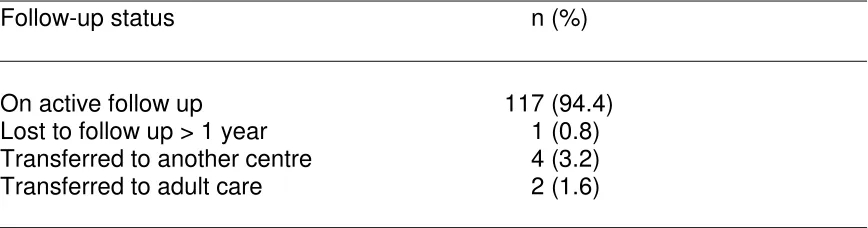
Of the 293 patients in the entire registry for 2006-2008, 124 reports of the annual census for the year-ending 2008 were received. Thus, the information on outcomes was available in 42.3% (124/293) of the total registered T1DM patients. Of this population with known outcomes, there was no reported death and 94.4% (117/124) were still on active follow-up, 3.2% (4/123) of whom were transferred to another centre and another 1.6% (2/123) was transferred to adult care. Only 0.8% (1/124) was lost to follow-up for more than one year (Table 2.4.1.1).
The high proportion of unknown outcome 57.7% (169/293) was likely to be due to failure to report year-end annual census. Due to this inadequate information, the following results may not be the true reflection of actual outcomes.
Table 2.4.1.1 Outcome of T1DM patients by 31st December 2008, DiCARE
2006-2008 (N=124)
Follow-up status n (%)
22
2.4.2 Hospitalisation
Hospitalisation status for 42.3% (124/293) of patients was identified. Ouf of 124, 121 patients reported the status of hospitalization. There were 19.8% (24/121) required hospitalisation for diabetes-related complications. Out of the 24 patients who were hospitalised, complete data were only available in 22 patients. Most of the admissions were due to DKA 54.5% (12/22). Other hospitalisations were for stabilisation of diabetes 36.4%, (8/22) and severe hypoglycaemia 9.1%, (2/22) (Table 2.4.2.1 and 2.4.2.2).
Table 2.4.2.1 Frequency of hospitalisation due to diabetes related condition
of T1DM patients in the past 12 months, DiCARE 2006-2008 (N=124)
Hospitalisation n (%)
Known 121 (97.6)
Yes 24 (19.8)
No 97 (80.2)
Unknown 3 (2.4)
Table 2.4.2.2 Hospitalisation by diabetes-related complications for T1DM patients in the past 12 months, DiCARE 2008 (N=24)
Hospitalisation / Causes (n=22) n (%)
DKA 12 (54.5)
Stabilisation of diabetes 8 (36.4)
Severe hypoglycaemia 2 (9.1)
Foot note; 2 missing value from N : 24 who said ‘yes’ to hospitalisation
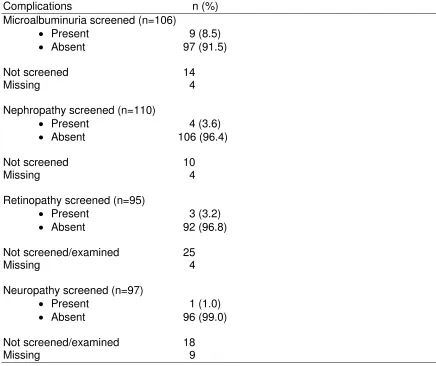
2.4.3 Chronic complications of T1DM
23
(3/95) and neuropathy in 1.0% (1/97) patients. Between 12% and 23% of patients were not screened for chronic complications. This could either be due to lack of awareness on the expected standard of care by the attending doctor or
Table 2.4.3.1 Chronic complications of T1DM patients in the past 12
months, DiCARE 2006-2008 (N=124)
Complications n (%)
When stratified by age, 10 -< 15 and 15 -<20 years, microvascular complications were seen in both age groups. (Table 2.4.3.2).
Table 2.4.3.2 Complications by age group of T1DM patients in the past 12 months, DiCARE 2006-2008
24
One of the earliest chronic complications in T1DM is microalbuminuria, which was reported to occur at a median of 6.2 yearsafter diagnosis (Table 2.4.3.3).
Table 2.4.3.3 Duration of diabetes in relation to chronic complications of T1DM patients, DiCARE 2006-2008
Only* refer to only one complication At least#
refer toat least one complication
2.4.4 Glycaemic control
25
Table 2.4.4.1 Glycaemic control by age group of T1DM patients in the past 12 months, DiCARE 2006-2008 (N=48)
Profiles HbA1C
n Mean (SD) Median (IQR 1st - 3rd) Min, max
Overall 48 10.8 (3.5) 11.4 (IQR 7.5 - 13.5) 5.4, 19.7
Age group
< 5 years 3 7.2 (1.0) 6.6 (IQR 6.6 - 7.5) 6.6, 8.4
5 - < 10 years 10 10.7 (3.3) 11.5 (IQR 7.2 - 13.3) 5.4, 15.1
10 - < 15 years 22 11.1 (3.6) 10.8 (IQR 8.2 - 13.9) 6.3, 19.7
15 - < 20 years 13 11.3 (3.5) 12.1 (IQR 7.8 - 14.3) 5.8, 17.1
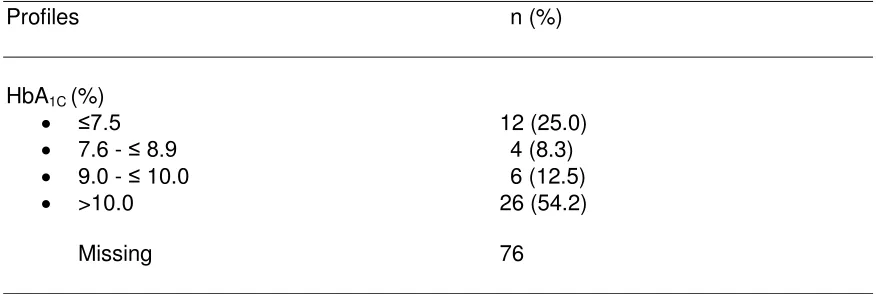
Good metabolic control (HbA1c <7.5%) was only seen in 25.0% (12/48) of the patients while more than half 54.2% (26/48) had poor metabolic control with HbA1c >10.0%.
Table 2.4.4.2 Glycaemic control of T1DM patients in the past 12 months, DiCARE 2006-2008 (N=48)
Profiles n (%)
HbA1C (%)
≤7.5 12 (25.0)
7.6 - ≤ 8.9 4 (8.3)
9.0 - ≤ 10.0 6 (12.5)
>10.0 26 (54.2)
Missing 76
26
Table 2.4.4.3 Frequency of HbA1c measurement of T1DM patients in the
past 12 months, DiCARE 2006-2008(N=124)
Lab result n (%)
HbA1C
Done (n=114)
Frequency of test (n=103) (Past 12 months)
1 10 (9.7)
2 15 (14.6)
3 39 (37.9)
4 39 (37.9)
Missing 11
Not done (n=7)
2.4.5 Comorbidities of T1DM
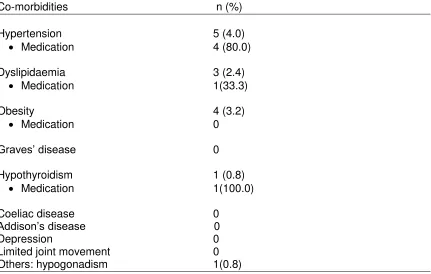
Report on comorbidities was available on 124 patients of whom 4.0% (5/124) had hypertension, 2.4% (3/124) had dyslipidaemia and 3.2% (4/124) were obese. Not every patient was on medication for hypertension, dyslipidaemia and obesity (table 2.4.5.1).
There was one patient with hypothyroidism and another one had hypogonadism. There was no patient who had other associated autoimmune diseases, i.e.
Graves’ disease, coeliac disease or Addison’s disease. No patient was reported
27
Table 2.4.5.1 Comorbidities of T1DM patients in the past 12 months, DiCARE 2006-2008 (N=124)
Co-morbidities n (%)
Hypertension 5 (4.0)
Medication 4 (80.0)
Dyslipidaemia 3 (2.4)
Medication 1(33.3)
Obesity 4 (3.2)
Medication 0
Graves’ disease 0
Hypothyroidism 1 (0.8)
Medication 1(100.0)
Coeliac disease 0
Addison’s disease 0 Depression 0 Limited joint movement 0 Others: hypogonadism 1(0.8)
2.4.6 Reclassification of Diagnosis
28
Table 2.4.6.1 Distribution of reclassification of diagnosis for T1DM patients in the past 12 months, DiCARE 2006-2008 (N=124)
Status n (%)
Reclassified 3 (2.4)
From type 1 to type 2 2 (1.4)
29
CHAPTER 3
TYPE 2 DIABETES MELLITUS
Dr Fuziah Md Zain
Dr Janet Hong Yeow Hua
Associate Professor Dr Rahmah Rasat
Associate Professor Dr Muhammad
Yazid Jalaludin
30
3.1Socio-demographic profiles of T2DM
3.1.1 Patient characteristics
Of the 408 diabetic patients reported from 2006 to 2008, 17.6% (72/408) were having T2DM. The median age of diagnosis was 11.0 (IQR 9.8, 12.2) years, with median diabetes duration of 2.2 (IQR 0.9, 4.0) years. Majority 61.1% (44/72) of the T2DM patients were between 10 to <15 years old at diagnosis (Figure 3.1.1). Females 54.2% (39/72) slightly outnumbered males.
31
Figure 3.1.1.1 Age groups of T2DM patients, DiCARE 2006-2008
3.1.2 Family History
Of the 72 T2DM patients, 83.3% (60/72- due to 3 missing) had positive family history of diabetes mellitus among first-degree relatives (Table 3.1.2.1). Of these patients with positive family history, only 80.0% (48/60) had the details reported, of which 62.5% (30/48) had diabetes in one parent, 2.0% (1/48) in both parents, 12.5% (6/48) in one sibling and 22.9% (11/48) in more than one sibling (Table 3.1.3.1 and Figure 3.1.3.2).
Table 3.1.2.1 Family history of diabetes for T2DM patients, DiCARE
2006-2008 (N=72)
Yes No Unknown /Missing n (%) n (%) n
32
Table 3.1.2.2 Details of family history of diabetes for T2DM patients, DiCARE 2006-2008 (N=48)
Family History n (%)
One parent only 30 (50.0)
Both parents 1 (1.7)
One sibling only 6 (10.0)
More than one sibling 11 (18.3) Parent(s) and sibling(s) -
Footnote : Missing 12
3.2 Clinical characteristics and anthropometrics of T2DM at presentation
3.2.1 Clinical presentation and biochemical characteristics at diagnosis of
T2DM
Basis of diagnosis is known in 90.3% (65/72) of patients with T2DM. Of the 65 patients, 80.0% (52/65) were symptomatic, of whom 9.6% (5/52) had diabetic ketoacidosis (DKA).
33
Table 3.2.1.1 Presentation at diagnosis of T2DM, DiCARE 2006-2008 (N=72)
Presentations at diagnosis n (%)
Table 3.2.1.2 Symptomatic presentation at diagnosis of T2DM, DiCARE 2006-2008 (N=52)
Symptoms Non DKA DKA Missing
n (%) n (%) n
No of patients (%) 34 (87.2) 5 (12.8) 13
Of 34 patients without DKA, 85.3% (29/34) experienced polyuria/polydipsia, 35.3% (12/34) had weight loss, 11.8% (4/34) had pruritis vulvae and 5.9% (2/34) had abscess/acute infections.
34
Figure 3.2.1.2 Symptoms of non-DKA patients at diagnosis of T2DM,
DiCARE 2006-2008
3.2.2 Anthropometry and clinical signs at diagnosis of T2DM
Of all T2DM patients, 20.8% (15/72) were underweight, 15.3% (11/72) normal weight and 63.9% (46/72) overweight. Acanthosis nigricans, a characteristic feature of insulin resistance was only reported in 31.9% (23/72) of the patients.
29
35
20.8%
15.3% 63.9%
Underweight
Normal
Overweight
Figure 3.2.2.1: Anthropometry at diagnosis of T2DM, DiCARE 2006-2008
Table 3.2.2.1 Anthropometry and clinical signs at diagnosis of T2DM, DiCARE 2006-2008 (N=72)
Anthropometric/Clinical n (%)
Examination
Anthropometry based on BMI
Underweight 15 (20.8)
Normal 11 (15.3)
Overweight/obesity 46 (63.9)
Acanthosis nigricans
Present 23 (31.9)
Absent 49 (68.1)
3.3 Management of T2DM
3.3.1 Treatment at diagnosis
In 2006, there were significant under-reporting of treatment as 34.7% (25/72) of
information was missing. Of the 13 cases reported in 2007, 9 were on oral
36
and OHA. While in 2008, out of a total of 27 cases of T2DM, 66.7% (18/27)
required OHA, 29.6% (8/27) on insulin only and 3.7% (1/27) on life-style
modification with no medications instituted. As expected the mode of therapy of
T2DM in 2007 and 2008 were predominantly OHA. A relatively high percentage
of the newly diagnosed T2DM patients were on insulin only. This may be due to
a decompensated state at diagnosis which warranted the use of insulin.
Table 3.3.1.1 Treatment and Insulin Regimen at diagnosis of T2DM patients, DiCARE 2006-2008 (N=72)
Treatment and Regimen 2006 2007 2008
n (%) n (%) n (%)
Treatment
No Medication 0 0 1 (3.7)
Oral Hypoglycaemic Agent Only 4 (57.1) 9 (69.2) 18 (66.7)
Insulin Only 3 (42.9) 1 (7.7) 8 (29.6)
Insulin + Oral Hypoglycaemic Agent 0 3 (23.1) 0
Missing 25 0 0
Insulin regimen (if on insulin)
Once a day 0 2 (100.0) 0
Twice a day 0 0 3 (60.0)
Three times a day 0 0 2 (40.0)
≥ Four times a day 0 0 0
Insulin pump 0 0 0
37
3.3.2 Treatment at year-end census
There were only 17 and 8 responses regarding treatment at year end of 2006 and 2007 respectively. At year end of 2008, 40.3% (29/72) T2DM patients in the registry had their annual census report submitted. Based on the annual census at the end of 2008, 58.6% (17/29) of patients were on OHA, 17.2 % (5/29) requiring additional insulin and 17.2% (5/29) a combination of insulin and OHA. It is of interest to note that up to 34.4% (10/29) of the total T2DM patients in 2008 required insulin, either alone or in combination with OHA.
Table 3.3.2.1 Treatment and Insulin Regimen at year-end annual census of T2DM patients, DiCARE 2006-2008
Treatment and Regimen 2006 2007 2008
n (%) n (%) n (%)
Treatment
No Medication 2 (11.8) 0 1 (3.5)
Oral Hypoglycaemic Agent Only 10 (58.8) 7 (87.5) 17 (58.6)
Insulin Only 1 (5.9) 1 (12.5) 5 (17.2)
Insulin + Oral Hypoglycaemic Agent 4 (23.5) 0 5 (17.2)
Unknown 0 0 1 (3.5)
Insulin regimen (if on insulin)
Once a day 1 (20.0) 1 (100.0) 5 (50.0)
Twice a day 0 0 2 (20.0)
Three times a day 0 0 0 (0.0)
≥ Four times a day 0 0 1(10.0)
Insulin pump 0 0 0
38
3.3.3 Self-care practice
At the year–end census, 43.1% (31/72) were available for analyses of self-care practice.
i. Self-monitoring blood glucose: Only 55.2% (16/29 – due to 2 missing) practiced self-monitoring of blood glucose while the remaining 41.9% (13/31) did not.
ii. Ketone testing: The vast majority 96.4% (27/28 – due to 3 missing) did not perform ketone testing on sick days.
iii. Carrying medic alert: 10.7% (3/28 – due to 3 missing) reported carrying medic alert while the majority 89.3% (25/28 – due to 3 missing) did not do so. iv. Keeping glucagon at home: None of the patients keep glucagon at home;
presumably this is not a common practice for T2DM.
Table 3.3.3.1 Self-care practices of T2DM patients at year-end annual census, DiCARE 2006-2008 (N=31)
Self-care Practices Yes No Missing
n (%) n (%) n
Self-monitoring blood glucose 16 (55.2) 13 (44.8) 2 (SMBG)
Ketone testing 1 (3.6) 27 (96.4) 3
Carrying Medic Alert 3 (10.7) 25 (89.3) 3
Carrying simple carbohydrate 8 (28.6) 20 (71.4) 3
39
Among those who did SMBG, it was done at a mean (SD) frequency of 4.4 (3.7) times per week and a median of 3.5 with a wide range of frequency from one to 14 times per week (Table 3.3.3.2).
It is of great concern that a significant number of T2DM 44.8% (13/29 – due to 2 missing) did not perform SMBG. In stable patients it is recommended that SMBG be performed at least 4 times a week for fasting level and once daily post-prandial testing preferably following the largest meal for the day.
Table 3.3.3.2 Frequency of SMBG for T2DM patients at year-end census, DiCARE 2006-2008
Self-care monitoring Mean (SD) Median Min, Max
n=16
SMBG testing 4.4 (3.7) 3.5 1, 14
(No of times/week)
3.3.4 Attendance for multidisciplinary management
Of the 31 patients reported at year-end census, 55.2% (16/29 – due to 2 missing) consulted a dietician; 34.5% (10/29 – due to 2 missing) were seen by a diabetic trained nurse; 51.7% (15/29 – due to 2 missng) had an eye examination by ophthalmologist and 3.4% (1/29 – due to 2 missing) was counselled by a psychologist and 3.4% (1/29 – due to 2 missing) attended diabetes camp.
40
Table 3.3.4.1 Attendance for multi-disciplinary management in the last 12 months, DiCARE 2006-2008 (N=31)
Multi-disciplinary management Yes No Missing
n (%) n (%) n
Dietitian 16 (55.2) 13 (44.8) 2
Diabetes-trained nurse 10 (34.5) 19 (65.5) 2
Eye exam by Ophthalmologist 15 (51.7) 14 (48.3) 2
Diabetes Camp 1 (3.4) 28 (96.6) 2
Psychologist 1 (3.4) 28 (96.6) 2
Table 3.3.4.2 Number of patients seen by multi-disciplinary team in the last
12 months, DiCARE 2006-2008
Multi-disciplinary team N Mean (SD)
Dietician 16 1.0 (0.5)
Diabetes-trained nurse 10 1.0 (1.5)
Ophthalmologist 15 1.0 (0.0)
Diabetes Camp 1 1.0 (0.0)
Psychologist 1 1.0 (0.0)
41
3.4 Outcomes of T2DM
This section describes the outcomes of all T2DM patients for the year-ending 2008.
3.4.1 Follow-up status
Of the 72 patients in the entire registry for 2006-2008, 31 reports of the annual census for the year-ending 2008 were received. Thus, the information on outcomes was available in 43.1% (31/72) of the total registered T2DM patients. Of this population with known outcomes, there was no reported death and 87.1% (27/31) were still on active follow-up, of whom 3.2% (1/31) was transferred to another centre. There were 9.7% (3/31) patients who were lost to follow-up for more than one year (Table 3.4.1.1 and Figure 3.4.1.1).
The high proportion of unknown outcome 56.9% (41/72) was due to failure to report follow-up data. Due to this inadequate information, the following results may not be a true reflection of actual outcomes.
Table 3.4.1.1 Outcome of T2DM patients by 31st December 2008, DiCARE
2006-2008 (N=31)
Follow-up status n (%)
On active follow up 27 (87.1)
Lost to follow up > 1 year 3 (9.7)
Transferred to another centre 1 (3.2) Transferred to adult care 0
42
3.4.2 Hospitalisation
Hospitalisation status of 43.1% (31/72) patients was identified with follow-up data, of whom 13.8% (4/29 – due to 2 missing) required hospitalisation for diabetes-related complications. One patient was admitted for diabetic ketoacidosis (DKA) while 3 were admitted for stabilisation of diabetes. No patient was admitted for severe hypoglycaemia (Table 3.4.2.1 and Table 3.4.2.2).
Table 3.4.2.1 Frequency of hospitalisation due to diabetes related condition in T2DM in the past 12 months, DiCARE 2006-2008 (N=31)
Hospitalisation n (%)
Known
Yes 4 (13.8)
No 25 (86.2)
Unknown n=2
Table 3.4.2.2 Hospitalisation by diabetes-related complications for T2DM patients in the last 12 month, DiCARE 2006-2008 (N=4)
Hospitalization (n=4) n (%)
DKA 1 (25.0)
Stabilization of diabetes 3 (75.0) Severe hypoglycaemia 0
3.4.3 Chronic complications of T2DM
43
commonly reported complication was microalbuminuria in 19.2% (5/26) patients, followed by nephropathy with 7.1% (2/28) and retinopathy in 7.7% (2/26)
44
It is important to note that chronic complication can occur as early as 0.4 years after diagnosis.
Table 3.4.3.3 Duration of diabetes in relation to chronic complications of T2DM patients, DiCARE 2006-2008
Only* refer to only one complication At least# refer to at least one complication
3.4.4 Glycaemic control
45
of 6.1% and the highest 15.4%. All different age group of children had poor glycaemic control with mean HbA1c between 10.6% and 12.5%.
Table 3.4.4.1 Glycaemic control by age group of T2DM patients in the past 12 months, DiCARE 2006-2008 (N=13)
46
Table 3.4.4.3 Frequency of HbA1c measurement of T2DM patients in the
past 12 months, DiCARE 2006-2008 (N=31)
Lab result n (%)
HbA1C
Done (n=24)
Frequency of test (n=22)
1 3 (13.6)
2 9 (40.9)
3 7 (31.8)
4 3 (13.6)
Missing 2
Not done (n=5)
3.4.5 Comorbidities of T2DM
Report on comorbidities was available on 31 patients of whom 16.1% (5/31) had hypertension, 16.1% (5/31) had dyslipidaemia and 45.2% (14/31) were obese. All patients with hypertension were on medication but not every patient with dyslipidaemia was on medication. No patient was started on pharmacological treatment for obesity (table 3.4.5.1).
One patient had polycystic ovarian syndrome (PCOS) and another 1 had obstructive sleep apnoea (OSA) on CPAP. There was no patient who had other
associated autoimmune diseases i.e hypothyroidism, Grave’s disease, Coeliac disease or Addison’s disease. No patient was reported to have depression or
47
Of the 31 patients reported at year-end annual census, only 6.5% (2/31) patient were reclassified, 1 was reclassified as type 1 diabetes while the other 1 was reclassified as others.
Table 3.4.6.1 Distribution of reclassification of diagnosis for T2DM patients in the past 12 months, DiCARE 2006-2008 (N=2)
Status n (%)
Reclassified
From type 2 to type 1 1 (3.2%)
48
CHAPTER 4
OTHER TYPES OF DIABETES
49
4.1 Other Types of Diabetes
As of 31st December 2008, there were 293 T1DM and 72 T2DM patients in the registry. In addition, 9.9% (29/293) patients were registered under “Other types
of diabetes mellitus” (Table 4.1.1). In this group, genetic defects of ß-cell function 34.5% (10/29) are the commonest cause followed by diseases of the endocrine gland 20.7% (6/29) and genetic syndrome 13.8% (4/29).
Table 4.1.1Other types of Diabetes Mellitus, DiCARE 2006-2008 (N=29)
Causes of Diabetes Mellitus n (%)
Genetic defects of ß-cell function 10 (34.5)
Diseases of the endocrine gland 6 (20.7)
Drug or chemical-induced 2 (6.9)
Immune-mediated diabetes mellitus 2 (6.9)
Genetic syndrome (Down, Turner, Prader-Willi) 4 (13.8)
Unknown 2 (6.9)
50
RECOMMENDATION
The 1st Annual Report of DiCARE 2006-2007 has provided us with some insights into diabetes mellitus among the young in Malaysia. With increased number of patients reported, the 2nd Annual Report of DiCARE 2006-2008 provides more reliable information. DiCARE results may not reflect the national status at the moment as data collection was incomplete especially for the year end census.
We need to recruit more source data providers who will participate actively in this registry. technical DiCARE report, it is observed that the target HbA1c level of 7.5% was not achieved in the majority of patients. This is very likely due to lack of healthcare providers especially paediatric diabetes educators and paediatric psychologists for multidisciplinary care of children and adolescents with diabetes. In addition, the high cost of home blood glucose monitoring may contribute to poor glycaemic monitoring and control. Unless these problems are rectified, these children are likely to have persistent poor glycaemic control.
51
are still young, they will become knowledgeable adults who can reasonably handle their diabetes well and decrease long term morbidities.
52
REFERENCES
1) Definition, epidemiology and classification of diabetes in children and adolescents. Craig ME, Hattersley A, Donaghue KC. Pediatric Diabetes 2009: 10 (Suppl. 12): 3–12.
2) International Diabetes Federation (IDF) World Atlas of Diabetes, 2011, 5th edition, 2011.
3. 2006. Incidence and trends of childhood Type 1 diabetes worldwide 1990– 1999. Diabet Med 23: 857–866.
4. Type 1 diabetes in Japan. Kawasaki E, Matsuura N, Eguchi K. Diabetologia 2006: 49: 828–836.
5. Type 2 diabetes in the child and adolescent. Rosenbloom AL, Silverstein JH, Amemiya S, Zeitler P, Klingensmith, G. Pediatric Diabetes 2009: 10 (Suppl. 12): 17–32.
6. Characteristics of Adolescents and Youth with Recent-Onset Type 2 Diabetes: The TODAY Cohort at Baseline. Kenneth C. Copeland, Philip Zeitler, Mitchell Geffner, Cindy Guandalini, Janine Higgins, Kathryn Hirst, Francine R. Kaufman, Barbara Linder, Santica Marcovina, Paul McGuigan, Laura Pyle, William Tamborlane, and Steven Willi for the TODAY Study Group.
7. Obesity albuminuria, and hypertension among Hong Kong Chinese with non-insulin dependent diabetes mellitus (NIDDM). Chan JC, Cheung CK, Swaminathan R, Nicholls MG, Cockram CS. Postgrad Med J 1993: 69: 204–210.
53
have type 2 diabetes among school children in Taiwan. Diabetes Care 2003: 26: 343–348.
54
APPENDIX 1
DATA MANAGEMENT
The Diabetes in Children and Adolescent Registry (DiCARE) maintains a database that includes data from notification form and annual census form. Data is stored in SQL Server due to the high volume of data accumulated throughout the years.
Data sources
SDPs or Source Data Providers of DiCARE comprise of hospitals throughout Malaysia.
Data Flow Process
This section describes the data management flow process of the Diabetes in Children and Adolescent Registry.
1) SDP
2) SDP Data reporting, Data correction & Submission tracking
Query
3) Edit checks run and data cleaning
4) Data cleaning (Data update and checking, data standardization, data de-duplication)
5) Data review and coding
6) Final query resolution / Data cleaning (if any)
7) Database lock
55
SDP Data reporting, Data correction and Submission tracking
Data reporting by SDP is done via Web Applications e-Case Report Forms.
There are a number of data security features that are designed into DiCARE web application (eCRF) such as web owner authentication, two-level user authentication (user name and password authentication and a Short Messaging System (SMS) of authorization code to mobile phone authentication), access control, data encryption, session management to automatically log off the application, audit trail and data backup and disaster recovery plan.
SDP submits DiCARE Notification form on ad hoc basis whenever there is a case. SDP also submits annual census data. An alert page containing all overdue submissions for annual census is available to users to ease submissions tracking.
Prior to registering a patient record, a verification process is done by using the search function to find if a patient exist in the entire registry. The application will still detect a duplicate record if the same IC number is keyed in should the step of searching patient is left out. This step is done to avoid duplicate records. For patients that exist in the database, SDP only needs to add a new notification with basic patient particulars pre-filled based on existing patient information in the database.
There are a few in-built functionalities at the data entry page that serve to improve data quality. One such function is auto calculation function to reduce error in human calculation. There is also an inconsistency check function that disables certain fields if these fields are answered in a certain manner. When value entered is out of range, user is prompted for the correct value.
56
A link is provided on the data query page for users to click on to resolve the query for the particular patient.
Real time reports are also provided in the web application. The aggregated data reports are presented in the form of tables and graphs. The aggregated data reports are typically presented in two manners; one as centre’s own data aggregated data report and second as registry’s overall aggregated data report. This way, the centre is able to compare itself against the overall registry’s average.
Data download function is also available in the web application to allow users to download their own centre’s data for all the forms entered for their own further analysis. The data are downloadable as Text - tab delimited (.txt) format, Microsoft excel workbook (.xls) and Comma separated value (.csv) format.
Edit checks run and Data cleaning
Edit check was performed periodically by the registry manager to identify missing compulsory data, out of range values, inconsistency data, invalid values and error with de-duplication. Data cleaning is then performed based on the results of edit checks. Data update and data checking of the dataset is performed when there is a query of certain fields when necessary. It could be due to request by user, correction of data based on checking from data query in eCRF or after receiving results for preliminary data analysis. During data standardization, missing data are handled based on derivation from existing data. Data deduplication is also performed to identify duplicate records in the database that might have been missed by the SDP.
Data review and coding
57
that complex medical data are reviewed and assessed to detect clinical nuances in the data.
Final query resolution / data cleaning / database lock
A final edit check run was performed to ensure that data is clean. All queries were resolved before database is locked to ensure data quality and integrity. Final dataset is subsequently locked and exported to the statistician for analysis.
Data analysis
Please refer to the Statistical Analysis Method section for further details.
Data release policy
58
Registry ICT infrastructure and Data centre
The operations of the DiCARE are supported by an extensive ICT infrastructure to ensure operational efficiency and effectiveness.
DiCARE subscribes to co-location service with a high availability and highly secured Internet Data Centre at Cyberjaya in order to provide DiCARE with quality assured Internet Hosting services and state-of-the-art physical and logical security features without having to invest in costly data centre setup internally. Physical security features implemented are of state of the art technology and include anti-static raised flooring, fire protection with smoke and heat alarm warning system, biometric security access, video camera surveillance system, uninterrupted power supply, environmental control, etc.
59
Appendix
ANALYSIS SETS, STATISTICAL METHODS AND DEFINITIONS :
ANALYSIS SETS
This refers to the sets of cases whose data are to be included in the analysis. Two analysis sets were defined:
1. Patients notification between 2006 and 2008.
There were 408 patients in this dataset. This analysis set was used for the
analysis in Chapter 1, 2, 3 and 4 which include data such as patient’s particulars,
family history, duration and type of diabetes, anthropometric and clinical examination details and diabetes management.
DATA MANAGEMENT
Data cleaning