Full Terms & Conditions of access and use can be found at
http://www.tandfonline.com/action/journalInformation?journalCode=vjeb20
Download by: [Universitas Maritim Raja Ali Haji] Date: 11 January 2016, At: 22:04
Journal of Education for Business
ISSN: 0883-2323 (Print) 1940-3356 (Online) Journal homepage: http://www.tandfonline.com/loi/vjeb20
On the Use of Cell Phones and Other Electronic
Devices in the Classroom: Evidence From a Survey
of Faculty and Students
William M. Baker , Edward J. Lusk & Karyn L. Neuhauser
To cite this article: William M. Baker , Edward J. Lusk & Karyn L. Neuhauser (2012) On the Use of Cell Phones and Other Electronic Devices in the Classroom: Evidence From a Survey of Faculty and Students, Journal of Education for Business, 87:5, 275-289, DOI: 10.1080/08832323.2011.622814
To link to this article: http://dx.doi.org/10.1080/08832323.2011.622814
Published online: 05 Jun 2012.
Submit your article to this journal
Article views: 2247
View related articles
ISSN: 0883-2323 print / 1940-3356 online DOI: 10.1080/08832323.2011.622814
On the Use of Cell Phones and Other Electronic
Devices in the Classroom: Evidence From a Survey
of Faculty and Students
William M. Baker
Appalachian State University, Boone, North Carolina, USA
Edward J. Lusk
State University of New York, Plattsburgh, Plattsburgh, New York; and University of Pennsylvania, Philadelphia, Pennsylvania, USA
Karyn L. Neuhauser
Lamar University, Beaumont, Texas, USA
The authors investigated faculty and student perceptions regarding the use of cell phones and other electronic devices in the classroom. Students differed markedly from faculty, with students exhibiting much greater acceptance of in-class use of technology. Among students, the authors found that gender affected perceptions. Specifically, male students were more accepting of in-class use of technology than were female students. Also, graduate students were more disturbed by off-task use of laptop computers in class than their undergraduate counterparts. This research should be of interest to postsecondary educators and administrators in attempting to bridge the student-faculty generation gap, and in formulating policies regarding the use of electronic devices in the classroom.
Keywords: cell phones, cell-phone policies, laptops, MP3 players, students versus faculty, technology
For more than five decades, educators have known that elec-tronic devices are essential elements of education in business (American Accounting Association, 1960). Transistor radios gave way to portable audio cassette players (e.g., the Sony Walkman), which subsequently gave way to today’s MP3 players (e.g., the Apple iPod). Laptop and netbook comput-ers have made computer technology more portable and more affordable for today’s students. Bulky paper date books, ad-dress books, and scheduling calendars have been replaced by personal digital assistants (PDAs), and cell phones have been ubiquitous on college campuses for at least a decade (“Prime numbers,” 2000). Smart phones function not only as cell phones but also offer many MP3, laptop, and PDA fea-tures in one device. Today, there is no doubt that electronic
Correspondence should be addressed to William M. Baker, Appalachian State University, Department of Accounting, 3112 Raley Hall, Walker COB, Boone, NC 28608, USA. E-mail: [email protected]
devices are commonplace across all college campuses. But should the use of these electronic devices be commonplace in the classroom? This research seeks to shed light on that question.
LITERATURE REVIEW
Pedagogical Help—Or Hindrance?
Educators are constantly seeking ways to improve the learn-ing experience for students, so it is no surprise that most of the research concerning electronic devices in the classroom fo-cuses on pedagogical enhancements. As early as 1983 (Tech-nology Section), Clarkson University provided computers for students and expected students to routinely use them. In the mid-1990s, schools such as Wake Forest University began to develop and implement strategic plans that included personal computers for students (Brown, Burg, & Dominick, 1998),
arguing that they were necessary for collaborative learning and computer literacy.
Today, most pedagogical research concerning laptops fo-cuses on whether they do, indeed, offer pedagogical advan-tages. For example, Brown et al. (1998), Brown and Petitto (2003), and Hall and Elliott (2003) attempt to convince all business-faculty members that classroom instruction using laptops is practically a necessity, whereas Elwood, Chang-chit, and Cutshall (2006) observed that, although laptop us-age may be ubiquitous, programs and strategies for using laptops in the classroom are not. Elwood et al. developed a model that suggests that whether students embrace the use of laptops depends on three factors: (a) perceived usefulness, (b) perceived ease of use, and (c) perceived change. Although the model appears to address the central issues, the authors noted that its practical applications are limited to use as a basis for discussion. No indication as to how to implement the model, or consistently measure the effects of its three factors, is provided.
Skolnik and Puzo (2008) studied students and fac-ulty who strongly indicated that laptop computers enhance instruction—mainly by enhancing spreadsheet skills and pro-viding the opportunity to record notes electronically—but found that laptops in the classroom may increase academic dishonesty, and on average, 15% of students lose focus on class topics and drift away to other computer applications. Lectures accompanied by PowerPoint slides most often re-sulted in off-task activities, suggesting that passive learning creates the greatest opportunity for students to be distracted by the laptop technology. Fried (2008) pointed out that, in a number of cases reported in the popular press, faculty mem-bers and universities have sought to prohibit or restrict laptop use in the classroom. In her research she found that stu-dents using laptops frequently engage in multitasking, but student learning—as measured by self-reported understand-ing of course material and overall course performance—is negatively affected, and laptop use is distracting to fellow students. Hembrooke and Gay (2003) focused solely on the effects of multitasking using laptops, and also concluded that laptop use decreases learning in the college classroom. Wurst, Smarkola, and Gaffney (2008) reached a similar conclusion when studying honors and nonhonors college students.
There is less research concerning the pedagogical advan-tages and disadvanadvan-tages of other electronic devices. However, Kulesza, DeHondt, and Nezlek (2010) argued that reliance on contemporary technologies in the classroom does not guar-antee a better learning experience and may actually result in decreased student interest in learning, excessive dependence on technology, lower student engagement, and increased dis-traction, at least for some students. Bugeja (2008) argued that although new technologies—including cell phones, lap-tops, music players, and game consoles—keep individuals connected, they also keep them constantly distracted. Fur-thermore, he suggested that the new challenge to academia lies in the pervasive unwillingness to do anything about it.
Wagner (2005) argued that laptop and notebook computers and cell phones are the most important hardware issue on most campuses these days and points out the potential for these devices to encourage or enable cheating, interfere with deeper learning, and inhibit critical thinking and effective communication.
Braguglia (2008) conducted a survey on cell phone use on college campuses. However, her work differs from ours in that (a) her sample consisted of only 84 undergraduate business majors at a single university and (b) her survey was much shorter, focused only on cell phone use, and in many cases focused on different aspects of cell phone use. Interestingly, in the two instances in which her study overlaps with ours, her findings are quite different. For instance, she found that 45% of students reported spending more than 4 hr a day on their cell phone whereas we found that only 19% of undergraduates reported spending more than 3 hr a day on their cell phone. Also, 54% of her respondents reported using their cell phone in every class whereas only 31% of undergraduate students in our survey reported use in almost every class.
When it comes to MP3 players, existing research has fo-cused on the advantages and disadvantages of podcasting. Students seem to place some importance on the availabil-ity of podcast recordings of class lectures (Guertin, Bodek, Zappe, & Kim, 2007). McKinney, Dyck, and Luber (2009) concluded that students learn more from a podcast (that they can view more than once) than they do with a one-time lecture—but this additional learning only occurs when the students take notes during the podcast (as they would in class) and view the podcast more than once.
Overall, the research on technology in the classroom is inconclusive and still in the early phase despite its seeming importance due to the large role it now plays in our everyday lives, particularly in the lives of the under-25 crowd. This research sets out to fill some of the gaps in the literature, provide up-to-date information, and offer practical guidance for handling the use of technology in the classroom.
Faculty–Student Differences
When it comes to cell phones, research concerning the ped-agogical advantages and disadvantages is still quite new and inconclusive. End, Worthman, Mathews, and Wetterau (2010) used an experimental design to show that a ringing cell phone impairs student performance. Both groups of test subjects watched an instructional video, took notes on the video, and then took a multiple-choice test over material pre-sented in the video. One group’s viewing of the video was interrupted by a ringing cell phone whereas the other group’s was not. Students in the ringing condition group were signif-icantly more likely to have omitted information in their notes and were significantly less likely to give the correct answer on the test.
According to Bugeja (2007), some instructors have outlawed electronic devices in their classrooms with positive results. Bugeja argued that soon all faculty members will include policies regarding the in-class use of electronic devices on their syllabi. However, Gilroy (2003) argued that the opinions of faculty regarding the use of cell phones in the classroom are quite diverse, with some faculty members wishing to ban them and others feeling that even guidelines on cell phone use are overly restrictive and unnecessary. It seems that whether and which aspects of cell phone usage are disruptive is unclear, and we believe students and faculty likely differ in their opinions on this matter. To understand these issues, it is important to carefully investigate these differences in perceptions.
In a study focusing on young people ages 11–17 years and their parents, Devitt and Roker (2009) found that parents and children believe cell phones are essential for keeping in touch with each other. Similarly, Bauman (2009) found that college students who use electronic devices to keep in touch with their family are extremely satisfied with that ap-proach, and that these students tend to be more successful academically. In addition, Manthe (2009) found that they adjust better to college life and are less likely to drop out, whereas Quan-Hasse (2007) concluded that electronic social interaction is entrenched in such students’ lives and therefore, when teachers prohibit the use of electronic devices during class time, students may think teachers are unfair. Obringer and Coffey’s (2007) survey found that 84% of American high schools have a written policy on cell phone use and 76% do not permit cell phone use by students. Unlike elementary and secondary schools, most universities have seemingly been slow to develop cell phone use policies, presumably because college students are viewed as adults who can wisely govern their own use of this technology. However, when undergrad-uate students in a business ethics and corporate responsibil-ity course at Western Carolina Universresponsibil-ity were required to design a student code of professional ethics as a semester project, the students chose to include a section on the use of technology and to provide within that section, guidelines on the use of cell phones (Willey and Burke, 2011).
Prensky (2001) provided a rationale for the inherent dif-ferences in perspective between students and faculty. Even if faculty members regularly use electronic devices, because they are from an older generation that did not grow up depending upon such devices, they are digital immigrants. Members of the millennial generation1—which encompasses the majority of today’s students—are digital natives. Al-though digital immigrants know how to use electronic de-vices, digital natives are so accustomed to such devices that they have essentially become similar to bodily appendages, and digital natives feel that attempts to remove these ap-pendages at any time are irrational or wrong. Domitrek and Raby (2008) explored differences among teachers, admin-istrators, and students from Prensky’s viewpoint and found that students view electronic devices as (a) essential
ele-ments of social life, (b) necessary at all times for safety, and (c) integral factors in everyday life. Teachers—even if they qualify as digital immigrants—view electronic devices as take-it-or-leave-it devices that are unnecessary in the class-room. Students are troubled by inconsistencies demonstrated by teachers; they witness teachers using cell phones in other areas where they are forbidden (e.g., hospitals), and see them using MP3 players while they work. Also, by and large, ad-ministrators are neither digital immigrants nor digital natives, and their views are different from teachers and students. In short, most students are digital natives, most teachers are dig-ital immigrants, and most administrators are neither. Ironi-cally, though, it is the administrators who create most of the policies forbidding electronic devices in the classroom, without ever consulting students or teachers.
One of the most comprehensive studies of cell phone use in the college classroom was done by Campbell (2006), who examined the perceptions of faculty and students across all college disciplines and majors regarding policies banning cell phones in classrooms, ringing of cell phones during class, complaints regarding cell phone use during class, and the likelihood of cheating using mobile phones. Campbell reported that faculty and students “generally reported nega-tive attitudes about mobile phones in college classrooms” (p. 286). Participants regarded ringing cell phones as a problem that was serious enough to necessitate policies prohibiting in-class use. Though not as commonly perceived as a prob-lem, cell phones were sometimes also perceived as catalysts for cheating or sources for complaints. Campbell linearly combined several variables—including age, sex, and phone usage—and explained differences between faculty and stu-dents. Further analysis led to reclassifying age in four quar-tiles. At this point, age was a dominant predictor variable. Further, the first quartile, which corresponded to the mil-lennial generation, was far less negative than the remaining quartiles in its perceptions regarding ringing, antiuse poli-cies, cheating, and complaining.
Garcia (2007) provided additional evidence that faculty and students view electronic devices differently when it comes to classroom use. She noted that most of today’s students are members of the millennial generation and argued that this generation needs sufficient gadgetry “to stay in virtually uninterrupted contact with the world” (p. 13). Millennials believe that all learning should be inundated with technology. Students of this generation view electronic devices as a must, and believe that the Internet is like oxygen. Classroom education has long been criticized for being disjointed from the real world. Millennials believe that classrooms without an abundance of electronic devices are even more unrealistic and artificial. This strong disconnection is made even stronger when teachers do not embrace technology 24 hours a day and 7 days a week.
Garcia (2007) also noted that today’s faculty members, most of whom are baby boomers, still believe lectures can be useful, even though lectures benefit only slightly
from technology. Millennials view PowerPoint slides as poor disguises for lecture-based instruction. Millennials also hold a negative view of lecturers as authoritarian figures or bosses and prefer instead to learn from mentors. When faculty members set forth rules regarding the use of electronic devices in the classroom, the authoritarian image is deepened. In short, millennials believe that lectures create a learning barrier, and banning technology in the classroom reinforces that barrier. At the same time, faculty members believe millennials lack discipline and maturity and thus need rules regarding the use of electronic devices. It is important that university professors as a profession, begin to address and reconcile these competing viewpoints.
RESEARCH QUESTIONS
In recent years, researchers have begun to recognize the im-portance of studying the use of electronic devices in the classroom. However, the research in this area is incomplete, even though more and more students are bringing electronic devices into the classroom. Thus, we sought to shed light on the following research question using a comprehensive survey:
Research Question 1: What are the perceptions of faculty members and students regarding the use of electronic devices in the classroom?
Theoretical research, whether based on generational dif-ferences (millennials vs. baby boomers), or familiarity with the technologies (digital immigrants vs. digital natives), sug-gests that perceptual differences exist between students and faculty members. The existing research suggests that faculty may perceive electronic devices to be less appropriate in the classroom than students, but no research exists that suggests either students’ or faculty members’ perceptions are norma-tively superior. However, a first step is to determine whether student perceptions do, indeed, differ from faculty percep-tions. As such, the following research question was posed:
Research Question 2: Do perceptions regarding the use of electronic devices in the classroom differ between stu-dents and faculty members?
Researchers have pointed out the importance of demo-graphic variables and how they affect perceptions regarding electronic devices. Manthe (2009) argued that electronic de-vices are strong catalysts in students’ adaptation to college life, and that their effects as catalysts differ between males and females. Campbell (2006) used a linear combination of age and gender along with electronic device usage to study perceptions of the appropriateness and misuse (via cheating) of mobile phones. To fully understand faculty and student perceptions, the effects of demographic variables such as gender, age, and faculty rank on perceptions must be exam-ined. This led to the third research question.
Research Question 3:Do demographic characteristics affect perceptions concerning the use of electronic devices in the classroom?
RESEARCH METHODS
To investigate perceptions concerning the use of electronic devices, we used an eight-page survey consisting of 55 questions. The first page of this survey instrument contains instructions for completing the survey. The survey itself consists of four sections. Eight questions designed to collect demographic data are contained in the first section. Data about the availability of technology, and how often it is used, are gathered using eight questions in the second section. The demographics questions and the general questions about technology usage each presented a number of possible responses to the particular question. In the demographics section, there were five questions for which we could not be completely sure that our menu of choices encompassed every possibility and therefore respondents were given a choice of “other.” Respondents were expected to indicate their choice by placing a check mark in the appropriate blank. The third section of the survey is the longest, consisting of 33 questions, and is designed to collect information from all participants on their perceptions of the appropriateness of using technology in the classroom. In this section, 30 questions required a re-sponse indicating whether the respondent agreed or disagreed with the statement based on a 5-point Likert-type scale, two questions offered a menu of choices (including a choice of “other” in which the respondent could fill in the blank), and a final open-ended question left space for the respondent to indicate any additional comments they wished to make. The Likert-type scale corresponded to responses of 1 (strongly disagree) to 5 (strongly agree). In the fourth and final section, students were asked to answer six questions about their usage of technology in the classroom.2These questions consisted of a menu of choices and students were expected to indicate their choice by placing a check mark in the appropriate blank. With the exception of questions 13 and 14, which are discussed only in the text, and question 49, which was an open-ended question allowing respondents to make any additional comments, all survey questions are shown in the tables.3
We conducted seven distinct pilot tests, and the discrimi-nant validity of the questionnaire was strong. Given that only 2 out of 978 questionnaires were eliminated due to illogical response pair testing, the respondents displayed a uniform understanding of the questionnaire.
This survey was administered to students and professors at three public universities located in New York, North Carolina, and Texas after it had been pilot-tested in all three locations. At all three universities, students were asked to complete the survey at the beginning of a regular class period, whereas faculty surveys were distributed to faculty
mailboxes and via email asking them to complete and return the survey within a two-week timeframe.4Participation was entirely voluntary and respondents received no credit or other types of incentive for participating. The choice of the number of classes at each university was designed to elicit a total number of responses in the range of 250–350 students from each university.
The appropriate sample size for the study was set so as to accomplish two goals. First, the sample size provided a 95% confidence interval with precision of 2% of the Likert-type scale range; this was judged to be sufficient to provide use-ful demographic information. Second, the sample size was designed to provide power of at least 80% for nondirectional (i.e., conservative) two-sample mean difference tests. The overall expectation based on these two goals was thus de-termined to be a sample size of at least 200 respondents per university. This sample size was more than achieved for each university, so the confidence intervals and the power of the statistics are conservatively bounded at the design parameters indicated previously.
RESULTS
We received 978 completed surveys—882 from students and 96 from faculty members. The totals reported for each ques-tion in the tables do not always equal the total number of re-spondents because some rere-spondents returned surveys with-out answering certain questions or in a very small number of instances chose more than one response when only one response was permitted (e.g., on Likert-type scale questions).
Demographic Profile
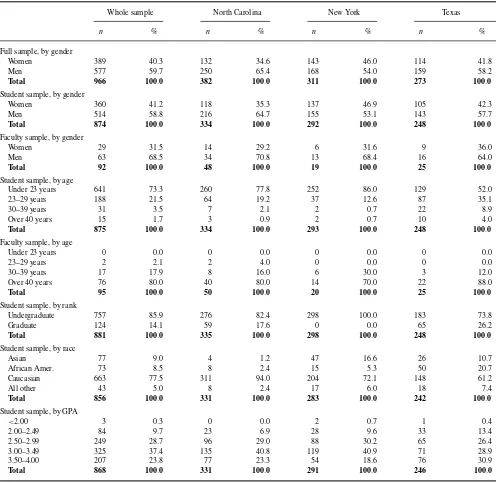
Demographic data are reported in Table 1. The distribu-tion across higher educadistribu-tion institudistribu-tions is roughly equal but there are somewhat fewer respondents from the Texas school (27.9% of the sample) and somewhat more from the North Carolina school (39.6% of the sample), with the remaining 32.5% from the New York school. Not surprisingly, far more students (882 total) than faculty (96 total) participated in the survey. Of the 874 student participants responding to the question about gender, 41.2% were women whereas 58.8% were men. Of the 92 faculty participants responding to this question, 31.5% were women whereas 65.6% were men. This is not surprising given that the majority of business faculty in higher education are men5and that many business school
classes attract a larger number of men than women.
For the overall sample, about three quarters of the student respondents were under 23 years old. However, the propor-tion of students in this age group was higher at the New York school, which served only undergraduates, and considerably lower (only about one half the sample) at the Texas school. The vast majority of students for the full sample and at each school were under 30. Not surprisingly, the age distribution
was quite different for faculty with most being over 40 (80% of the full sample and 70–88% at each school). Only two faculty members, or 2.1%, out of the 95 responding to this question were under 30.
Of the students responding to the question about whether they are undergraduate or graduate students, 85.9% indicated undergraduate standing whereas 14.1% indicated graduate standing. However, the proportions at the North Carolina and Texas schools were actually about two thirds undergrad-uate versus one third gradundergrad-uate students whereas the New York school sample was composed entirely of undergraduate students because the business school there did not have a graduate program.
About three quarters of the sample indicated their race to be Caucasian whereas about 9% indicated Asian, 8.5% indicated African American, and 5% indicated other races. A much larger proportion of the North Carolina school sample indicated Caucasian, 94%, whereas the New York school sample had a larger proportion of Asian students, 16.6%, and the Texas school sample had a much larger proportion of African American students, 20.7%.
Students were also asked to self-report their overall grade point average (GPA). For the full sample, 24% indicated a GPA of 3.50 or higher, 37% reported a GPA of 3.00–3.49, 29% reported a GPA of 2.50–2.99, and 10% reported a GPA of 2.00–2.49. Only 3 students out of 868 responding to this question reported a GPA below 2.00. GPA distributions were roughly similar across schools.
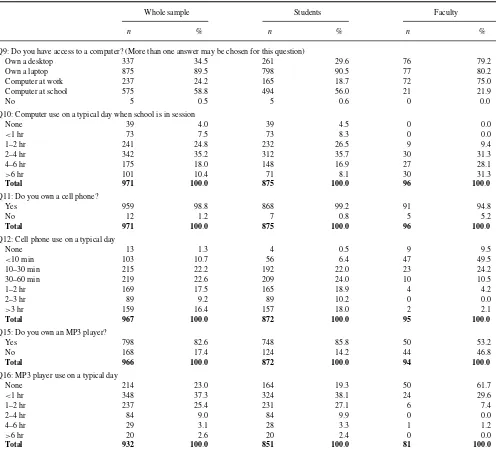
Access to and Use of Technology
Table 2 shows respondents’ access to and use of technol-ogy. Consistent with the notion that access to technology is widespread, 90% of the respondents owned a laptop com-puter (Q9), 99% had a cell phone (Q11), and 83% owned an MP3 player (Q15). Although laptop ownership was quite common among faculty and students, faculty are much more likely to own a desktop computer (79% of faculty vs. 30% of students). Not surprisingly, faculty more often had access to computers at work (75% of faculty vs. 19% of students) whereas students more frequently indicated access to com-puters through school (22% of faculty vs. 56% of students). Cell phone ownership was ubiquitous in both groups but there is a larger proportion of faculty who did not own a cell phone (5%) than students (<1%). MP3 player ownership was
also much more prevalent among students (86%) than faculty (53%).
As for usage of technology, on a typical day, computer use was higher among faculty (mean response to Q10 of 3.8 or 4–6 hr for faculty compared with 2.8 or 2–4 hr for students). Almost 70% of faculty spent four or more hours on the computer compared with only 25% of students. The majority of students, 62%, spent between 1 and 4 hr on the computer each day. At least two explanations for this finding spring to mind. First, most faculty members are employed full-time
TABLE 1
Demographic Characteristics of Sample
Whole sample North Carolina New York Texas
n % n % n % n %
Full sample, by gender
Women 389 40.3 132 34.6 143 46.0 114 41.8
Men 577 59.7 250 65.4 168 54.0 159 58.2
Total 966 100.0 382 100.0 311 100.0 273 100.0
Student sample, by gender
Women 360 41.2 118 35.3 137 46.9 105 42.3
Men 514 58.8 216 64.7 155 53.1 143 57.7
Total 874 100.0 334 100.0 292 100.0 248 100.0
Faculty sample, by gender
Women 29 31.5 14 29.2 6 31.6 9 36.0
Men 63 68.5 34 70.8 13 68.4 16 64.0
Total 92 100.0 48 100.0 19 100.0 25 100.0
Student sample, by age
Under 23 years 641 73.3 260 77.8 252 86.0 129 52.0
23–29 years 188 21.5 64 19.2 37 12.6 87 35.1
30–39 years 31 3.5 7 2.1 2 0.7 22 8.9
Over 40 years 15 1.7 3 0.9 2 0.7 10 4.0
Total 875 100.0 334 100.0 293 100.0 248 100.0
Faculty sample, by age
Under 23 years 0 0.0 0 0.0 0 0.0 0 0.0
23–29 years 2 2.1 2 4.0 0 0.0 0 0.0
30–39 years 17 17.9 8 16.0 6 30.0 3 12.0
Over 40 years 76 80.0 40 80.0 14 70.0 22 88.0
Total 95 100.0 50 100.0 20 100.0 25 100.0
Student sample, by rank
Undergraduate 757 85.9 276 82.4 298 100.0 183 73.8
Graduate 124 14.1 59 17.6 0 0.0 65 26.2
Total 881 100.0 335 100.0 298 100.0 248 100.0
Student sample, by race
Asian 77 9.0 4 1.2 47 16.6 26 10.7
African Amer. 73 8.5 8 2.4 15 5.3 50 20.7
Caucasian 663 77.5 311 94.0 204 72.1 148 61.2
All other 43 5.0 8 2.4 17 6.0 18 7.4
Total 856 100.0 331 100.0 283 100.0 242 100.0
Student sample, by GPA
<2.00 3 0.3 0 0.0 2 0.7 1 0.4
2.00–2.49 84 9.7 23 6.9 28 9.6 33 13.4
2.50–2.99 249 28.7 96 29.0 88 30.2 65 26.4
3.00–3.49 325 37.4 135 40.8 119 40.9 71 28.9
3.50–4.00 207 23.8 77 23.3 54 18.6 76 30.9
Total 868 100.0 331 100.0 291 100.0 246 100.0
Note.This table summarizes the responses to the first eight questions of the survey instrument (Q1–Q8) that asked whether the respondent was a student or
professor, what the respondent’s major or area of teaching expertise was, what year the student was in college (e.g., freshman, sophomore, graduate student) or what title the professor held, the respondent’s gender, age, race, ethnicity, and student’s grade point average (GPA).
in a job that typically requires extensive use of computers. Second, most students spend several hours per day in classes and most classes do not require the use of a computer during class. Surprisingly, almost 13% of students reported using a computer for less than 1 hr per day whereas no faculty respondents reported such a low level of computer use.
On the other hand, students spent much more time on their cell phones than faculty. The mean response to Q12
for students was 3.6, which corresponds with 1–2 hr of cell phone use per day, whereas the mean response of faculty members is 1.6, which corresponds with 10–30 min of using the cell phone each day. Almost 30% of students report using their cell phone for over 2 hr per day. Among faculty only 2 out of 95 respondents, or 2%, reported such high usage.
We also collected data on the number of calls or text messages sent and received each day (not shown in table).
TABLE 2
Access to and Use of Electronic Devices in General
Whole sample Students Faculty
n % n % n %
Q9: Do you have access to a computer? (More than one answer may be chosen for this question)
Own a desktop 337 34.5 261 29.6 76 79.2
Own a laptop 875 89.5 798 90.5 77 80.2
Computer at work 237 24.2 165 18.7 72 75.0
Computer at school 575 58.8 494 56.0 21 21.9
No 5 0.5 5 0.6 0 0.0
Q10: Computer use on a typical day when school is in session
None 39 4.0 39 4.5 0 0.0
<1 hr 73 7.5 73 8.3 0 0.0
1–2 hr 241 24.8 232 26.5 9 9.4
2–4 hr 342 35.2 312 35.7 30 31.3
4–6 hr 175 18.0 148 16.9 27 28.1
>6 hr 101 10.4 71 8.1 30 31.3
Total 971 100.0 875 100.0 96 100.0
Q11: Do you own a cell phone?
Yes 959 98.8 868 99.2 91 94.8
No 12 1.2 7 0.8 5 5.2
Total 971 100.0 875 100.0 96 100.0
Q12: Cell phone use on a typical day
None 13 1.3 4 0.5 9 9.5
<10 min 103 10.7 56 6.4 47 49.5
10–30 min 215 22.2 192 22.0 23 24.2
30–60 min 219 22.6 209 24.0 10 10.5
1–2 hr 169 17.5 165 18.9 4 4.2
2–3 hr 89 9.2 89 10.2 0 0.0
>3 hr 159 16.4 157 18.0 2 2.1
Total 967 100.0 872 100.0 95 100.0
Q15: Do you own an MP3 player?
Yes 798 82.6 748 85.8 50 53.2
No 168 17.4 124 14.2 44 46.8
Total 966 100.0 872 100.0 94 100.0
Q16: MP3 player use on a typical day
None 214 23.0 164 19.3 50 61.7
<1 hr 348 37.3 324 38.1 24 29.6
1–2 hr 237 25.4 231 27.1 6 7.4
2–4 hr 84 9.0 84 9.9 0 0.0
4–6 hr 29 3.1 28 3.3 1 1.2
>6 hr 20 2.6 20 2.4 0 0.0
Total 932 100.0 851 100.0 81 100.0
The typical student received 26–50 text messages and voice calls on their cell phone each day (Q14) and sent out an additional 26–50 text messages and voice calls per day (Q13), whereas the typical faculty member received 3–5 messages and sent 3–5 messages per day. Thus, although computer usage was somewhat higher among faculty, cell phone usage was higher among students by an order of magnitude.
Students also used their MP3 players more than faculty did, with over 80% reporting daily usage compared with less than 30% of faculty using an MP3 player every day (Q16). The mean response was 1.5 for students, which roughly cor-responds to 1 hr of usage per day, versus 0.5 for faculty, which suggests less than 0.5 hr of daily usage.
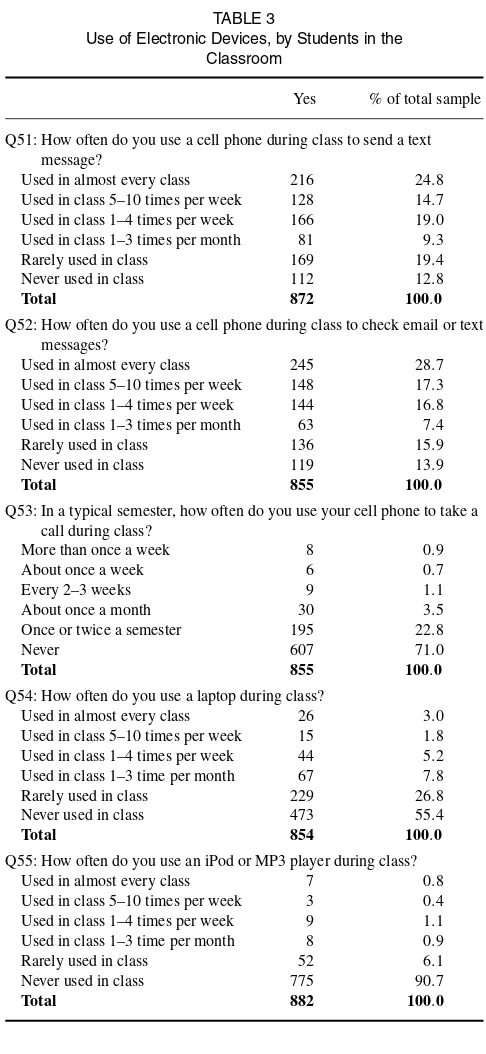
Table 3 reports the data collected on usage of electronic devices by students in the classroom. This part of the survey was only administered to students. At one end of the spec-trum, almost one quarter of students said that they send a text message in almost every class (Q51) whereas another 15% send 5–10 texts in class each week. At the other end of the spectrum, approximately one third of students said they rarely or never send texts during class. Students were slightly more likely to check texts (Q52) than to send them during class, with 29% saying they check them in almost every class and another 17% saying they check them in class 5–10 times per week. Once again, at the other extreme, almost one third of students said they rarely or never check text messages in
TABLE 3
Use of Electronic Devices, by Students in the Classroom
Yes % of total sample
Q51: How often do you use a cell phone during class to send a text message?
Used in almost every class 216 24.8
Used in class 5–10 times per week 128 14.7
Q52: How often do you use a cell phone during class to check email or text messages?
Used in almost every class 245 28.7
Used in class 5–10 times per week 148 17.3
Q53: In a typical semester, how often do you use your cell phone to take a call during class?
Q54: How often do you use a laptop during class?
Used in almost every class 26 3.0
Q55: How often do you use an iPod or MP3 player during class?
Used in almost every class 7 0.8
class. Over 70% of students reported that they never take a call during a typical semester (Q53) and an additional 23% limit themselves to one or two calls per semester. However, about 6% of students take a call more than once a month. Our a priori expectation was that graduate students would find it necessary to take more calls during class because some of them have very demanding jobs but, surprisingly, most of the more frequent call takers were undergraduate rather than graduate students. Another unexpected result was the limited use of laptops in class (Q54) with over 80% of students re-porting that they rarely or never use them. Not surprisingly,
students reported much less frequent use of MP3 players in class (Q55) with over 90% saying they are never used and only 3% reporting once a month or more frequent usage.
Perceptions on Use of Electronic Devices in the Classroom—Cell Phones
Table 4 shows mean responses to statements about the use of electronic devices in the classroom. A number of state-ments were designed to measure respondents’ beliefs about the appropriateness of cell phone use in the classroom. Two statements (Q17 and Q18) were framed to indicate inap-propriateness whereas four statements (Q19, Q20, Q23, and Q24) were framed in the opposite way, asking whether cell phone use was appropriate under various conditions. Re-spondents generally believe that using a cell phone in class is not appropriate, with 61% agreeing or strongly agreeing with Q17 concerning the inappropriateness of making calls or checking messages and 46% agreeing or strongly agreeing with Q18 concerning the inappropriateness of sending text messages or checking email. The mean response for these two statements was 3.60 and 3.21, respectively. Interestingly, a larger number of respondents, 57%, indicated that using a cell phone to send text messages is not appropriate when we add the additional information stating that “the lecture is not in-teresting” (Q19). The mean response to this question, which was framed in the opposite direction, was 2.45. Responses were more evenly split when we specified that cell phone usage in class was completely silent (Q20) with 44% (41%) of all respondents agreeing or strongly agreeing (disagreeing or strongly disagreeing) with the appropriateness of this be-havior and a mean response of 3.03. When we specified that not only was usage quiet but also that students were using the device to look up relevant information (Q23), the proportion of respondents disagreeing or strongly disagreeing with the appropriateness fell to 29% but the mean response of 3.08 was very similar to Q20. Q24 was very similar to Q18 except that it was framed in the opposite way and the phrasing is changed from “send text messages or answer email” to “send or answer email or to text.” The mean response of 2.67 is similar to that for Q18 but in the opposite direction as ex-pected. Overall, we believe that the similarity in responses to similar survey questions lends credence to the validity of our results.
Around 80% of respondents indicated that ringing cell phones in the classroom are disruptive (Q30) and that stu-dents who let their cell phones ring or make other noises are being rude or disrespectful (Q31) with mean responses of 4.13 and 4.08, respectively. In addition, almost half be-lieve that any use of cell phones is generally disruptive to the learning process (Q21), with a mean response of 3.30. Mixed beliefs were found for the question of whether certain types of cell phone use in class can actually assist the learning process (Q22), with an almost equal proportion agreeing or strongly
TABLE 4
Responses to Perceptual Questions About Cell Phones
All Student Faculty Difference test (p)
Q17: Using a cell phone to make calls or check messages in class is never appropriate.
Mean response 3.60 3.49 4.59 <.0001
Q18: Using a cell phone to send text messages or check email in class is never appropriate.
Mean response 3.21 3.07 4.49 <.0001
Q19: Using a cell phone to send text messages or check email in class is appropriate when the lecture is not interesting.
Mean response 2.45 2.53 1.63 <.0001
Q20: Cell phone use in class is appropriate only if it does not involve talking, beeping, or other noises.
Mean response 3.03 3.18 1.71 <.0001
Q23: Cell phone use in class is appropriate only if it is done quietly and the phone is being used to look up information that is relevant to the class material being discussed.
Mean response 3.08 3.16 2.40 <.0001
Q24: It is appropriate for a student to send or answer email or to text using a cell phone during class.
Mean response 2.67 2.79 1.64 <.0001
Q30: It is disruptive when another student’s cell phone goes off (rings or makes other noises) in class.
Mean response 4.13 4.07 4.69 <.0001
Q31: Students who let their cell phones ring or make other noises in class are being rude or disrespectful.
Mean response 4.08 4.03 4.51 <.0001
Q21: Any use of cell phones in class is generally disruptive to the learning process.
Mean response 3.30 3.18 4.34 <.0001
Q22: Certain types of cell phone use in class can assist in the learning process.
Mean response 3.00 3.08 2.33 <.0001
Q27: If the instructor asks students to turn off their cell phones during class, students should be required to do so.
Mean response 3.77 3.67 4.64 <.0001
Q33: As part of the campus emergency alert system, cell phones are critical to my safety and should be left on at all times. Mean response 3.77 3.87 2.94 <.0001
Q29: It is appropriate for instructors to prohibit the use of cell phones during an exam.
Mean response 4.48 4.45 4.81 <.0001
Q28: It is appropriate for instructors to collect students’ cell phones during an exam.
Mean response 2.01 1.95 2.40 .0002
Q36: Cell phones can potentially be used by some students to gain an unfair advantage on quizzes or exams.
Mean response 3.93 3.87 4.45 <.0001
Q34: It is okay for instructors to answer a cell phone call during class as long as they leave the classroom.
Mean response 2.92 3.07 1.54 <.0001
Q35: It is okay for students to answer a cell phone call during class as long as they leave the classroom.
Mean response 3.15 3.30 1.81 <.0001
Q45: Instructors should allow the use of a cell phone in class as long as the device is completely silent.
Mean response 3.17 3.31 1.85 <.0001
TABLE 5
Responses on How Many Cell Phone Rings Create a Disruption
Yes % of
response total sample
Q50: How many times does a cell phone have to ring during a class before it becomes disruptive to you?
Once 336 38.5
Twice 312 35.8
Three times 152 17.5
Four or more times 47 5.4
Ringing cell phones are not disruptive 24 2.8
Total 871 100.0
No response 11 1.3
agreeing, 36%, and disagreeing or strongly disagreeing, 40% and a mean response of 3.00.
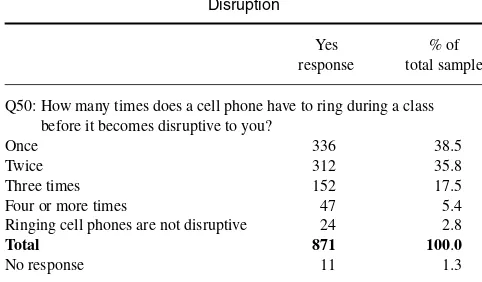
With respect to classroom policy, over two thirds of re-spondents agreed or strongly agreed that students should be required to turn off their cell phones if requested to do so by the instructor (Q27), with a mean response of 3.77. However, two thirds also agreed or strongly agreed that as part of the campus emergency alert systems, cell phones should be left on at all times (Q33), with a mean response of 3.77. Although 92% of respondents believe that instructors should be allowed to prohibit the use of cell phones during exams (Q29), 75% believe that instructors should not be allowed to collect them (Q28). The mean responses to Q28 and Q29 are 2.01 and 4.48, respectively. Respondents believe that cell phones can potentially be used to gain an unfair advantage on quizzes or exams (Q36), with 76% agreeing or strongly agreeing and a mean response of 3.93. Responses to whether instructors (Q34) and students (Q35) should be allowed to leave class to take a cell phone call were mixed, with a mean response of 2.92 and 3.15, respectively. However, respondents were less likely to agree or strongly agree with instructors taking calls during class (37%) than with students doing it (47%). Although 45% of respondents agreed or strongly agreed that instructors should allow the use of cell phones in class as long as the device is completely silent (Q45), 31% disagreed with this statement, resulting in a mean response of 3.17. Last, when asked to quantify how many times a cell phone had to ring before it becomes disruptive (Q50; see Table 5), the most popular answers are once (38.5% of respondents) or twice (35.8% of respondents).
Perceptions on Use of Electronic Devices in the Classroom—Laptops
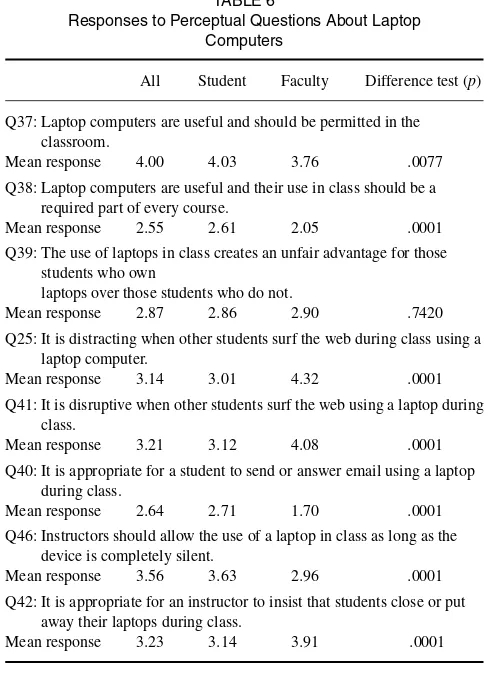
Table 6 shows responses to statements regarding laptop use in the classroom. Most respondents believe that laptop com-puters are useful and should be permitted in the classroom (78% agreed or strongly agreed with Q37) but few believe they should be a required part of every course (14% agreed or strongly agreed with Q38). The mean responses for Q37 and Q38 were 4.00 and 2.55, respectively. Only 28% of
TABLE 6
Responses to Perceptual Questions About Laptop Computers
All Student Faculty Difference test (p)
Q37: Laptop computers are useful and should be permitted in the classroom.
Mean response 4.00 4.03 3.76 .0077
Q38: Laptop computers are useful and their use in class should be a required part of every course.
Mean response 2.55 2.61 2.05 .0001
Q39: The use of laptops in class creates an unfair advantage for those students who own
laptops over those students who do not.
Mean response 2.87 2.86 2.90 .7420
Q25: It is distracting when other students surf the web during class using a laptop computer.
Mean response 3.14 3.01 4.32 .0001
Q41: It is disruptive when other students surf the web using a laptop during class.
Mean response 3.21 3.12 4.08 .0001
Q40: It is appropriate for a student to send or answer email using a laptop during class.
Mean response 2.64 2.71 1.70 .0001
Q46: Instructors should allow the use of a laptop in class as long as the device is completely silent.
Mean response 3.56 3.63 2.96 .0001
Q42: It is appropriate for an instructor to insist that students close or put away their laptops during class.
Mean response 3.23 3.14 3.91 .0001
respondents expressed concern about the fairness of laptop use when not all students have them (Q39). This may be due to the large number of students owning laptops, noted previously. However, respondents did express some concern about laptop use for surfing the web in class, with 46% agreeing or strongly agreeing that it is distracting (Q25) or disruptive (Q41). The mean responses for Q25 and Q41 were 3.14 and 3.21, respectively.6Most respondents also believed
that using a laptop to send or answer email in class is not appropriate, with 46% disagreeing or strongly disagreeing with Q40, which garners a mean response of 2.64. With regard to classroom policy, almost 60% of respondents believed that instructors should allow the use of laptops as long as it is completely silent (Q46) but 44% also agreed or strongly agreed that instructors should have the right to insist that students close or put away their laptops (Q42). The mean responses for Q46 and Q42 were 3.56 and 3.23, respectively.
Perceptions on Use of Electronic Devices in the Classroom—MP3 Players
Table 7 shows responses to statements regarding the use of MP3 players in the classroom. The vast majority of respon-dents did not believe that sturespon-dents should be allowed to listen to iPods or MP3 players during class (Q43) or during an exam
TABLE 7
Responses to Perceptual Questions About MP3 Players
All Student Faculty Difference test (p)
Q43: Students should be allowed to listen to iPods or MP3 players during class.
Mean response 1.69 1.73 1.30 .0001
Q44: Students should be allowed to listen to iPods or MP3 players during an exam or quiz.
Mean response 1.78 1.83 1.32 .0001
Q47: Instructors should allow the use of an iPod or MP3 player in class as long as the device is completely silent.
Mean response 2.10 2.16 1.53 .0001
or quiz (Q44), nor did they believe instructors should allow them to be used even if the device is completely silent (Q47). The percentage disagreeing or strongly disagreeing with these questions was 86%, 81%, and 70%, respectively, and the mean responses were 1.69, 1.78, and 2.10, respectively.
Overall, respondents tended to indicate that use of laptops is appropriate in the classroom, certain uses of cell phones are appropriate, and the use of MP3 players is inappropriate. The discussion thus far is based on the results of the full set of responses. However, much more insight is gained when student and faculty responses are examined separately. This is the topic of the next two sections.
Comparison of Student and Faculty Responses—Cell Phones
We examine differences in the mean response of students compared with faculty in Tables 4, 6, and 7. The significance level of the difference is indicated by thepvalue shown in the rightmost column.
Returning to Table 4, over 90% of faculty agreed or strongly agreed that using cell phones to make calls or check messages is never appropriate (Q17), whereas only 58% of students agreed or strongly agreed with this statement. The mean response was 3.49 for students versus 4.59 for faculty. These differences in student versus faculty perceptions persisted even when the statement asked about the appro-priateness of using electronic devices quietly. For instance, whereas 87% of faculty members expressed some level of agreement with the idea that using a cell phone to send text messages or check email in class is never appropriate (Q18), only 41% of students agreed with this statement. The mean responses were 4.49 versus 3.07, respectively. Although 48% (36%) of students agreed or strongly agreed (disagreed or strongly disagreed) with the statement that cell phone usage is appropriate if it does not involve talking, beeping, or other noises (Q20), the corresponding figures for faculty members are 13% (82%). The mean response was 3.18 for students versus 1.71 for faculty. This difference in beliefs exists even if the student is quietly researching material
relevant to class discussion (Q21) with a mean response of 3.16 for students versus 2.40 for faculty. Although students and faculty are bothered by ringing cell phones (Q30 and Q31), faculty found this more disruptive and are more likely to view it as rude or disrespectful than students. In addition, faculty view cell phones as more disruptive and less likely to assist in the learning process (Q21 and Q22) than students.
When asked about the rights of faculty to control cell phone use in the classroom, the perceptions of faculty again differ significantly from those of the students. Almost 93% of faculty members believe they have the right to insist that students turn off their cell phones in class (Q27), whereas only 66% of students agree with this statement. The mean responses were 3.67 for students and 4.64 for faculty. Al-though faculty and students tended to disagree with the idea that it is appropriate for an instructor to collect student cell phones during an exam (Q28), the level of disagreement was higher among students, with a mean response of 1.95 com-pared with 2.40 for faculty. Similarly, although faculty and students tended to agree that it is appropriate for instructors to prohibit cell phone use during an exam (Q29), the level of agreement with this statement is significantly higher among faculty, with a mean response of 4.81 compared with 4.45 for students. Students were also more inclined to agree with the idea that cell phones are critical to their safety due to their use in campus emergency alert systems (Q33). The mean response to this statement is 3.87 for students versus 2.94 for instructors. Instructors tended to be more concerned about the use of cell phones to cheat on exams (Q36), with over 90% of instructors believing this is a problem versus 74% of students and a mean response of 4.45 for instructors versus 3.87 for students.
The results also indicate that a large proportion of students believe that leaving the classroom to answer a cell-phone call is appropriate whether the individual is a faculty member or student (mean student response to Q34 and Q35 was 3.07 and 3.30, respectively), whereas faculty members very much disagree (mean faculty response to Q34 and Q35 was 1.54 and 1.81, respectively). Overall, it is exceedingly obvious that students and faculty members have different views about the appropriateness and disruptiveness of electronic devices in the classroom.
Comparison of Student and Faculty Responses—Laptops and MP3 Players
Table 6 shows that 80% of students agree or strongly agree that laptop computers are useful and should be permitted in the classroom (Q37), whereas only 62% of faculty agree or strongly agree with this statement. The mean response was 4.03 for students versus 3.76 for faculty. With regard to the more extreme statement that laptops should be used in ev-ery course (Q38), only 46% of students disagree or strongly disagree compared with 72% of faculty. Students and faculty had similar beliefs about whether the use of laptops creates
an unfair advantage for the haves versus the have-nots (Q39). However, when it comes to statements concerning web surf-ing in the classroom (Q25 and Q41), 42% of students agreed or strongly agreed that it is disruptive or distracting, whereas 80% of faculty agreed or strongly agreed with these state-ments. Students were also significantly less likely to disap-prove of answering email during class (Q40), more likely to believe that instructors should allow the quiet use of laptops in class (Q46), and less likely to believe instructors have a right to insist that students close or put away their laptops (Q42).
Eighty-six percent of students disagreed or strongly disagreed that students should be allowed to listen to MP3 players in class (Q43), whereas 94% of faculty disagreed or strongly disagreed with this statement. Table 7 shows the mean response is 1.73 for students versus 1.30 for faculty. About 80% of students disagreed or strongly disagreed that students should be allowed to listen to MP3 players during an exam or quiz (Q44) whereas 92% of faculty disagreed or strongly disagree with this statement. Similarly, 68% of students disagree or strongly disagree with Q47 concerning the silent use of MP3 players compared with 86% of faculty. Overall, although faculty and students are generally against the use of MP3 players in class, students are more tolerant of their use than faculty.
The most intriguing result of the survey is how much the students and faculty differed in their perceptions regarding the use of these devices in the classroom. For almost every question, student responses differed strongly from those of faculty members. In every instance in which we found a difference, students perceived electronic devices to be more appropriate, and less disruptive, than faculty members did.
Recommendations for Policy and Instructor Response to Use of Electronic Devices
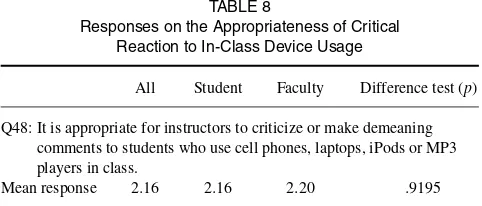
Tables 8 and 9 show our findings regarding recommenda-tions for setting an electronic device usage policy and how instructors should respond to disruptions created by such usage. Most respondents do not believe that it is appropriate for instructors to criticize or make demeaning comments about students using electronic devices in the classroom (Q48; see Table 8) with two thirds disagreeing or strongly disagreeing with the statement and a mean response of 2.16. When it comes to policy regarding electronic device usage
TABLE 8
Responses on the Appropriateness of Critical Reaction to In-Class Device Usage
All Student Faculty Difference test (p)
Q48: It is appropriate for instructors to criticize or make demeaning comments to students who use cell phones, laptops, iPods or MP3 players in class.
Mean response 2.16 2.16 2.20 .9195
TABLE 9
Recommendations for Policy and Instructor Response to Use of Electronic Devices in the Classroom
All Students Faculty
n % n % n %
Q26: Concerning the use of electronic devices in the classroom. . .(more than one answer may be chosen)
University policy should prohibit all use of electronic devices during classes unless such use is specifically required by the course instructor
129 13.3 82 9.4 47 49.5
A consistent written policy that would apply to all classes should be established by the university 166 17.1 130 14.9 36 37.9
The policy should be solely determined by the course instructor 592 61.2 537 61.5 55 57.9
The policy should be determined democratically (e.g., by a student vote) on a class-by-class basis. 219 22.6 217 24.9 2 2.1
The policy should be included on the course syllabus. 688 71.1 612 70.1 76 80.0
The policy should be discussed in class. 645 66.6 594 68.0 51 53.7
Q32: If a student’s cell phone rings during class, the instructor should. . .(more than one answer may be chosen)
Ignore it. 341 35.2 310 35.5 31 32.3
Make a joke or otherwise call attention but in a light-hearted way. 513 52.9 472 54.0 41 42.7
Discuss the interruption with the student right then. 184 19.0 160 18.3 24 25.0
Speak with the student in private after class. 465 47.9 417 47.7 465 50.0
Impose a grade-based penalty starting with the second offense. 136 14.0 121 13.8 465 15.6
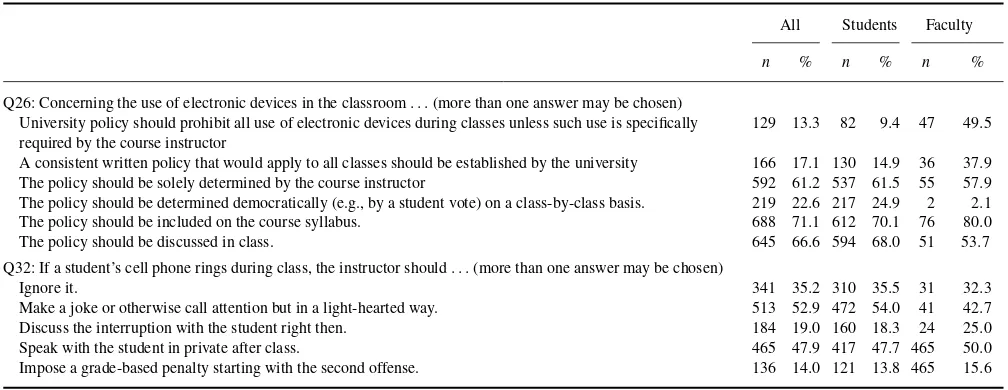
in the classroom (Q26), roughly two thirds of respondents believe the policy should be solely determined by the course instructor, included in the course syllabus, and discussed in class. Very few were in favor of a university-wide, top-down approach to policy or a democratically determined, bottom-up approach. When it comes to responding to a ringing cell phone (Q32), most respondents were in favor of speaking to the student in private after class or making a joke or other-wise calling attention to it in class but in a lighthearted way although very few were on board with a grade-based penalty. With regard to policy, faculty tends to be more bureau-cratic, indicating a preference for a university-wide policy much more frequently than students do. On the other hand, students tend to support the idea of a democratically deter-mined policy to a much greater extent than faculty do. How-ever, a policy that was determined by the instructor, included on the course syllabus, and discussed in class was favored by a majority of students and faculty. Students put equal em-phasis on class discussion of the policy and its inclusion in the syllabus whereas faculty members favored inclusion in the syllabus over class discussion. Students and faculty were broadly in agreement as to how to handle a ringing cell phone but there seemed to be some preference among students for discussing it in a joking, lighthearted way, whereas faculty were somewhat more inclined to discuss the interruption with the student right then and there.
Effect of Demographic Characteristics on Results
The effects of demographic data on the results are examined to address Research Question 3. Most of the significant differences found using demographic data were caused by differences in gender. Almost half of the questions showed differences in perceptions between male and female students. These results, which were analyzed separately for
faculty and students, are reported in Tables 10–12. However, the results are easy to sum up: male students were more in favor of electronic device usage in the classroom than were female students. For example, as shown in Table 10, male students were more prone to disagree with statements
TABLE 10
Differences in Responses to Perceptions of Cell Phone Use, by Gender
Students only All Women Men Difference test (p)
Q31: Students who let their cell phones ring or make other noises in class are being rude or disrespectful.
Mean response 4.03 4.14 3.95 .0027
Q21: Any use of cell phones in class is generally disruptive to the learning process.
Mean response 3.18 3.33 3.08 .0025
Q29: It is appropriate for instructors to prohibit the use of cell phones during an exam.
Mean response 4.45 4.52 4.40 .0296
Q35: It is okay for students to answer a cell phone call during class as long as they leave the classroom.
Mean response 3.30 3.17 3.39 .0055
Q36: Cell phones can potentially be used by some students to gain an unfair advantage on quizzes or exams.
Mean response 3.87 3.95 3.82 .0525
Q48: It is appropriate for instructors to criticize or make demeaning comments to students who use cell phones, laptops, iPods or MP3 players in class.
Mean response 2.16 2.05 2.24 .0120
Faculty only All Women Men Difference test (p)
Q48: It is appropriate for instructors to criticize or make demeaning comments to students who use cell phones, laptops, iPods or MP3 players in class.
Mean response 2.20 1.86 2.35 .0478
TABLE 11
Differences in Responses to Perceptions of Laptop Use, by Gender
Students only All Women Men Difference test (p)
Q37: Laptop computers are useful and should be permitted in the classroom.
Mean response 4.03 3.96 4.07 .0336
Q38: Laptop computers are useful and their use in class should be a required part of every course.
Mean response 2.61 2.51 2.67 .0190
Q39: The use of laptops in class creates an unfair advantage for those students who own laptops over those students who do not. Mean response 2.86 2.97 2.78 .0071
Q25: It is distracting when other students surf the web during class using a laptop computer.
Mean response 3.01 3.14 2.92 .0144
Q41: It is disruptive when other students surf the web using a laptop during class.
Mean response 3.12 3.23 3.03 .0122
Faculty only All Women Men Difference test (p)
Q25: It is distracting when other students surf the web during class using a laptop computer.
Mean response 4.32 3.90 4.52 .0173
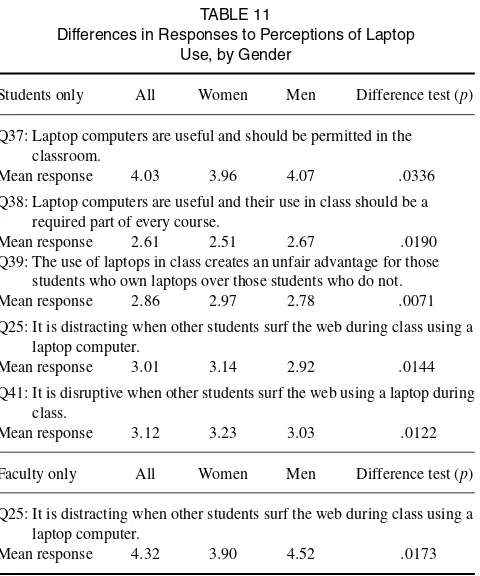
that reflect negatively on cell phone usage (Q31, Q21, Q29, Q36) and agree with statements that suggest cell phone use is appropriate (Q35). Similarly, as shown in Tables 11 and 12, male students were more likely to agree with statements that support laptop use (Q37, Q38) or use of MP3 players (Q43, Q44, Q47) and more likely to disagree with negative statements about laptop usage (Q39, Q25, Q41). The one exception, shown in Table 11, is that male students were more likely to agree that it is appropriate for instructors to criticize or make demeaning comments to students who use devices in class. This may reflect gender differences in in-terpersonal relations (i.e., men are less sensitive to criticism than women), but this is merely a conjecture on our part.
Only two of the questions showed gender differences for faculty. First, as shown in Table 10, male faculty members
TABLE 12
Differences in Responses to Perceptions of MP3 Player Use, by Gender
Students only All Women Men Difference test (p)
Q43: Students should be allowed to listen to iPods or MP3 players during class.
Mean response 1.73 1.63 1.79 .0077
Q44: Students should be allowed to listen to iPods or MP3 players during an exam or quiz.
Mean response 1.83 1.73 1.90 .0283
Q47: Instructors should allow the use of an iPod or MP3 player in class as long as the device is completely silent.
Mean response 2.16 2.04 2.24 .0090
TABLE 13
Differences in Responses to Perceptions of Laptop Use Between Undergraduate and Graduate Students
Students only All Undergraduate Graduate Difference test (p)
Q40: It is appropriate for a student to send or answer email using a laptop during class.
Mean response 2.71 2.73 2.63 .3800
Q41: It is disruptive when other students surf the web using a laptop during class.
Mean response 3.14 3.11 3.37 .0200
Q42: It is appropriate for an instructor to insist that students close or put away their laptops during class.
Mean response 3.16 3.13 3.40 .0070
were more likely to agree that it is appropriate for instructors to criticize or make demeaning comments to students who use devices in class. Second, as shown in Table 11, male faculty perceived in-class surfing the web to be more distracting than female faculty did. Interestingly, for every question other than Q48, when female student responses differed significantly from male student responses, the female student responses were closer to faculty members’ responses than were those for male students.
Because graduate students use computers in the class-room more than undergraduate students, it was suspected that graduate students’ responses would differ from under-graduate students’ for questions regarding laptop usage; this suspicion was confirmed. Interestingly, as shown in Table 13, graduate students were significantly more likely to agree that it is disruptive when other students surf the web in class (Q41) and that it is appropriate for instructors to insist stu-dents put away their laptops (Q42) and were significantly more likely to disagree with the appropriateness of using laptops to send or answer email in class (Q40) compared with undergraduates.
Other variables such as faculty rank (full, associate, assis-tant professor, or adjunct) were examined but no significant differences in perceptions were found and therefore these results are not reported.
SUMMARY AND CONCLUSIONS
Our main findings can be summarized as the following:
• In almost every instance, faculty perceptions differed from student perceptions, with students believing that use of electronic devices is more appropriate, and less disruptive, than did faculty members.
• In a large number of cases, female students’ perceptions differed from those of male students, with females finding the use of electronic devices to be more disruptive and less appropriate than did their male counterparts.
• Graduate students are less tolerant than undergraduate stu-dents of off-task usage of laptops in the classroom and are more supportive of the instructors’ right to ban laptop usage in the classroom.
We found that faculty perceptions about the appropriate-ness of electronic devices in the classroom are very different from student perceptions, making it easier to discuss points of agreement rather than disagreement. Faculty and students tend to agree that owning a laptop does not give a student an unfair advantage in the classroom and that it is inappropri-ate for instructors to criticize or make demeaning comments to students who use electronic devices in the classroom.7
For every other survey question, faculty perceptions differed from student perceptions and, in every instance where be-liefs differ, students perceived electronic devices to be more appropriate, and less disruptive, than faculty members did.
For about half of the questions, female students’ percep-tions differed from the perceppercep-tions of male students. In all such cases, women found the use of electronic devices to be more disruptive and less appropriate than did their male counterparts. Although no present theory directly addresses this gender effect, the differences offer an important avenue for future exploration, as researchers try to better understand the appropriateness of electronic devices in the classroom. This is particularly important in light of the fact that in the past decade, and for the first time in history, more women than men are attending college. In addition, graduate students are less tolerant than undergraduate students of off-task us-age of laptops in the classroom and are more supportive of the instructors’ right to ban laptop usage in the classroom.
Although this study only examined perceptions, it is apparent that strong behavioral differences exist between students and faculty. This dichotomy suggests that Bugeja (2007) is correct: Some faculty members already are—and should be—addressing the use of electronic devices in the classroom in their syllabi. Indeed, at many universities, administrators are presently contemplating the creation of university-wide policies regarding the use of electronic de-vices in the classroom. This research may be useful as a guide in setting those policies. Given that student and faculty perceptions differ strongly, and that there is no indication of whose perceptions are better, this research suggests that administrators should consider and attempt to reconcile the opinions of students and faculty before creating electronic device usage policies for the classroom.
In conclusion, we believe that the baby-boomer professors of today must find a way to peacefully coexist with their mil-lennial students who have fully embraced the technologies that boomers created for them. Therefore, it is incumbent on instructors, and designers of the classroom environment, to adapt to these technologies in so far as possible and to de-liver courses in a way that reflects these oftentimes conflicting views concerning the use and usefulness of these technolo-gies. The information gleaned from this study should be
ben-eficial as we begin, or in some cases continue, our journey in this direction.
NOTES
1. Although there is no precise definition of the term mil-lennials, it typically refers to persons born in the early 1980s or later and therefore roughly corresponds to anyone who is presently under 30 years old. This constitutes the majority of today’s college students. However, the termdigital nativeis probably better reserved for the under-25 age group because Internet and cell phone usage actually became widespread in the mid- to late 1990s and early 2000s, respectively.
2. Faculty members were instructed to stop after the first 49 questions.
3. The survey instrument and additional details regarding the survey methods and testing are available from the authors upon request. The range of the standard deviations for all 5-point Likert scale responses was 0.8023 to 1.2260. The unweighted mean of the standard deviations was 0.9951, and the standard deviation of the standard deviations was 0.0936. A complete listing of the standard deviations for each response reported in the tables is available upon request.
4. Participation rates were over 95% in every class sur-veyed.
5. For the three schools used in our survey, approximately 80%, 70%, and 72%, of the business school faculty were men at the New York, North Carolina, and Texas schools, respectively. Because the North Carolina faculty was by far the largest, the corresponding figure was 72% male faculty for the three schools combined.
6. Again, we note that the responses are very consistent across these two similar questions, which were placed two pages apart in the survey, giving us confidence in the validity of our results.
7. For students and faculty, women believe more strongly than men that such comments are inappropriate.
REFERENCES
American Accounting Association. (1960). Report of the Committee on the Scope of the Four Year Accounting Major: Trends in undergraduate accounting education.The Accounting Review,35, 203–205.
Bauman, A. M. (2009). Millennial student-parent communication patterns and first-year college success. Master’s thesis, University of Central Mis-souri, Warrensburg, MO.
Braguglia, K. H. (2008). Cellular telephone use: A survey of college of business students.Journal of Teaching & Learning,5(4), 55–61. Brown, D. G., Burg, J. J., & Dominick, J. L. (1998). A strategic plan for
ubiquitous laptop computing.Communications of the ACM,41(1), 26–35. Brown, D. G., & Petitto, K. R. 2003. The status of ubiquitous computing.
EDUCAUSE Review,38(3), 25–33.
Bugeja, M. (2007). Distractions in the wireless classroom.Chronicle of
Higher Education,53(21), C1–C4.