3D MODELLING AND ACCURACY ASSESSMENT OF GRANITE QUARRY USING
UNMMANNED AERIAL VEHICLE
Diego González-Aguileraa*, Jesus Fernández-Hernándeza, Juan Mancera-Taboadaa, Pablo Rodríguez-Gonzálveza, David Hernández-Lópezb, Beatriz Felipe-Garcíab, Irene Gozalo-Sanza and Benjamin Arias-Pereza
a
Department of Cartographic and Land Engineering; High School of Ávila, University of Salamanca, Hornos
Caleros, 50, 05003, Ávila (Spain) - (daguilera, j.f.h, juaniyoperote, pablorgsf, irenegs, benja)@usal.es
bRegional Development Institute-IDR, University of Castilla-La Mancha, Albacete, 02071, Spain - (david.hernandez,
beatriz.felipe)@uclm.es
Commission III, WG III/1
KEY WORDS: UAV, Photogrammetry, 3D Modelling, Accuracy Assessment, Terrestrial laser scanner, Surveying Engineering,
Computer vision, Image analysis.
ABSTRACT:
The unmanned aerial vehicles (UAVs) are automated systems whose main characteristic is that can be remotely piloted. This property is especially interesting in those civil engineering works in which the accuracy of the model is not reachable by common aerial or satellite systems, there is a difficult accessibility to the infrastructure due to location and geometry aspects, and the economic resources are limited. This paper aims to show the research, development and application of a UAV that will generate geo-referenced spatial information at low cost, high quality, and high availability. In particular, a 3D modelling and accuracy assessment of granite quarry using UAV is applied. With regard to the image-based modelling pipeline, an automatic approach supported by open source tools is performed. The process encloses the well-known image-based modelling steps: calibration, extraction and matching of features; relative and absolute orientation of images and point cloud and surface generation. Beside this, an assessment of the final model accuracy is carried out by means of terrestrial laser scanner (TLS), imaging total station (ITS) and global navigation satellite system (GNSS) in order to ensure its validity. This step follows a twofold approach: (i) firstly, using singular check points to provide a dimensional control of the model and (ii) secondly, analyzing the level of agreement between the reality-based 3D model obtained from UAV and the generated with TLS. The main goal is to establish and validate an image-reality-based modelling workflow using UAV technology which can be applied in the surveying and monitoring of different quarries.
1. INTRODUCTION
1.1 Motivation
Surveying and photogrammetry, as remote non-invasive techniques, acquire every day more important role in mining exploitation. However, these techniques and their application must adapt to the pace with which mining modifies the environment which sits. Although the surveying is consolidated as a technique with an application to the metric analysis and monitoring of this type of strip mining, some of the barriers facing the surveying are difficult to resolve due to the time constraints and that condition other later works, which in turn are vital to the operation of the mine. For its part, the application of UAV photogrammetry, represents an appropriate and effective solution if one takes into account the availability and frequency required in the exploitation of this type of deposits. Derive from the images geomatic products with metric properties enable aspire to its dimensional analysis and monitoring, as well as the restoration of affected areas. The cubage of a deposit is essential to establish its numerical volume of exploitable material and can thus estimate the economic value of their reserves, allowing decision making with regard to its economical viability, as well as the design and control of restored surfaces in the stages prior to exploitation. The spatial and temporal resolution obtained from the acquired UAV images together with the automation level achieved by open source tools, allow us to aspire to high quality, immediate and low-cost geomatic products.
1.2 Brief state of art: applicability of UAV technology
With the arrival of UAV technology, one of the most remarkable consequences has been the growing popularity and socialization of photogrammetry. The increasing possibility of developing low-cost systems and/or systems available to any user is the main advantage of this technology. Nowadays, the use of UAV photogrammetry, allow obtaining aerial images to derive competitive geomatics products in different application fields. Some of these applications have been addressed in the international scientific community with a wide potential (Wong et al., 2007). The production of large scale topographic mapping for documentation of archaeological deposits (Baratin et al, 1991; Doneus, 1996; Grussenmeyer and Perdrizet, 1996; Jachimsky and Zielinski, 1996), where the prevalence of a high point of view is fundamental to perform restitution. The production of thematic mapping for the environmental control (Colomina et al., 2008) and agroforestry (Berni et al., 2009). On the other hand, there are several applications in which the geo-referenced spatial information has a secondary role. For instance, Paul et al., (2008) use UAV equipped with pesticides and fertilizers to perform the treatment of farm fields; Davidson et al., (2003) apply UAV technology to carry out tasks related with the weather prediction; Tallec (2002) incorporates UAV to the monitoring and surveillance of traffic; and last but not least, Peña et al., (2009) use the UAV as antennas and mobile platforms specially useful in areas that have suffered a disaster and need to establish emergency communication protocols.
Within the field of photogrammetry we can find applications such as 3D reconstruction (Pueschel et al., 2008) or the cubage of structural or natural elements.
This paper is organized as follows: after this introduction, section 2 describes the area of study; the image-based modelling pipeline including the flight planning and UAV platform are described in detail in section 3; section 4 outlines the approach proposed to assess the accuracy of the workflow; section 5 presents a real case study that was analyzed and tested to validate the proposed approach; and finally, we present concluding remarks in section 6.
2. AREA OF STUDY
The quarry is located in the VI national road km 82 in Villacastin, Segovia, Spain. It is a strip mining in the shape of a cube located on a hillside in the South of Villacastin (Figure 1).
Figure 1. Panoramic view of the quarry
With regard to its geological content, the materials of the quarry are grouped into two large and different sets. One consisting of igneous and metamorphic rocks belonging to the Variscan Massif of Precambrian-Palaeozoic age, and the other by the Mesozoic, Tertiary and Quaternary sediments corresponding to the southern edge of the Duero basin. The area of the site is an area where the granite stonework has great tradition. The area of study and its surroundings cover a surface of approximately 22.8 Km2, with a rock of good quality at few meters of the surface, with large reserves on which two active quarries are located and several inactive or abandoned. These reserves are settled over grey coloured biotitic adamellite with medium grain sizes and granulated texture, in which no facies changes are observed. Homogeneity is high with only sporadic boulder of small size. The weathering affects only to the first centimetres, giving a very healthy look to the rock. The joints are scarce and orthogonal, allowing the extraction of blocks of large size, about 3x2x2 m on average.
3. IMAGE-BASED MODELLING PIPELINE
3.1 Flight planning and UAV platform
The flight planning of UAVs plays an essential role in providing quality images and thus quality geomatic products. To this end, several geometric constraints associated with aerial photogrammetric applications (McGlone, 2004) need to be guaranteed. In our case, the problem of photogrammetric flight planning has led to automatic problem solving the following flight maneuvers and photogrammetric geometric constraints:
Management of camera position and attitude.
Working with different consumer-grade digital cameras.
Geo-referencing between different coordinate reference systems and different geoid models.
Design of photogrammetric blocks.
Determination of strip connections and overlap.
The guarantee of a constant and real scale through the computation of an optimal ground sample distance (GSD).
Control of additional flight parameters.
The aerial platform used is the Oktokopter (Mikrokopter, 2011), a rotary-wing electric powered system purpose designed for aerial photography (Figure 2).
Figure 2. UAV platform: oktokopter.
3.2 Camera calibration
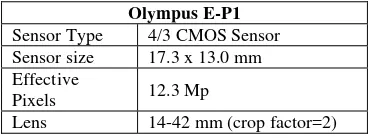
A proper calibration of the camera is the key in order to achieve good quality measurements. The camera, Olympus E-P1 (Table 2), was calibrated using the photogrammetric software Photomodeler. This process is based on a self-calibrating bundle adjustment. The calibration results and other camera parameters are shown in Table 3.
Olympus E-P1
Sensor Type 4/3 CMOS Sensor Sensor size 17.3 x 13.0 mm Effective
Pixels 12.3 Mp
Lens 14-42 mm (crop factor=2)
Table 2. Olympus E-P1: technical specifications.
Value Std. Dev.
Focal length (mm) f 13.877 ±0.002
Principal point (mm)
(x,y)
P (8.677 , 6.555) ±0.002 Sensor format
(mm) (f,h) (17.222 , 12.914) ±0.002
K1 2.156 x10⁻⁴ ±4.3 x10⁻⁶ Radial
distortion K2 4.191 x10⁻⁷ ±7.4 x10⁻⁸ P1 -5.403 x10⁻⁵ ±3.1 x10⁻⁶ Tangential
distortion P2 6.812 x10⁻⁵ ±3.6 x10⁻⁶
Table 3. Olympus E-P1: Camera calibration parameters
3.3 Images orientation
The aerial images were oriented with the open source software VisualSFM (Wu, 2011). This software is based on the approach known as structure from motion (SfM). The extraction and
matching of features were carried out with the SIFT detector (Lowe, 1999), since its performance is invariant with affine image transformation and illumination changes. Specifically, SIFT algorithm was applied through the algorithm SiftGPU (Wu, 2007), which is a GPU implementation of the original SIFT detector. Subsequently, the external image parameters were solved by a block adjustment, supported by a RANSAC robust estimator (Fischler and Bolles, 1981). As a result, a sparse point cloud together with the camera parameters is obtained. In order to densify the point cloud and obtain a detailed 3D point cloud, PMVS2 software (Furukawa and Ponce, 2007) was used. The workflow can be completed with the generation of a surface model through a Delaunay triangulation algorithm (Bourke, 1989) and later its texturization by the projection of the radiometric texture coming from the aerial images over the triangulated model, once the camera parameters are known.
4. ACCURACY ASSESSMENT
4.1 Network design
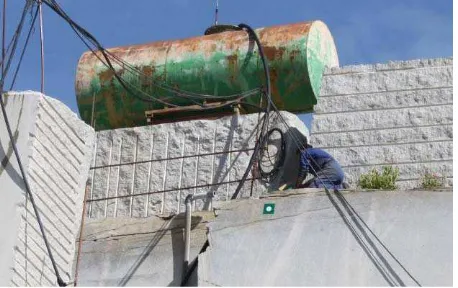
To carry out the accuracy assessment the design of a reference network based on ground control points (GCP) and ground check points (GCHP) is mandatory. Given the shape and size of the quarry two different types of signals were used to identify GCP: artificial targets and paint marks. The reason for both types is based on its distribution and the different sensor used to collect data. In the case of TLS, we used targets since the laser system allows us their automatic and accurate extraction. Since the best extraction of these targets is obtained with orthogonal scans, these targets are located in the vertical walls of the quarry (Figure 3). In the case of GNSS, red cross marks painted on the ground were used as GCP and GCHP since vertical walls provide partial satellite occlusion and multipath effects.
Figure 3. Artificial target located in the vertical wall of the quarry
In relation to the equipment used, different terrestrial sensors were applied. A time-of-flight TLS, Trimble GX, was used as “ground truth” since provide a high precision (=1.5mm@ 50m). A dual-frequency GNSS device, Trimble R6, based on NAVSTAR and GLONASS and operating in virtual reference station (VRS), was used to provide a global georeferencing. The expected precisions are of 10mm±0.1ppm and 20mm±0.1ppm for horizontal and vertical coordinates, respectively.
In order to integrate the GCP and GCHP acquired with both sensors (TLS and GNSS) under a common coordinate system, a
imaging total station (ITS), Trimble VX, was used. The precision for 3D point surveying without prism is 10 mm.
4.2 Georeferencing
Four coordinate systems have been considered in the georeferencing: one arbitrary coordinate system (in scale, position and attitude) corresponding to the UAV; two local coordinate systems corresponding to TLS and ITS with metric properties; one global and oriented coordinate system (GNSS), in our case expressed in the ETRS 89 reference system and the cartographic projection UTM30N.
The georeferencing between the different coordinate system was performed through a three-dimensional solid-rigid (or Euclidean) transformation as follows,
11 12 13 X
where the coordinates of the initial system (x, y, z) are transformed to the final coordinates system (x`, y`, z`) by means of a translation (TX,TY,TZ) and a rotation matrix (rij). The points for the transformation (GCP and GCHP) are selected manually by the operator.
For the georeferecing of models in coordinate systems with a different scale, a factor scale, parameter is mandatory, so that a Helmert 3D transformation is applied adding scale parameter to the equation 1.
The 7 Helmert parameters can be extended to a 10 transformation parameters known as Badekas-Molodensky (Badekas, 1969) in order to solve the transformation between the geocentric GNSS coordinate system and the ITS local system. Finally, the orthometric altitudes were referenced to mean sea level based on a high-precision leveling network (REDNAP) using a geodetic model (EGM08).
4.3 Assessment of final accuracy
The assessment of final accuracy is carried out by analyzing the level of agreement between the reality-based 3D model obtained from the UAV and the generated 3D model with the TLS which performs as ground truth. To this end, a point to point comparison is done with the CloudCompare open source software. Since both dataset contain a different resolution (3.1 millions of points for TLS and 19.5 millions of points for UAV), an effective comparison is performed based on the closest point set, avoiding the presence of holes as well as remote points. The result of the accuracy assessment was obtained by means of Euclidean distance error, d, as follows,
(2)
where a and b represent the UAV and TLS point cloud, respectively, being n the number of points. R and t contain the
rotation matrix and the translation vector, while the scale factor was not required since both dataset were transformed through the previous georeferencing.
Alternatively to the closest point set computation and based on the existence of planar elements, the point-plane distance can be used as an alternative for accuracy assessment. This comparison
n
was reinforced with the mean error, root mean square error and standard deviation of the distance error (Table 4), as well as some error graphics and histograms.
Mean error
Root mean square error
n
Standard deviation n 2
d
Table 4. Accuracy measures for DEMs presenting normal distribution of errors.
5. RESULTS
5.1. Flight planning
Due the shape and size of the quarry, the flight planned consisted on two different flights: (i) a vertical flight based on stereoscopic images; (ii) a convergent flight rounding the quarry and acquiring oblique images. Specifically 2 strips with 10 images per strip were acquired for the first flight with a flight height of 60 m, while 40 oblique images were recorded in the convergent flight in 2 strips, with two different flight height of 10 and 20 m. Several targets and special signals were distributed over the entire area of interest, both in plan and elevation. The arrangement of the targets was justified by the aim to establish, before taking any data, a single system of reference between the data collected by the UAV, TLS and the ITS. The target size was carefully chosen for a flight of 60m. The different stations, as well as the start and end points of the UAV were conditioned by the shape and size of the quarry and the presence of heavy machinery in motion. The acquisition of UAV images was performed by a second operator using a remote shooting system with the aid of video glasses. The coordination between pilot and operator must be effective to obtain good quality images. As a result, a total of 80 photographs with an overlap of 70% were obtained.
5.2 Georeferencing
The georeferencing of all models in a global reference system was resolved following a twofold approach: (i) first, transforming TLS and UAV models in a local frame defined by the ITS; (ii) second, passing from the local reference frame defined by ITS to the global frame defined by GNSS.
With regard to the first step, a solid-rigid transformation was established between the TLS and ITS coordinate frames (Table 5), while a Helmert 3D transformation was required between the UAV and ITS coordinate frames (Table 6).
Parameters Value Std. dev.
TX (m) 994.819 0.002
Table 5. Solid-rigid transformation parameters between TLS and ITS.
In relation with the first transformation, a final georeferencing error of 11mm using 12 points was obtained. This error can be considered coherent and consistent taking into account the a priori deviation of both instruments. Specifically, an a priori deviation of 4.9 mm could be considered for the TLS, based on the quadratic composition of the angular (horizontal: 60rad; vertical: 70rad), distance (1.4mm@50m) and divergence (3mm@50m) errors for an average scan distance of 50 m. For its part, the ITS provides an a priori standard deviation of 3 mm.
Afterwards, the UAV model was transformed to the local ITS coordinate frame using 6 points. Since the UAV coordinate system was established arbitrarily, a Helmert 3D model was applied in order to solve the scale factor.
Parameters Value Std. dev.
TX (m) 1026.684 0.036
Table 6. Helmert 3D transformation parameters between UAV and ITS.
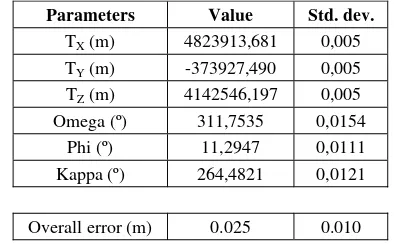
The overall error of 3 cm obtained in the georeferencing between UAV and ITS could be explained based on the following factors: (i) the resolution of UAV images which were acquired with a GSD of 1.8 cm; (ii) the use of paint marks (red cross) which provided uncertainty in their centre location. The transformation between local (ITS) and global (GNSS) coordinate systems was resolved again by a Molodensky transformation using a total of 6 points (Table 7).
Parameters Value Std. dev.
TX (m) 4823913,681 0,005
Table 7. Badekas-Molodensky transformation parameters between ITS and GNSS with fixed scale factor.
An overall error of 25 mm was obtained in the georeferencing. This error is coherent with the precision of the GNSS device operating in VRS.
5.3 Image-based modelling
The results derived from UAV images orientation provided a point cloud of 19.526.207 points, which were triangulated and renderized with photorealistic texture (Figure 4).
Figure 4. Photorealistic 3D model of the quarry.
5.4 Accuracy assessment
The accuracy assessment between 3D models was done by the software CloudCompare providing different results depending on the distance computation employed (Table 6): (i) The closest point to point distance; (ii) the distance from point to plane which has been fitted by least square method.
Method Mean Std. dev. Median
Closest point 4.68cm 3.84cm 3.46cm
Point-plane distance 3.35cm 3.58cm 2.10cm
Table 6. Accuracy assessment results using the ITS local coordinate system and based on distance comparison method.
The results outlined above show the accuracy of the UAV model in comparison with the TLS model, which performed as ground truth (Table 6). Besides this, these results were reinforced by the histogram of the error distribution (Figure 5):
Figure 5. Histogram of relative accuracy in the ITS coordinate system.
Besides this, the error distribution was illustrated by an error mapping of distances taking the TLS point cloud as ground truth (Figure 6):
Figure 6. Error mapping of distances taking the TLS point cloud as ground truth.
The accuracy assessment results depicted in Table 7 are based on the comparison between the UAV model and the TLS model, which performed as ground truth.
Method Mean Std. dev. Median
Closest point 4.57cm 4.50cm 3.22cm
Point-plane distance 2.96cm 4.13cm 1.31cm
Table 7. Accuracy assessment results using the GNSS global coordinate system and based on distance comparison method.
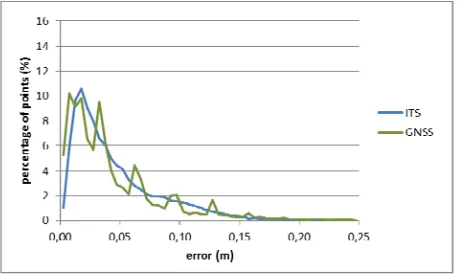
In Figure 7 are showed a comparison of the error histogram for the UAV models in two different coordinate systems: local (ITS) and global (GNSS).
Figure 7. Relative accuracy histogram of the closest point distance error for both coordinate frames (ITS ans GNSS).
6. CONCLUSIONS
Based on the results obtained, we can assert that the UAV technology is an effective and economic method in comparison with other remote sensing techniques such as: classical surveying and the laser scanning, guarantying imagery with improvements in spatial and temporal resolutions. In relation to the accuracy assessment, even though the image-based modelling workflow requires applying several steps sequentially in order to obtain a real-based 3D model and thus error propagation must be mandatory, the level of accuracy reached is good enough. It should be pointed out that the analysis of accuracy assessment was carried out using a dense dataset (more than 3 millions of points), while other approaches usually consider only singular points or artificial targets. The key to success lies on the image-based modelling pipeline developed which guarantees automatism and quality in the
results, as well as the own aerial platform and its flight planning, which provides great stability and robustness.
6.1 References
Badekas, J., 1969. Investigations related to the establishment of a world geodetic system, Report 124, Department of Geodetic Science, Ohio State University.
Baratin, L., Di Thiene, C., Guerra, F. 1990. Photogrammetric system and cost analysis for architectural and archaeological surveys. In: ISPRS Commission V Symposium, Close-Range Photogrammetry Meets Machine Vision Conference, Zurich, SPIE Volume 1395, pp. 51-58.
Berni, J., Zarco-Tejada, P.J., Suarez, L., Fereres, E., 2009. Thermal and Narrowband Multispectral Remote Sensing for Vegetation Monitoring From an Unmanned Aerial Vehicle. IEEE Transactions on Geoscience and Remote Sensing, 47 (3), pp. 722-738.
Colomina, I., Blázquez, M., Molina, P., Parés, M., Wis, M., 2008. Towards a New Paradigm for high-resolution low-cost Photogrammetry and Remote Sensing. In: The International Archives of the Photogrammetry, Remote Sensing and Spatial Information Sciences, Beijing, China, Vol XXXVII, Part B1, pp. 1201-1206.
Davidson, K., Kaminer, I., Miller, D., Dobrokhodov, V., 2003. Demonstration of Linked UAV Observations and Atmospheric Model Predictions in Chem/Bio Attack Response. Naval postgraduate school, Monterey, California.
Doneus, M., 1996. Photogrammetrical Applications to Aerial Archaeology at the Institute for Prehistory of the University of Vienna, Austria. In: The International Archives of the Photogrammetry, Remote Sensing and Spatial Information Sciences, Vienna, Vol XXXI, Part B5, pp. 124-129.
Fischler, M.A., Bolles, R.C., 1981. Random sample consensus: a paradigm for model fitting with applications to image analysis and automated cartography. Communications of the ACM, 24(6), pp.381-395.
Furukawa, Y., Ponce, J., 2007. Accurate, Dense, and Robust Multi-View Stereopsis, Computer Vision and Pattern Recognition (CVPR '07), Minneapolis, USA, pp. 1-8.
Girardeau-Montaut, D. 2012. CloudCompare (version 2.3) [GPL software]. EDF R&D, Telecom ParisTech.
http://www.danielgm.net/cc/ (10 Jan. 2012)
Grussenmayer, P., Perdrizet, F., 1996. Archaeological Photogrammetry with Small Format Cameras: The Survey of the Forum Vetus of Sarmizegetusa (Romania). In: The International Archives of the Photogrammetry, Remote Sensing and Spatial Information Sciences, Vienna, Vol. XXXI, Part B5, pp. 200-204.
Jachimski, J., Zielinski, M., 1996. Digital stereoplotter for historic monuments recording. In: The International Archives of the Photogrammetry, Remote Sensing and Spatial Information Sciences, Vienna, Vol XXXI, Part B5, pp. 259-263.
Lowe, D., 1999. Object recognition from local scale-invariant features, International Conference on Computer Vision. IEEE Computer Society, Corfu, Greece, pp. 1150-1157.
McGlone, J.C., 2004. Manual of Photogrammetry. American Society for Photogrammetry and Remote Sensing, 5th Ed., Bethesda, Maryland.
Mikrokopter, 2011. http://www.mikrokopter.de/ucwiki/ (10 Jan. 2012)
Paul, T., Krogstad, T.R., Gravdahl, J.T., 2008. Modelling of UAV formation flight using 3D potential field. Simulation Modelling Practice and Theory, 16(9), pp.1453-1462.
Peña, N., Scarlatti, D., Ollero, A., 2009. UAVs Integration in the SWIM Based Architecture for ATM. Journal of Intelligent & Robotic Systems, 54 (1), pp.39-59.
Pueschel, H., Sauerbier, M., Eisenbeiss, H., 2008. A 3D model of Castle Landemberg (CH) from combined photogrammetric processing of terrestrial and UAV-based images. In: The International Archives of the Photogrammetry, Remote Sensing and Spatial Information Sciences, Beijing, China, Vol. XXXVII, Part B6-b, pp. 96-98.
Tallec, C., 2002. VFR general aviation aircraft and UAV flights deconfliction. Aerospace Science and Technology, 9 (6), 495-503.
Wu, C., Agarwal, S., Curless, B., Seitz, S., 2011. "Multicore Bundle Adjustment", 24th IEEE Conference on Computer Vision and Pattern Recognition. Colorado Springs, USA. June 20-25.
Wong, K.C., Bil, C., Gordon, D., Gibbens, P.W. 2007. Study of the Unmanned Aerial Vehicle (UAV) Market in Australia. Aerospace Technology Forum Report.
Wu, C., 2007. "SiftGPU: A GPU implementation of Scale Invaraint Feature Transform (SIFT)",
http://cs.unc.edu/~ccwu/siftgpu (10 Jan. 2012)
Acknowledgements
The authors would like to thanks the owners of the quarry “Hermanos Prados Quemada, S.L.” where field work was carried on. Likewise, the authors gratefully acknowledge the assistance provided by the master student Elixabete Alcocer during the data campaign. This research has been supported by the Ministerio de Ciencia e Innovación (Gobierno de España) and the Junta de Castilla y León through the National Research Projects BIA2010-15145 and the Autonomic Project SA063A11-2.