SENSORS FOR TEMPERATURE
MEASUREMENT:
ERROR MEASUREMENT
OF TYPE K THERMOCOUPLE
MAULANA BIN HANAPI
LA Y,
N ý M Pº
(ý) QC 271 M447 2002Universiti
Malaysia
Sarawak
2002
! 1{Vtýý i -ýý
SENSORS FOR TEMPERATURE MEASUREMENT: ERROR
MEASUREMENT OF TYPE K THERMOCOUPLE
MAULANA BIN HANAPI
This report submitted in partial fulfilment of the requirement for the degree of Bachelor of Engineering (Hons. ) Mechanical Engineering and Manufacturing
System from the faculty of Engineering
Universiti Malaysia Sarawak
2002
It
BORANG PENYERAHAN TESIS
Judul: SENSORS FOR TEMPERATURE MEASUREMENT : ERROR MEASUREMENT OF TYPE K THERMOCOUPLE
SESI PENGAJIAN: 1999 / 2002
Saya MAULANA BIN HANAPI
mengaku membenarkan tesis ini disimpan di Pusat Khidmat Maklumat Akademik, Universiti Malaysia Sarawak dengan syarat-syarat kegunaan seperti berikut:
1. Hakmilik kertas projek adalah di bawah nama penulis melainkan penulisan sebagai projek bersama dan dibiayai oleh UNIMAS, hakmiliknya adalah kepunyaan UNIMAS.
2. Naskhah salinan di dalam bentuk kertas atau mikro hanya boleh dibuat dengan kebenaran hertulis daripada penulis.
3. Pusat Khidmat Maklumat Akademik, UNIMAS dibenarkan membuat salinan untuk pengajian mereka.
4. Kertas projek hanya boleh diterbitkan dengan kebenaran penulis. Bayaran royalti adalah mengikut kadar yang dipersetujui kelak.
5. * Saya membenarkan/tidak membenarkan Perpustakaan membuat salinan kertas projek ini sehagai bahan pertukaran di antara institusi pengajian tinggi.
6. *'" Sila tandakan ( ti/ )
F7
i
a
SULIT (Mengandungi maklumat yang berdarjah keselamatan atau kepentingan Malaysia seperti yang termaktub di dalam AKTA RAHSIA RASMI 1972).
TERHAD (Mengandungi maklumat TERHAD yang telah ditentukan oleh organisasi/ badan di mana penyelidikan dijalankan).
TIDAK TERHAD
Disahkan oleh
rvvshl
4(TANDATANGAN PENULIS) (TANDATAN(IANPENYELIA)
Alamat tetap: l. o 570. Lrg Sentosa Timur 3A t Nama Penyelia: Rubi .
vah Hi Baini Kpg. Usaha Jaya Baru
96000. Sibu Sarawak
Tarikh: ý Lo 4 34 4 L Tarikh: T)bf 1^7 QÜ7.
CATATAN * Potong yang tidak berkenaan.
** Jika Kertas Projek itd SULIT atau TERHAD, sila lampirkan surat daripada pibak berkuasa/ organisasi berkenaan dengan menyertakan sekali tempoh kertas projek. Ini perlu dikelaskan sebagai SULIT atau TERHAD.
This project report entitled " SENSORS FOR TEMPERATURE MEASUREMENT:
ERROR MEASUREMENT OF TYPE K THERMOCOUPLE " was prepared by
Maulana b. Hanapi as a partial fulfillment of the requirements for the Bachelor of Engineering (Hons. ) in Mechanical Engineering & Manufacturing System, is hereby read and approved by,
8'oý2:
e z.
Rubiyah Hj. Baini
Date
(Supervisor)
To APAK & MAK and
to
all
say colleagues
and
staffs
of
Engineering
Faculty.
ACKNOWLEDGEMENT
The author would like to express his sincere thanks and deep appreciation to Mrs. Rubiyah Hj. Baini for her guidance and encouragement throughout the duration of this project. Indeed, her support played a vital role in the completion of this project.
Extended thanks to Mr. John Button (Senior Customer Support Engineer of Armfield) for
most valuable information and friendship.
The author would also like to acknowledge all those who have contributed their help in
ABSTRAK
Thermocouple adalah sejenis sensor yang digunakan untuk mengira suhu berdasarkan prinsipalnya yang mana apabila dua logam yang berbeza dicantumkan, perubahan arus elektrik akan berlaku jika terdapat perubahan suhu diantara dua bahagian cantuman iaitu cantuman rujukan dan cantuman pengesan. Projek ini adalah tentang thermocouple jenis K yang digunakan dalam alat Penentu Suhu yang terdapat di dalam lab mekanikal di UNIMAS. Alat Penentu Suhu ini juga dikenali sebagai THI. Objektif utama projek ini adalah untuk mengira ralat yang berlaku di dalam thermocouple jenis K untuk alat THI. Terdapat dua ralat yang akan dibuat iaitu ralat untuk bacaan yang diperoleh melalui eksperimen dan ralat untuk bacaan yang telah dilinearkan. Ralat-ralat ini akan dibandingkan dengan ralat yang telah dispesifikasikan pembuat model TH I.
ABSTRACT
Thermocouple is a type of sensors to measure temperature. It is based on the principle that when two dissimilar metals are joined, a predictable voltage will be generated in accordance to the difference in temperature between the measuring junction and the reference junction. This project is about the type K thermocouple used in Temperature Measurement equipment that is available at UNIMAS' Mechanical Engineering laboratory. The equipment is named THI. The main objective of this project is to determine the error range occurs in type K thermocouple used in THI. The error range will consist of error range based on experimental and linearized results. These errors will then to be compared to the manufacturer's specification.
a.
CONTENTS
APPROVAL
DEDICATION
ACKNOWLEDGEMENTS
ABSTRAK
ABSTRACT
CONTENTS
LIST OF FIGURES
LIST OF TABLES
LIST OF GRAPHS
CHAPTER 1: INTRODUCTION
1.1 GENERAL OVERVIEW
1.2 SENSORS
1.2.1 Definition
1.2.2 Forms of Sensor Outputs
(I)
(II)
(III)
Analog Signal
Digital Signal
Carrier Signal
1.3 MEASUREMENT SYSTEMS 1.3.1 Overview1.3.2 Basic Electronic Measuring System
1.3.3 Signal Conditioning
(I)
Data Sampling
PUSat KPljCjn at MßK1Unt*t AK2ae i UNIVERSITI MALAYSIA SARAV AK
94300 Kota Sa: rarohan
i
ii itl IV V vi ix X X3
3
4
4
5
6
7
ß IQ VI(II)
Data Conversion
1.4 EFFICIENT DATA ACQUISITION
1.5 OBJECTIVES
CHAPTER 2: LITERATURE REVIEW
2.1 TEMPERATURE MEASUREMENT
2.1.1 Review
(I) Definition of Temperature (II) Temperature Sensors 2.2 THERMOCOUPLES 2.2.1 General Review 2.2.2 Thermometric Laws 2.2.3 Thermocouples Materials 2.2.4 Thermocouple Selection 2.3 EQUIPMENT DESCRIPTION 2.3.1 General Review
2.3.2 Type K Thermocouple
CHAPTER 3: METHODOLOGY
3.1 CONSIDERATION 3.1.1 Safety3.1.2 Apparatus Accuracy
3.1.3 Apparatus Maintenance
3.2 EXPERIMENTATION
3.2.1 Objective
3.2.2 Experiment Consideration
lI 13 1617
17
18
19
21
21
23
25
26
28
28
29
30
30
31
31
32
32
33
vii(I) Equipment Set Up 34 (II) Procedure 35 (III) Results 35
CHAPTER 4: RESULTS
4.1 REFERENCE TABLE 38 4.2 EXPERIMENTAL RESULT 394.3 GRAPH Vactuai vs. T,,, AND Ve vs. T. 41
4.4 OFFSET LINEAR APPROXIMATION 43
CHAPTER 5: DISCUSSION
5.1 ERROR DURING DATA ACQUISITION
45
5.2 APPROXIMATION EQUATION
45
5.2.1 Linear Approximation Equation
45
5.2.2 Offset Approximation Equation
46
5.3 ERROR IN TYPE K THERMOCOUPLE
49
CHAPTER 6: CONCLUSION AND RECOMMENDATIONS
6.1 CONCLUSION
6.2 RECOMMENDATIONS
52
53
BIBLIOGRAPHY
54
YlYiLIST OF FIGURES
Figure 1.1:
An analog signal of the outside air temperature.
Figure 1.2: Figure 1.3: Figure 1.4: Figure 1.5: Figure 2.1: Figure 2.2: Figure 2.3: Figure 2.4: Figure 2.5:
A digital signal of the outside air temperature
Basic electronic measuring system
" Measuring Transmitter
Frequency spectrum an analog signal
Simple thermocouple circuit
Seebeck Effect
5
9
II
22
23
Circuits illustrating the law of intermediate temperatures 24
Basic thermocouple properties 25
Temperature Measurement (THI) Equipment 28
Figure 2.6:
TH 1: Schematic diagram of hypsori terfieated water bath
29
LIST OF TABLES
Table 4. I : Type-K Thermocouple Reference Data 38
Table 4.2: Type-K Thermocouple Experimental Data of 39
Emf Value at Every 5°C Increments from 0 to 50°C
Table 4.3: Comparison Between Actual and Experimental Data 40
Table 4.4: Type K Reference Data 40
Table 4.5: Experimental Data For One-Sixth and Five-Sixth of 50°C 43 Table 5. 1: Comparison of calculated, actual and experimental results 49 Table 5.2: Differences of Error between experimental and linearized 50
data with actual data.
Table 5.3: Range of Error 51
LIST OF GRAPHS
Graph 4.1: Type K Thermocouple Characteristic Vartua, vs. T,,, and 41 Linear Approximation
Graph 4.2: V, vs. T,,,
42
Graph 4.3:
Solid - Line Linear Approximation That Reduced by
44/47
The Added of Offset Value
CHAPTER 1
INTRODUCTION
1.1
GENERAL OVERVIEW
Electronic measurements have become a part of everyday life. Sensors and transducer are the eyes and ears of modern measurement instrumentation and control systems. Many types of machines depend on sensors to provide input data about environment. Carr (1993) claimed that sensors represent both one of the oldest segments of the electronic industry and one of the most modern.
Sensors of all types provide the computer with the information it needs to perform monitoring and control tasks. Development in the use of laser and microelectronics sensors make possible the rapid measurement of physical properties that were previously difficult to measure.
A digital computer requires an input of signals in digital form. However, the plant
being controlled has signals that vary continuously with time, i. e. are analogues
signal. The analog and continuous time signals measured by the sensor and
modified by the signal conditioning circuitry must converted into the form a
computer can understand. This is what
is referred to here as data acquisition.
CHAPTER I INTRODUCTION
Data acquisition is the process of taking analog signals from the real world, processing them, converting them into digital data and finally bringing the resulting digital data into the computer memory. Data acquisition system (DAS) is a system that conditions a number of analog signals and converts them into digital form for processing by a computer. Data from latter are collected automatically
by a data acquisition system (DAS), which can report, for example the number of
parts being produced per unit time, their dimensional accuracy, their surface
finish, their weight, and so on, at specified rates of sampling.
The components of DAS include microprocessors, transducers, and analog-to-
digital converters (ADCs). Data acquisition systems are also capable of analyzing
the data and transferring them to other computers for purposes such as statistical
analysis, data presentation, and the forecasting of product demand.
This project is basically focuses on sensors. As mentioned above, transducer is
one of the important parts of DAS. And transducer is a combination of
several
sensors.
CHAPTER I INTRODUCTION
1.2
SENSORS
1.2.1 Definition
People who work with sensors and transducers everyday tend to use these two words somewhat interchangeably in their speech. This is no hard and fast rule as to what distinguishes an electrical from an electrical sensor. Ask any number of engineers or scientists for their definitions of these two terms and you will probably get that many different answers.
As according to Carstens (1993), sensor is a device that converts a quantity or an energy form into an electrical output signal. The form of that output signal, whether it is an ac or a dc signal, whether the signal is digital or analog, to name just a few, is determined by the sensor's electromechanical and/or chemical makeup. He again claimed that the transducer is a device comprised of a sensor whose output signal is modified or conditioned to suit a particular application or needs by its user.
In other study about sensor, Christiansen (1998) claimed that a sensor is basically
equivalent to the word of transducer.
According to him, a sensor, or transducer is
a device that converts energy derived
from a physical phenomenon into an
electrical current or voltage, for purposes of measurement, control, or
information.
CHAPTER I INTRODUCTION
Hordeski (1985) stated that a sensor is a device that converts information about the environment or internal state of a system from one form into another. It converts a measurand (signal to be measured) into a signal in a different form. The measurand is the input to the sensor and the signal produced by the sensor is the output. In data acquisition system, sensor is an element that converts changes in a physical parameter into electrical signals.
1.2.2 Forms of Sensor Outputs
(I) Analog Signal
Very simply stated, an analog signal is a continuous (not interrupted) data signal comprised of a flow of current or a voltage level whose amplitude, frequency, or phase relationship with some reference signal contains data information. This information represents a proportional relationship or analog of the input ineasurand that is controlling the signal [0' Higgins, 1996].
The Measurand is the quantity, or condition that is measured (then sensed and
converted into a useable electrical output) by a transducer
[Norton, I989].
Bateson (1999) stated that an analog signal varies in a continuous manner and
CHAPTERI INTRODUCTION
continuous recording of the outside air temperature as shown by Figure 1.1. The
recording is a continuous line (a characteristic of all analog signals).
Figure 1.1 : An analog signal of the outside air temperature. [Bateson, 1999]
(II) Digital Signal
According to Carstens (1993), a digital signal is comprised of a series of
interrupted flow, or pulses, of current or voltage levels. Each pulses or series of
pulses contains the encoded information corresponding to the
input data. A
decoding process must then be used to decipher the desired information.
The same study on digital signal, Bateson (1999) claimed that a digital signal
varies in a discrete manner and may take only certain discrete values between its
limits. Figure 1. 2 shows an example of a digital signal is an outdoor sign that
CHAPTER 1 INTRODUCTION
displays the outside air temperature to the nearest degree once each minute. A graph of the signal produced by the sign does not change during an interval, but it
may jump to a new value for the next interval.
74
tý. 7372
8.
u F71
I
1
I
i
I
!
!
iý
, ! I 1I
1ý
1!
! 1 ý 1 ! I ! I I ! 1 i i ! f I 1 f I i j i t 1 ! ! I 1 r I 1 1 ý ! I I ! I ' 1 I t i I I I I ! I 1 1 I 1 I ý 1 { 1 1 U i I I. 1 I I i 4 470
T11130
11:
35
Time. minutes
11: 40
Figure 1. 2: A digital signal of the outside air temperature. [Bateson, 1999]
(III) Carrier Signal
A carrier signal is an electromagnetic wave of constant amplitude that acts as an electromagnetic vehicle for transporting data. Data being transmitted by a carrier may be either analog or digital, depending on the methods used to modulate the carrier [Carstens, 1993].
CHAPTERI INTRODUCTION
1.3
MEASUREMENT SYSTEMS
1.3.1 Overview
The simplest measuring system would be a sensing device that also displays the measured value, such as a mercury-in-glass thermometer or pressure gage. If the measured value needs to be recorded at certain times, a human observer with a clipboard, pencil, and wristwatch can be employed for this purpose. In this example, the operator, clipboard, pencil, and wristwatch, become a part of the system.
When a measured value is to be displayed some distance away from the point of
measurement, a link between the two points becomes necessary. This link can be
mechanical (e. g., an automobile speedomotor cable), pneumatic (a pipe filled with
air whose pressure is varied by the sensing device, with a pressure indicator used
for display), or electrical (an electrical cable). Electrical wiring is used in
electronic measuring systems, in which the sensing device (sensor) has an,
electrical output and the display device accepts an electrical signal [Nachtigal,
CHAPTER 1 INTRODUCTION
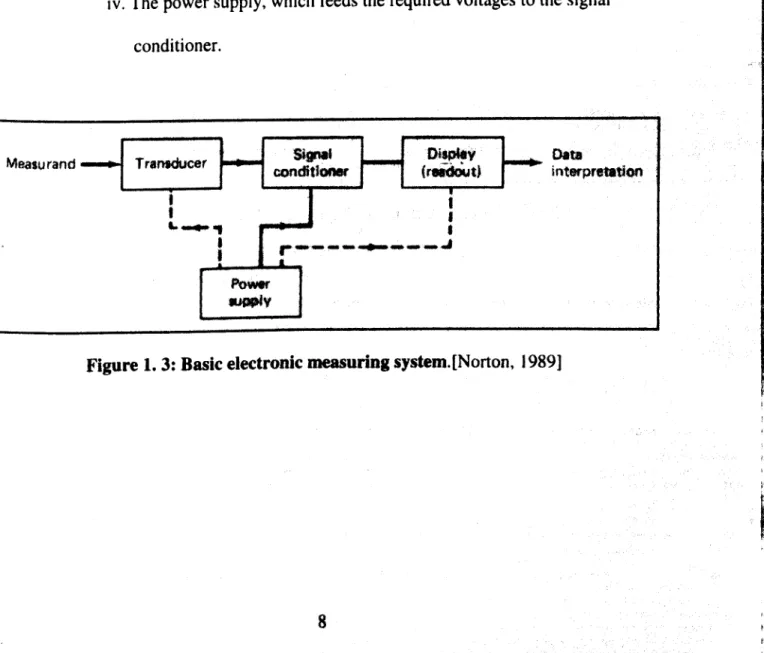
1.3.2 Basic Electronic Measuring System
A basic electronic measurement system is shown by Figure 1. 3. It consists of
i. The transducer, which converts the measurand into a usable electrical
output.
ii. The signal conditioner, which converts the transducer output into the
type of electrical signal that the display device will accept.
iii. The display device (or readout device), which displays the required information about the measurand.
iv. The power supply, which feeds the required voltages to the signal
conditioner.
! r
CHAPTER I
1.3.3 Signal Conditioning
INTRODUCTION
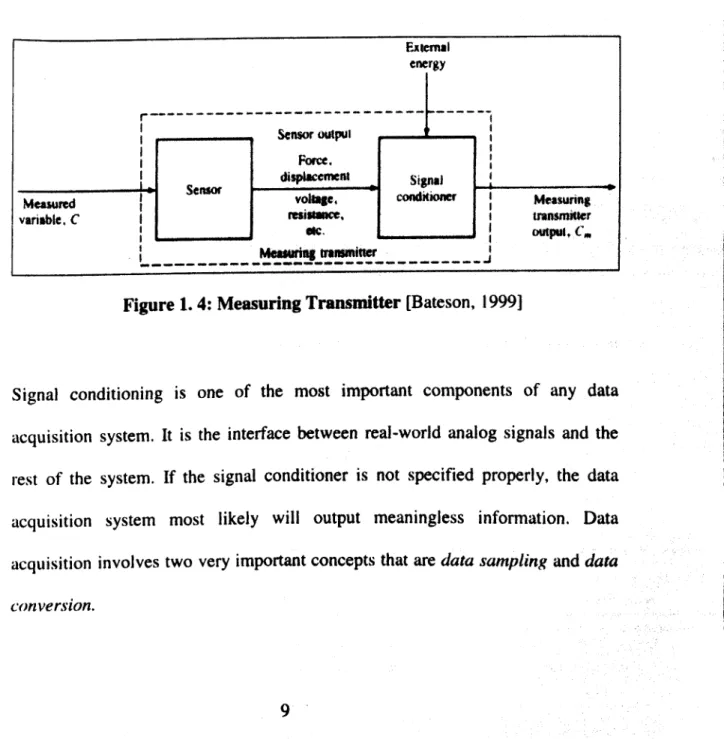
A study regarding to measuring system, Bateson (1999) stated that a signal conditioner is required to convert the sensor output into an electrical (or pneumatic) signal suitable for use by a controller or display device. The sensor and its signal conditioner comprise the two parts of a measuring transmitter which
is as shown by Figure 1. 4 [Bateson, 1999].
External energy ý---,. ---_ --- Sensor uWpui disptacemeni Signal 10-1 -4 Nieaaurcd Serra« vc+l4ge, conditioner variable, C nesisawsre, etc. Messuri transmitter o1ltput r cm
Figure 1. 4: Measuring Transmitter [Bateson, 19991
Signal conditioning is one of the most important components of any data
acquisition system. It is the interface
between real-world analog signals and the
rest of the system. If the signal conditioner
is not specified properly, the data
acquisition system most likely will output meaningless information. Data
acquisition involves two very important concepts that are data sampling and data conversion.
CHAPTER 1 INTRODUCTION
(1) Data Sampling
The rate at which need to sample an analogue signal, to get a good digital representation, depends on how fast the signal is changing. It is all about how accuracy the data sampling process to be. Data sampling is a process in which a switch connects momentarily to an analog signal in a sequence of pulses separated by evenly spaced increments of time called the sampling interval [Bolton, 1992].
For frequency components the Nyquist criterion demands that the signal be sampled at least twice in each cycle, otherwise the amplitude of this frequency component will distort the signal at lower frequencies.
The Nyquist criterion may be stated as follows: All the information in the original signal can be recovered if it is sampled at least twice during each. cycle of the highest frequency component [Kilian, 19961.
If f,, is the highest frequency that occurs in the original signal, then the minimum
sampling rate is given by the following equations.
Minimum sampling rate = fg (min) = 2f
CHAPTER 1 INTRODUCTION
. frtqucwý
a) Frequency
spectrum
of original
signal
h
ý
fs
b) Frcquency
spectrum
of sampled
signal with
f, > 2fh
ý
0 Frequency
Frequency
A
A
? is
c) Frequency
spe4trurm
of sampled signal with f, c2fh
Figure 1. 5 : Frequency spectrum an analog signal [Bateson, 1999].
Figure 1.5a shows how typical frequency spectrum of an analog signal. A frequency spectrum is simply a plot of the maximum voltage of each possible component of a signal versus the frequency of the component. The main point in Figure 1.5a is that there are no components of the original signal with a
![Figure 1.1 : An analog signal of the outside air temperature. [Bateson, 1999]](https://thumb-ap.123doks.com/thumbv2/123dok/2381832.3584174/18.825.142.727.272.678/figure-analog-signal-outside-air-temperature-bateson.webp)
![Figure 1. 2: A digital signal of the outside air temperature. [Bateson, 1999]](https://thumb-ap.123doks.com/thumbv2/123dok/2381832.3584174/19.823.116.807.278.1256/figure-digital-signal-outside-air-temperature-bateson.webp)
![Figure 1. 5 : Frequency spectrum an analog signal [Bateson, 1999].](https://thumb-ap.123doks.com/thumbv2/123dok/2381832.3584174/24.817.116.725.198.816/figure-frequency-spectrum-analog-signal-bateson.webp)
