Innovative Software
Development in GIS
Edited by
Bénédicte Bucher
Florence Le Ber
First published 2012 in Great Britain and the United States by ISTE Ltd and John Wiley & Sons, Inc. Apart from any fair dealing for the purposes of research or private study, or criticism or review, as permitted under the Copyright, Designs and Patents Act 1988, this publication may only be reproduced, stored or transmitted, in any form or by any means, with the prior permission in writing of the publishers, or in the case of reprographic reproduction in accordance with the terms and licenses issued by the CLA. Enquiries concerning reproduction outside these terms should be sent to the publishers at the undermentioned address:
ISTE Ltd John Wiley & Sons, Inc. 27-37 St George’s Road 111 River Street London SW19 4EU Hoboken, NJ 07030
UK USA
www.iste.co.uk www.wiley.com © ISTE Ltd 2012
The rights of Bénédicte Bucher and Florence Le Ber to be identified as the author of this work have been asserted by them in accordance with the Copyright, Designs and Patents Act 1988.
____________________________________________________________________________________ Library of Congress Cataloging-in-Publication Data
Innovative software development in GIS / edited by Florence Le Ber [and] Benedicte Bucher. p. cm.
Includes bibliographical references and index. ISBN 978-1-84821-364-7
1. Geographic information systems. 2. Geography--Data processing. 3. Geomatics. I. Le Ber, Florence. II. Bucher, Bénédicte.
G70.212.I556 2012 910.285--dc23
2012008578 British Library Cataloguing-in-Publication Data
A CIP record for this book is available from the British Library ISBN: 978-1-84821-364-7
Printed and bound in Great Britain by CPI Group (UK) Ltd., Croydon, Surrey CR0 4YY
Chapter 1. Introduction . . . 1 Bénédicte BUCHERand Florence LE BER
1.1. Geomatics software. . . 2 1.1.1. Digital geographical data . . . 2 1.1.2. GIS-tools . . . 5 1.1.3. Software innovation and geomatics
research . . . 9 1.2. Pooling . . . 12 1.2.1. The need for pooling and its relevance . . . 12 1.2.2. Reflection opportunity on geomatics
pooling. . . 13 1.2.3. Pooling within the MAGISresearch group 15 1.3. Book outline . . . 17 1.4. Bibliography . . . 18
PART 1. SOFTWAREPRESENTATION . . . 23 Chapter 2. ORBISGIS: Geographical Information
System Designed by and for Research . . . 25 Erwan BOCHERand Gwendall PETIT
2.3.1. Language and spatial analysis . . . 30
2.3.2. Representation: style and cartography . . . 35
2.3.3. Other functionalities . . . 36
2.5.1. Spatial diachronic analysis of urban sprawl . . . 48
Chapter 3. GEOXYGENE: an Interoperable Platform for Geographical Application Development . . . 67
Éric GROSSO, Julien PERRETand Mickaël BRASEBIN 3.1. Introduction . . . 67
3.2. Background history. . . 68
3.3. Major functionalities and examples of use . . . 69
3.3.1. Generic functionalities . . . 70
3.3.2. Use case: building data manipulation . . . 70
3.3.2.2. The data schema: the
Buildingclass . . . 72
3.3.2.3. Object-relational mapping with OJB. . 73
3.3.2.4. A processing example: building urban areas . . . 73
3.4. Architecture . . . 75
3.4.1. The core . . . 76
3.4.2. First applicative layer: the basic applications . . . 77
3.4.3. Second applicative layer: the expert applications . . . 78
Bogdan MOISUC, Alina MIRON, Marlène VILLANOVA-OLIVIERand Jérôme GENSEL 4.1. Introduction . . . 91
4.2. From AROMto AROM-ST . . . 93
4.2.1. AROMin context: a knowledge representation tool . . . 93
4.4. From AROM-OWLto ONTOAST . . . 112
4.5. Architecture . . . 113
4.6. Community. . . 115
4.7. Conclusions and prospects . . . 116
4.8. Bibliography . . . 117
Chapter 5. GENGHIS: an Environment for the Generation of Spatiotemporal Visualization Interfaces . . . 121
Paule-Annick DAVOINE, Bogdan MOISUC and Jérôme GENSEL 5.1. Introduction . . . 121
5.2. Context . . . 122
5.2.1. The SPHERE and SIDIRAapplications: two applications devoted to visualizing data linked to natural risks . . . 123
5.2.2. GENGHIS: a generator of geovisualization applications devoted to multi-dimensional environmental data . . . 125
5.3. Functionalities linked to the generation of geovisualization applications. . . 127
5.3.1. Use cases for GENGHIS. . . 127
5.3.2. Instancing the data model and the knowledge base . . . 128
5.3.3. Editing the presentation model . . . 130
5.3.4. Generating the geovisualization interface. . . 132
5.4. Functionalities of the geovisualization application generated by GENGHIS . . . 133
5.4.1. Spatial frame functionalities . . . 135
5.4.2. Temporal frame functionalities . . . 135
5.4.3. Informational frame functionalities. . . 137
5.4.4. Interactivity and synchronization principles . . . 138
5.5. Architecture . . . 140
5.6.1. Natural risks: a privileged scope . . . 141
Chapter 6. GEOLIS: a Logical Information System to Organize and Search Geo-Located Data . . . 151
Olivier BEDEL, Sébastien FERRÉ and Olivier RIDOUX 6.1. Introduction . . . 151
6.2. Background history. . . 152
6.3. Main functionalities and use cases . . . 153
6.3.1. Geographical data visualization and exploration . . . 156
6.3.1.1. Virtual layers: queries and extensions . . . 157
6.3.1.2. Visualizing a virtual layer: map and navigation index . . . 158
6.3.1.3. Building and transforming virtual layers: navigation links . . . 163
6.3.2. Representation of geographical data and spatial reasoning . . . 168
6.3.2.1. Representing spatial properties . . . 169
6.3.2.2. Representing spatial relations. . . 172
Chapter 7. GENEXP-LANDSITES: a 2D
Agricultural Landscape Generating Piece of
Software . . . 189
Florence LE BERand Jean-François MARI 7.1. Introduction . . . 189
7.3.2.2. Random rectangular tesselation. . . 196
7.3.3. Cropping pattern simulation . . . 198
7.3.3.1. Stationary method . . . 198
7.3.3.2. Taking into account succession changes . . . 199
7.3.3.3. Future changes . . . 199
7.3.4. Post-production, spatial analysis, and formats . . . 200
Chapter 8. MDWEB: Cataloging and Locating
Environmental Resources . . . 215
Jean-Christophe DESCONNETSand Thérèse LIBOUREL 8.1. Introduction . . . 215
8.2. Context . . . 216
8.2.1. Origins . . . 216
8.2.2. Positioning . . . 218
8.3. Major functionalities and case uses. . . 220
8.3.1. Matching roles and functionalities . . . 221
8.4. Cataloging functionality. . . 224
8.5.1. Local and distant metadata querying. . . . 241
8.5.2. Monolingual or multilingual querying . . . 241
8.6. Administration functionality . . . 244
Moritz NEUN, Nicolas REGNAULDand Robert WEIBEL 9.1. Introduction . . . 257
9.2. Historical background . . . 258
9.3. Major functionalities . . . 262
9.3.1. Uploading software tools . . . 262
9.3.2. Requesting a service . . . 263
9.4. Area of use . . . 265 Géographique National - IGN and others). . . 271
9.4.2.3. GIS providers . . . 271
9.5. Architecture . . . 273
9.5.1. WEBGEN services access . . . 273
9.5.2. A standard data model for generalization services . . . 274
Chapter 10. Analysis of the Specificities of Software Development in Geomatics Research . . 285
Florence LE BERand Bénédicte BUCHER 10.1. Origin and motivations . . . 286
10.1.1. Targeted users and uses . . . 286
10.1.2. Motivations and foundations . . . 287
10.2. Major functionalities,fields, and reusability . . 288
10.2.1. Functionalities. . . 288
10.2.2. Fields . . . 289
Chapter 11. Challenges and Proposals for
Software Development Pooling in Geomatics . . . 293
Bénédicte BUCHER, Julien GAFFURI, Florence LE BERand Thérèse LIBOUREL 11.1. Requirements and challenges . . . 294
11.1.1. Pooling function implementations. . . 294
11.1.1.1.Reusing functions implemented in geomatics. . . 294
11.1.1.2.The challenge of defining interoperable interfaces . . . 297
11.1.1.3.The challenge of modular development . . . 299
11.1.2. Pooling models and expertise . . . 301
11.1.2.1.The need for it . . . 301
11.1.2.2.A challenge: the diversity and gaps in the existing expertise. . . 302
11.2. Solutions . . . 303
11.2.1. Reference frameworks and metadata . . . 304
11.2.2. Test cases to improve description of implemented functions and progress within a community . . . 307
11.3. Conclusion . . . 311
11.4. Bibliography . . . 313
Glossary . . . 317
List of Authors . . . 325
Introduction
Research in geomatics must face major challenges to improve the management of the interaction of humankind with the planet at various levels. These challenges cover types of problems such as risk management (monitoring a volcano), sustainable development (the prevention of coastal erosion or the control of increasing urbanization in a given area), or even societal issues, such as the accompaniment and improvement of the integration of positioning techniques and their mobile applications in our everyday lives. To process these issues, we often need to turn to computers and develop software that can meet the requirements of the data handled. The goal of this book is to study the innovative software development activities carried out by geomatics research teams, and more specifically to analyze which of these development activities can be pooled, and whether it is relevant to do so, in the sense that it promotes research activities. We have chosen to focus on one aspect of geomatics research: the design of models and analysis methods to utilize geographical data.
The rest of Chapter 1 clarifies the contextual elements that are essential to the study of geomatics, and more specifically the definitions of the terms used. We successively clarify the notions of geomatics software and pooling in our context before presenting the goals and structure of the book.
1.1. Geomatics software
Geomatics is a technical and scientific field derived from geography and computer science. It develops methods to represent, analyze, and simulate geographical space. Its goal is to improve the understanding of this space and the management of human activities and human interventions on the planet. Thus, the core activities of geomatics is made up of techniques of Earth observation as well as techniques of model design – mainly maps – useful for analysis and reasoning. The traditional spatial representations are printed maps, gazetteers, or lists of triangulation points. For the past 20 years, geographical data have become digital and geomatics has been characterized by the intensive use of computer science. This development is highlighted by two phenomena. The first is the increase in data, specifically satellite data, and this increase requires the development of automatic processing. The second phenomenon is the increasing role of geographical information in information infrastructures (use of maps on the Web, localized services, etc.).
1.1.1. Digital geographical data
A core specificity of geomatics is its data.
objects. Overall, the choice of a representation often frames a domain of expertise and the joint manipulation of two types of representations remains complex even though there exist proposals to integrate them [LAU 00].
A second specificity of geographical data is the multiplicity of models built to represent geographical space in the data [BIS 97]. As [WOR 96] mentions it, geographical space isn’t a table top space, which is a space observable from outside, similar to objects placed on a table. It is a space in which each person acts, and builds, a representation of the space in the context of his/her own action. For example, the information obtained from a geographical landscape isn’t the same depending on whether the user is interested in road transport, risk management, or development. Differences appear at the level of the types of relevant objects: the watering places and pools are remembered by the fireman but not by the hauler. Differences also appear at the semantic and geometrical levels of detail: a building can be represented by its footprint and access points or in a simplified manner. Beyond the real-world ontology that is used – the categories of objects of the world observed and the logical diagram – the data also sometimes depend on specific rules of representation, such as a building of less than 20 m2 is represented by an object of the IsolatedConstruction class if it is highly isolated (over 100 m from another building). Finally, the coding of the data and the required geometry discretization leads to other choices that can vary from one producer to the other.
1.1.2. GIS-tools
A very popular type of software in geomatics is the geographical information systems tool (GIS-tool), which allows the manipulation of geographical data. The term “tool” allows us to distinguish the piece of software from the complete system made of data, software, and users. The term GIS generally refers to the entire system. From now on in this book, we will use the term GIS to refer to a GIS-tool. A GIS is characterized by many functionalities that are essential in geographical information and detailed as follows. Up until the 1990s, GIS software fulfilled all these functionalities. Monolithic architectures then became architectures made up of modules dedicated to various functionalities, which are required to use the geographical data. This evolution was helped by interface specifications between GIS components produced by International Organization for Standardization (ISO) and Open Geospatial Consortium (OGC)1. These specifications were deliberately made abstract at first so they wouldn’t restrict the market. Implementations were quickly suggested and included into the standard ones:XMLimplementations for the interoperable Web service components and JAVA(GEOAPI) implementations for interoperable libraries. Today, the notion of GIS thus refers to an information system made up of data and functional modules. It holds definite interest for pooling since it encourages researchers to focus on their core interest and reuse functional modules for the supporting functions they need.
The GIS functionalities were referred to in France by the acronym “5A”: “Acquire”, “Afficher” (“Display”), “Archive”, “Abstract”, and “Analyze” [DEN 96]. A sixth “A”, for
“Anticipate”, appeared along with the concern about sustainable development and simulation software.
does not offer redundant structures and its interface is clearly identified.
The display is available in various functions: visualizing the data geometry, visualizing their attributes, and writing and visualizing a map from these data. The last function requires the association of geographical data and cartographic styles, and then to draw the corresponding figure, which means having graphical objects linked to geographical objects. The cartographic representation is specifically studied in the GENGHIS proposition described in this book. A cartographic style is the association between a piece of information and a graphical symbol. The styles are defined for object classes such as roads and avalanches and eventually refined within a class according to the attributes of the said class: roads, for example, are represented differently depending on the value of the “classification” attribute given to the road. It was for a long time impossible to transfer a legend (from the cartographic style definition) from one type of software to another, due to the lack of a standardized format. The current proposition of the OGC consortium, entitled Styled Layer Descriptor, aims to become just such a standard. Besides, within the context of pooling, display processing is not simply about being able to transfer a display specification from one type of GIS software to another. It is also about knowing how to adapt the display of data to the context. This issue has been studied in thefield of collaborative GIS architectures, which aim to allow multiple actors (such as researchers) to work on the same set of data.
of answers improves search engine performance [PAL 10, PUR 07].
Analysis carried out in a GIS corresponds to the possibility of automatically carrying out complex operations or reasoning on the properties and spatial relations of the objects represented, such as the buildings around an airport, or the calculation of an itinerary. Among the functionalities defined by [STE 09], we have the query function. The query is specifically important and complex in geographical information for it requires the indexation of information under various crossed criteria: the position in space, the nature, and the position in time. In this book, the GEOLIS software offers a different abstraction from the classical entity-relationship model to organize these elements of geographical data aiming to make exploration queries on this data. The manipulation of spatiotemporal data has increased in importance, whether to manage moving objects or dynamic objects. The GENGHIS software presented in this book is dedicated to the implementation of spatiotemporal information systems (STIS).
1.1.3. Software innovation and geomatics research
new map types, models and applications for sustainable development, geographical information integration, spatial analysis, simulation, and geographical information science epistemology, among others.
Geomatics research is often inseparable from software usage to manipulate geographical data, whether they are complete GIS systems or specific modules. Researchers can be users. For example, geography researchers rely on GIS software to improve the knowledge of certain phenomena. Many models developed to study spatial phenomena, such as the erosion of agricultural land [DER 96], runoff and flooding [LAN 02], urban development [PIO 07, SIR 06], rely on sets of data stored in GIS that produce new data.
Researchers can also be developers, either to develop an ad hoc tool or suggest software innovations, which are developments whose scope is not restricted to solving a specific case. Some researchers work by developing extensions to existing software where these offer a programming interface, whether to offer new processing procedures or enrich a data model. These are typically works based on the ARCINFO software, widely used in American universities, or on the GRASS software, one of the first free pieces of GIS software. The ESRI international user conference thus welcomes some communications from researchers, the proof of which is the publication every year of a special issue of the scientific journal Transactions in GIS [WIL 10]. Other researchers ascribe to the development of a new tool. For example, this was the case for the graphical query interfaces CIGALES [MAI 90] or LVIS [BON 99], as well as for projects presented in this book.
Or yet, the innovation can be in the architecture itself. The range of corresponding software solutions is wide: 3D view reconstruction from pictures, multiagent architectures for distributed processing, a mobile data management system, robot cartographer, geographical search engine, etc. Innovation can also pertain to the development of tools specific to certain research programs, tools which allow the manipulation of geographical data, and which can be considered as future functionalities of GIS-tools. In this book, we will present GENEXP-LANDSITESa software dedicated to the simulation of virtual landscapes. It aims at exploring the variability of agricultural landscapes and considers different cases for the spatiotemporal organization of agricultural production. So GENEXP-LANDSITES belongs to the sixth “A” (Anticipate) of the GIS-tools. Let us emphasize that software innovation in geomatics is also due to other actors rather than researchers, such as the military or private companies. We can, for example, mention the GOOGLE MAPS API that offers a functionality for new users: integrating a map into a website with eventually a specific overlay. This functionality was already available through Web extensions for classic GIS software, but the innovation was to offer it to geomatics novices due to use of simple language.
the rise of ubiquitous environments, localized services and ubiquitous cartography that also rise in importance.
1.2. Pooling
The term “pooling” is derived from the verb “to pool”, which can be defined as “to combine (as resources) in a common fund or effort” [MIS 93]. The term was used for information technology applications, as early as the introduction of these applications in small businesses and communities, to essentially mean the sharing of upkeep and update costs. The term “information technology pooling” is also used in research and training about data and resources, such as linguistic resources [PIE 08]: the goal is to offer access to all the information and knowledge produced by every person and thus promote knowledge dissemination and progress. In this book, we consider the term “pooling” as meaning the pooling of resources that come into play during the design and development of software, aiming for shared benefits. These resources can be varied: abstract models, code, programming interfaces,financing, or yet experience in project management.
1.2.1. The need for pooling and its relevance
pooling is the European project SPIRIT, whose goal is to design a search engine based on geographical knowledge. The design and implementation of the engine required the collaboration of teams specializing in research on information, spatial analysis, and visualization. The pooling of the software contributions of the various teams took place within a service-based architecture whose interface contracts were defined during a joint project [FIN 03].
We should also note that the research teams use and sometimes improve other pieces of software necessary to their activities in higher education and research in general, such as article writing, presentation preparation, sharing courses, setting up websites for conferences, as well as all the management activities required by an institution which relies on digital information systems. This book does not focus on these tools. That said, the necessity for pooling solutions to support these activities has been proved and an answer has actually been provided by the PLUME2 project, or by the implementation of the university and higher education and research institution pooling agency3. Other initiatives focus on digital documents such as the HAL4 or ARXIV5 archive sites – which gather researchers’ scientific publications – or even the ORI-OAI6 software that creates digital document sharing portals between education and research institutions.
1.2.2. Reflection opportunity on geomatics pooling
A reflection on the possibilities of pooling software development projects carried out in geomatics research teams
2 http://www.projet-plume.org 3 http://www.amue.fr/
4 http://hal.archives-ouvertes.fr/ 5 http://arxiv.org/
is all the more timely now that the techniques allowing us to interoperate software components, to cooperate on the design of a module, to design reusable components, or even to reuse existing components have improved and are widespread in software development.
These techniques are first and foremost, in geomatics, norms and standards concerning interfaces between components manipulating geographical data. In the field of geomatics, these standards mostly come from the ISO and its technical committee TC211 as well as the OGC. Specification may concern exchanged data, as in the Geographic Markup Languagenorm for instance, or functionalities, as in theWeb Feature Service, Web Map Service, and Catalogue Service for the Webnorms.
These techniques also cover methods and correlated collaborative development tools, OMG method [OMG 08], software project management tools, such as Enterprise Architect as well as middleware techniques aiming to encourage the reuse of software components with mediation architectures or component architectures [KRA 06]. A key architecture is, for example, the Web service architecture that corresponds to an architecture based on loosely coupled components on a widely accessible network. Another proof of the maturity of middleware techniques is ubiquitous architectures [WEI 93, WAL 97].
A particularly interesting standard for us is the Web Processing Services standard proposed by OGC. It focuses on the online availability of geographical data processing to promote sharing and reuse.
Moreover, the new information and communication technologies promote the confrontation of disciplines around joint study objects (a societal phenomenon, a territory, a design project, etc.). We can mention the visualization breakthroughs which allow development experts, for example, to better communicate on their projects with experts of other disciplines (due to a virtual world representation). Let us also mention the technical breakthroughs in information integration, due to both the dissemination of spatial content aggregators (mashups) and the increasing adoption of techniques derived from artificial intelligence on the Web. We can then talk of pooling information and knowledge. This is one of the express purposes of the semantic Web [BER 01], and, for us here, more specifically of the geospatial semantic Web [LIE 06]. Achieving this goal starts first and foremost with an effort to describe the information (in standard XML/RDF formats) available on the Web. This also requires the development of ontologies (for which we have the standard language OWL [DEA 04]) and automatic reasoning mechanisms which allow us to interpret the information described. The AROM and AROM-ST extensions we will describe in this book are a step in this direction.
1.2.3. Pooling within the MAGISresearch group
This study was carried out within the “Exchange, Pooling, Design” project of the MAGIS research group, and of its predecessor SIGMA. This reflection welcomed contributions from external researchers when they provided a new point of view, useful to the reflection. The WEBGEN work, which has previously been mentioned, falls into this category.
the sense we have used here – is required for each of these research axes:
– The “Sensor” pole deals with the sources of geographical data acquisition and communication means. The tools developed are not only aimed at capturing data, but can also adapt to the user’s needs. More specifically, the development of GPS satellite localization means and the improvement in precision enable us not only to pinpoint static objects but more and more to follow moving objects, including individuals, to which we can then offer various services.
– The “Model” pole focuses on various research components, from the perception in a geographical environment of phenomena of all shapes (thematic diversity), scales, and spatial or temporal granularities to their digital representation. The developed models are meant, on the one hand, to formalize concrete and abstract concepts linked to geographical objects or processes in space, and on the other hand to take into account various perceptive modalities: the verbal and textual forms of description, the visual, the naive geography, etc. These new forms of geographical environment description create various issues (interoperability and integration of the design with the usual representation forms of geographical information).
– The “Analysis” pole deals with an old and fundamental field of geographical information research, which is still very much relevant today due to the very rapid increase in the volume of available data and the need to have tools and diversified and renewed methods to interpret them. One of the current problems is the integration of multisource data; another is the visual restitution of data, which requires the implementation of numerous geographical concepts that have yet to be identified and clarified.
process. These processes, personal or collective, public or private, are carried out by heterogeneous and multiple actors, by users and providers of information. We must thus understand the use and the production of geographical information by the various actors, local authorities or environmental agencies, commercial and industrial businesses, etc. The questions of use, organization, appropriation, and communications must be asked within a renewed frame, always attentive to emerging practices.
All these axes focus on different aspects which bring us back to the issue of pooling: production and dissemination of data, integration and interoperability of modes, integration of various data and expertise sources, etc. The whole set proves the need to share data, models, and knowledge. A first – and fairly advanced – possibility is to implement norms enabling communication between different types of software. The other possibilities are examined in this book through the description of different research or software development experiments.
1.3. Book outline
Chapters 2 to 9 of the book aim to give a more detailed analysis of the reasons for which geomatics researchers are led to develop software solutions. They describe different specific development experiments using a common backdrop that helps by comparing the experiments and makes the book easier to read. This backdrop was defined jointly by all the authors of the chapters describing software development projects. Its specifications are as follows:
– short introduction;
– history: scientific and technical context of development, rationality, founding principles, and project management;
– architecture: interface types for possible reuse;
– associated communities: carriers, contributors, dissemination, and effectiveness of prospective use;
– conclusion: feedback from experiments, perspectives, and legal considerations;
– bibliography.
Following these detailed presentations, we will sketch an innovative GIS software development case “cartography”. We offer typologies to describe these software developments according to their different characteristics (the goals they aim for, the contexts, functions, data, interfaces, users, expertises, etc.). We will analyze the needs and obstacles to pooling.
Based on this analysis, we will then present proposals to improve pooling in software developments carried out by geomatics research teams.
1.4. Bibliography
[BAL 07] BALLEY S., Aide à la restructuration de données géographiques sur le Web – Vers la diffusion à la carte d’information géographique, PhD in computer science, University of Paris-Est Marne-la-Vallee, 2007.
[BAT 05] BATTY M., Cities and Complexity, The Massachusetts
Institute of Technonology Press, Cambridge, MA, 2005.
[BER 01] BERNERS-LEE T., HENDLER J., LASSILA O., “The semantic web”,Scientific American, vol. 1, pp. 34–43, 2001. [BIS 97] BISHR Y., Semantic aspects of interoperable GIS, PhD
Thesis, ITC, Enschede, The Netherlands, 1997.
[BON 99] BONHOMME C., TRÉPIEDC., AUFAUREM.-A., LAURINI
[COU 92] COUCLELISH., “People manipulate objects (but cultivate fields): beyond the raster-vector debate in GIS”, Proceedings of the International Conference GIS – From Space to Territory: Theories and Methods of Spatio-Temporal Reasoning in Geographic Space, vol. 639 of LNCS, Pisa, Italy, 1992.
[DEA 04] DEAN M., SCHREIBER G., BECHHOFER S., VAN
HARMELEN F., HENDLER J., HORROCKS I., MCGUINESS
D., PATEL-SCHNEIDER P., STEIN L., OWL Web Ontology
Language – Reference, W3C Recommendation, World Wide Web Consortium, 2004.
[DEN 96] DENÈGRE J., SALGÉ F., Les systèmes d’information géographique, Que sais-je?, PUF, Paris, 1996.
[DER 96] DE ROO A.P.J., WESSELING C.G., RITSEMA C.J., “LISEM: a single-event physically based hydrological and soil erosion model for drainage basins”, Hydrological Processes, vol. 10, no. 8, pp. 1107–1117, 1996.
[FIN 03] FINCH D., Specification of system functionality,
deliverable D4 no. 1101, SPIRIT Technical Group (IST-2001-35047), 2003.
[ISO 07] ISO TC211, ISO 19136 – Geographic Information – Geographic Markup Language (GML), Report, ISO International Standard, 2007.
[KAM 08] KAMEL I., “Indexing, Hilbert R-tree, spatial indexing, multimedia indexing”, Encyclopedia of GIS, SpringerScience/Business Media, New York, pp. 507–512, 2008.
[KRA 06] KRAKOWIAKS., Intergiciel et construction d’applications réparties, Ecole d’été ICAR, 2006.
[LAN 02] LANGLOIS P., DELAHAYE D., “RuiCells, automate
cellulaire pour la simulation du ruissellement de surface”,Revue Internationale de Géomatique, vol. 12, no. 4, pp. 461–487, 2002. [LAU 00] LAURINI R., GORDILLO S., “Field orientation for
[LIE 06] LIEBERMAN J., Geospatial semantic web interoperability experiment report, Report, Open Geospatial Consortium Inc., 2006.
[MAI 90] MAINGUENAUD M., PORTIER M.-A., “Cigales: A graphical query language for geographical information systems”, Proceedings of 4th International Symposium on Spatial Data Handling, Zurich, Switzerland, pp. 393–404, 1990.
[MAR 08] MARTIGNAC C., TEYSSIER A., THINON P., CHEYLAN
J.-P., “SIG participatifs et développement: contributions de l’expérience de la réforme foncière malgache”, International Conference on Spatial Analysis and Geomatics – SAGEO’ 2008, Montpellier, France, 2008.
[MIS 93] MISCH F.C., (ed.), Merriam-Webster’s Collegiate Dictionary, Merriam-Webster, Incorporated, Springfield, MA, 1993.
[OMG 08] OMG, Software & Systems Process Engineering Meta-Model Specification, v2.0, 2008.
[PAL 10] PALACIO D., CABANAC G., SALLABERRY C., HUBERT
G., “Measuring geographic IR systems effectiveness in digital libraries: evaluation framework and case study”, Proceedings of the 14th European Conference on Research and Advanced Technology for Digital Libraries – ECDL’10, Glasgow, Scotland, pp. 340–351, 2010.
[PIE 08] PIERREL J.-M., “De la nécessité et de l’intérêt d’une mutualisation informatique des connaissances sur le lexique de notre langue”,Congrès Mondial de Linguistique Française, Paris, French Institute of Linguistics, 2008.
[PIO 07] PIOMBINI A., FOLTÊTE J.-C., “Evaluer les choix d’itinéraires pédestres en milieu urbain”, Revue Internationale de Géomatique, vol. 17, pp. 207–225, 2007.
[PUR 07] PURVES R., CLOUGH P., JONES C., ARAMPATZIS A., BUCHER B., FINCH D., FU G., JOHO H., KHIRINI A., VAID
[SIR 06] SIRETD., MUSYM., RAMOSF., GROLEAUD., JOANNEP., “Développement et mise en œuvre d’un SIG 3D environnemental urbain”, Revue Internationale de Géomatique, vol. 16, no. 1, pp. 71–91, 2006.
[STE 09] STEINIGERS., WEIBELR., “GIS Software – a description in 1000 words”,Encyclopeadia of Geography, SAGE Publication, London, UK, 2009.
[TER 92] TERRY D.B., GOLDBERG D., NICHOLS D., OKI B.M., “Continuous queries over append-only databases”,Proceedings of the SIGMOD, 1992.
[TUR 08] TURKUCUA., ROCHES., “Classification fonctionnelle des public participation GIS”, Revue Internationale de Géomatique, vol. 18, no. 4, pp. 429–442, 2008.
[WAL 97] WALDO J., WYANT G., WOLLRATH A., KENDALL S., “A note on distributed computing”,Mobile Object Systems: Towards the Programmable Internet, LNCS 122, Springer Verlag, 1997. [WEI 93] WEISERM., “Some computer science issues in ubiquitous
computing”,Communications of the ACM, vol. 36, no. 7, 1993. [WIL 10] WILSON J.P., “GIScience research at the Thirtieth
Annual ESRI International User Conference”, Transactions in GIS, vol. 14, no. 1, 2010.
[WOL 99] WOLFSON O., SISTLA P., CHAMBERLAIN S., YESHA Y.,
“Updating and querying databases that track mobile units”, Distributed and Parallel Databases Journal (DAPD), vol. 7, no. 3, pp. 257–288, 1999, special issue on Mobile Data Management and Applications.
O
RBIS
GIS: Geographical
Information System Designed
by and for Research
2.1. Introduction
ORBISGIS1 is a geographical information system (GIS) dedicated to scientific modeling and experimenting. ORBISGIS has been developed at the IRSTV, a French research institute dedicated to urban science and techniques2 since April 2007, within the “urban data” Federative Research Project (FRP) framework whose goal is to provide methods and tools to gasp the challenges of urban environments.
There are three main objectives within the “urban data” FRP:
– data acquisition techniques (teledetection, model reconstruction, on-site measurements, etc.);
– representation and processing of spatial information (storage, modeling, multiscale simulation: time + 3D);
– sharing geographical information.
ORBISGIS was built on top of free andopen sourcelibraries. It is distributed under a GPL 3 license (open source)3. ORBISGIS’s goal is to be a federating tool, gathering within the research units of the IRSTV all the methods and processed data linked to geographical information, irrespective of the research field they come from (sociology, civil engineering, urban architecture, geography, economy, environment, etc.).
This chapter is divided into five sections in which we describe the background history of ORBISGIS (section 2.2), present its major functionalities (section 2.3), detail its architecture (section 2.4); present three use cases (section 2.5), and end by giving a few elements of information about the developer and user community (section 2.6).
2.2. Background history
IRSTV is an FR CNRS 2488 research federation and a federative structure of the French Ministry for Higher Education and Research. IRSTV is made up of 15 laboratories and carries out interdisciplinary research in the fields of modeling and sustainable urban management [HÉG 06]. Its research activities are focused around three major themes:
– an interdisciplinary urban observation system (urban teledetection, and multidisciplinary experimentations site – MWS);
– an integrated environmental modeling of the city (integrated urban microclimatology, sound atmospheres, urban data modeling, and GIS);
– governance, design, and sustainable urban management.
This multidisciplinary aspect is the cause of a great disparity in the use of geographical information, whether it is the data (storing and modeling), the tools used to exploit it, or the processing chains implemented [BOC 07a, BOC 08a, BOC 08b]. The diversity in GIS software is twofold: a diversity in storage support and a formal diversity in the description of data. It leads to a division of geographical knowledge, which is, in a way, the opposite of IRSTV’s goals: to develop an integrated vision of all the urban physical phenomena, methods, tools, and actor systems which contribute to the sustainable management of the city.
To overcome these gaps and reinforce a federative spirit, the outlines of a GIS for urban modeling and management appear within the framework of the regional program MeigeVille – “Modélisation environnementale intégrée et gestion durable de la ville” – which stands for urban integrated modeling and sustainable management [HÉG 06]. The goal of this GIS is to design the theoretical and instrumental bases of a capitalization tool of urban environment knowledge as well as analysis methods and management techniques [HÉG 06]. It is at this point that the plan to create a GIS platform to ensure coordination and animation was set in motion.
In December 2006, the GIS platform was put in the hands of a research engineer specializing in spatial reference data. The platform is structured around the development of two platforms:
– a spatial data infrastructure (SDI);
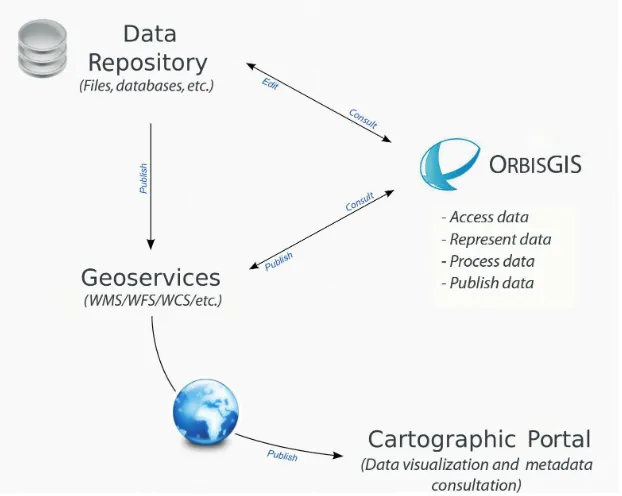
By referring itself to geographical data sharing and exchange best practices, which are written down in national and international recommendation documents [CLI 94, NEB 04, INS 07], the GIS platform lays down the bases of an interoperable architecture made of (Figure 2.1) [BOC 07c]:
– a data repository to store information;
– a third application, called Geoservices, to share data using OGC standards;
– a Web cartographic portal to view, explore and search data;
– a GIS software, called OrbisGIS, to view, process, display and push data.
As the first part of the SDI puzzle, ORBISGIS was developed to answer the requirements of research. Indeed, it is during the implementation of a chain of analyses and processing of urban soil tenure within the MeigeVille project [BOC 08b] that gaps of formalism and interoperability between GIS-tools were highlighted with regard to the manipulation of geographical objects. Each tool had its own language, concepts, and terms to describe a geographical process, and it was consequently very difficult to exchange methods unless mediators were developed for each tool.
In this situation there appeared the idea of an advanced language, able to access the main geographical data formats and structures (vector or raster) while respecting the international standards as much as possible. Relying on the Simple Features SQL (SFS) norm [HER 06a, HER 06b], this is the main processing language of the ORBISGIS platform. It enabled all the IRSTV researchers to build a common library of processes working for issues, such as spatial hydrology, urban tissue evolution analysis, and noise mapping (French National Research Agency projects such as AVUPUR, EvalPDU, and VEGDUD4). Within this context, a new and more federative approach to geographical information came to life in the IRSTV, leading researchers to build a GIS together which would be dedicated to the analysis of urban environments.
The first beta version of ORBISGIS was released at the end of June 2007, during the 8th Libre Software Meeting [BOC 07b]. Since then, the following versions have been released:
– 3.0 (Barcelona): February 2011;
– 2.2.0 (Paris): December 2009;
– 2.1.0 (Vienna): June 2009;
– 2.0.0 (Ostrava): January 2009;
– 1.2.0 (Naoned): August 2008;
– 1.1.0 (Boston): July 2008;
– 1.0.0 (Girona): June 2008.
2.3. Major functionalities
One of the major particularities of ORBISGIS is its Generic Datasource Management System (GDMS) library [BOC 08b, LED 09]. Beyond data access, this library enables us, through a specific query language derived from SQL, to process geographical (vectorandraster) data and allocated data, using on the one hand a set of functions in accordance with the SFS specifications of the Open Geospatial Consortium (OGC) and on the other hand the specific functions developed for research needs. ORBISGIS is the graphical interface designed to explore and represent the data manipulated by GDMS.
2.3.1. Language and spatial analysis
in many GIS such as the SPATIAL ANALYST5 for the ESRI ARCGISc or GRASS’srasteranalysis module6.
At the beginning of 2000, the OGC, with the SFS specification, defined a set of operators and spatial predicates as well as a syntax to manipulate, in SQL,vectorgeometries of types such as Point, Linestring,Polygon, etc. [HER 99, HER 06a, HER 06b]. This document formalizes the many attempts presented by the scientific community, such as those made by [EGE 88b, EGE 88a, EGE 89] or [GOH 89, GUT 88], and for the first time endorses a language dedicated to vector geographical data. This specification was welcomed by consensus, especially by private companies which did not wait long to adopt it. The POSTGIS7 spatial add-on for the relational database POSTGRESQL is a perfect illustration of this. In 2010, the website logged, on average, 800 downloads of the source code a month.
However, the SFS standard only provides us a partial answer to manipulate geographical data. The operators and predicates are only defined for vector data. Raster data processing and the topological reasoning (graph routing, arithmetic on raster graphics or convolution, etc.) are no longer listed as OGC improvement priorities. Yet in a multidisciplinary context like the context at the IRSTV, where the city is observed at various scales and where studied objects are varied (urban tasks, air pollution, and surface hydrology), research works require data sources as well as varied models and structures.
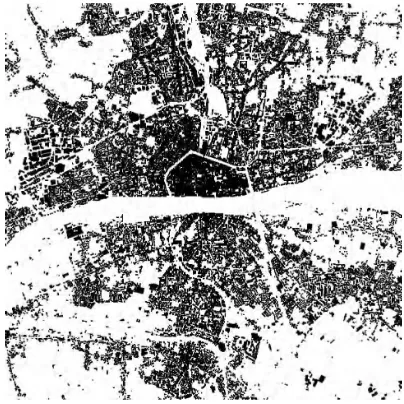
We can provide a simple example, the spatial analysis of urban area evolution. Starting with a set of satellite
5 http://www.esri.com, accessed September 2011. 6 http://grass.fbk.eu/, accessed September 2011.
images taken on various dates, the user can extract sets of pixels corresponding to urban objects (buildings, parking lots, etc.). These sets are transformed into a collection of polygons (vectorization) which describe the urban space. They are stored in layers separated by their observation date. If the scales, for the operator in teledetection, are set at the level of the object identification method, for the geographer or the developer, the focus will be the study of the phenomenon’s distribution. Thus, the data from the image classifications will be aggregated, combined with vector databases which represent the different levels of land administration (local authorities, major cities, and their suburbs).
In the current situation, which is not specific to the IRSTV, there are two work approaches to implement this processing chain:
– either it is entirely carried out by the teledetection operator who only provides the geographer with the results;
– or the geographer is provided with the image results, and he/she then analyzes them with his/her own tools.
In this context, one of the major challenges is to promote the dissemination of not only data, but also methods. The goal is to decompartmentalize analyses and spatial processes by making them independent of the software in which they are carried out, and to promote exchanges.
grammar was extended to work on therasterdata. This ability to manage therasterformat is also present in the commercial software ORACLESPATIALwith the GEORASTERmodule.
With the GDMS library, it is thus possible to produce a buffer zone on a file in shapefile format. In that case, two instructions are carried out:
– With the Register function, the user first saves the myShapefileFile.shpfile, gives it a name (myShapeFile), and accesses the data:
SELECT Register(’/tmp/myShapeFileFile.shp’, ’myShapeFile’).
– The user then applies a buffer zone of 20 m on the geometries of the monShapeFilefile, which are found in the the_geomcolumn:
SELECT ST_Buffer(the_geom, 20) as the_geom FROM myShapeFile.
This query is equivalent to the query used in the POSTGRESQL SGBD, with its POSTGIS spatial extension.
However, GDMSis different when it comes to rasterformat manipulation. In the following example, we will dissect an image from a geometry due to the functionST_CropRaster:
SELECT ST_CropRaster(a.raster,b.the_geom) as raster
FROM myRaster a, myShapeFile b;
Let us note that first, the user will have declared the file wasrasterto access it:
The result produces a new raster image whose content is stored in araster-type column. The GDMSdata model will then be presented.
Figure 2.2 presents the major processing categories which are supported by SQL language today. All in all, GDMS has almost 200 functions. Among the most common are the SFS specification spatial operators and predicates (ST_Intersects, ST_Difference, ST_Buffer, ST_Contains, ST_Touches, etc.) as well as advanced functions:
–ST_D8Direction, ST_D8Accumulation,
ST_Watershedfor hydrology;
–ST_CreateGrid, ST_Compacity for morphological analysis;
–ST_Delaunay, ST_ConstrainedDelaunay for
triangulation.
Figure 2.2.ORBISGIS’s main spatial analysis functions
essential uses in spatial analysis. With GDMS-R [LED 09], we have proved that it is possible to manipulaterastergraphics in spatial SQL. This demonstration is the basis on which we will rely on to formalizerasteroperators and suggest an evolution in the SFSspecification to OGC.
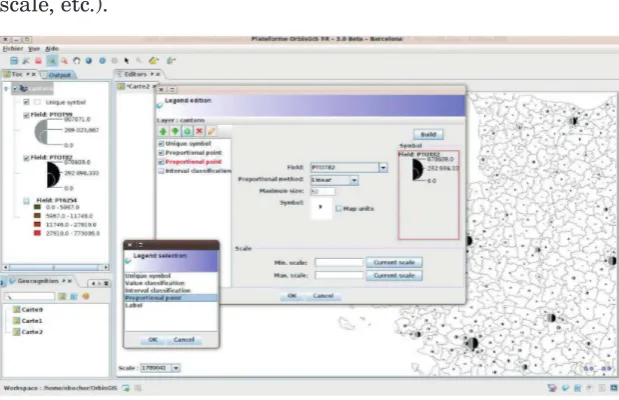
2.3.2. Representation: style and cartography
Like most GIS, ORBISGIS can affect graphic styles and build cartographies. Figure 2.3 summarizes the main available methods. From a simple classification by unique value to the creation of a map with confronted symbols, ORBISGIS offers an almost complete functional coverage to represent geographical data.
Figure 2.3.Style and cartography. For a color version of thisfigure, see www.iste.co.uk/Bucher/innovgis.zip
by clicking on the “+” icon in the legend list toolbar. When a legend is validated by the user, a graphical interface comes up with its own methods (background color, symbol type, display scale, etc.).
Figure 2.4.ORBISGIS’s multilegend system
Let us also specify that the model used to manage the legends by layer is plural. Indeed, a same layer in ORBISGIS can have various cartographic representations: proportional symbols, unique symbols, etc. Each of these legends was activated – inactivated in the TOC. An example of this is given in Figure 2.4.
2.3.3. Other functionalities
As other GISs, ORBISGIS has classical management, visualization, and editing functions for geographical data.
2.3.3.1. Visualization
interrogation and measurement tools (surface, length, and angle measurement). The user can also display a table’s attributes in a window. This window will offer tools to produce statistics in a numerical field, change the name of a column, and sort the values of a column in an ascending or a descending order, select rows, etc.
2.3.3.2. Editing
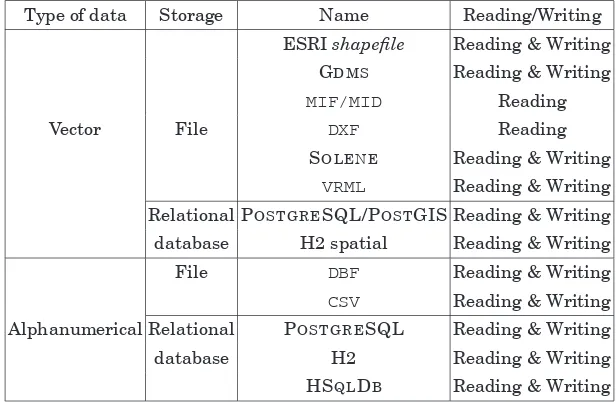
Depending on the data format, ORBISGIS enables us to edit geometries as well as attributes. Table 2.1 lists the vectorand alphanumerical formats currently supported by the platform8.
Type of data Storage Name Reading/Writing
ESRIshapefile Reading & Writing GDMS Reading & Writing
MIF/MID Reading
Vector File DXF Reading
SOLENE Reading & Writing
VRML Reading & Writing
Relational POSTGRESQL/POSTGIS Reading & Writing database H2 spatial Reading & Writing
File DBF Reading & Writing
CSV Reading & Writing
Alphanumerical Relational POSTGRESQL Reading & Writing
database H2 Reading & Writing
HSQLDB Reading & Writing
Table 2.1.ORBISGIS-supported formats
Geometry editing is carried out in the “Map” view in a layer selected in the TOC. The available functions are:
– creating points, lines, and polygons, as well as multigeometries; a geometry figure can, for example, have more than one polygon;
– deleting geometry;
– modifying, moving, adding, and deleting a geometry’s peaks.
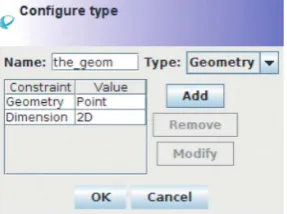
As for attributes, ORBISGIS has an advanced interface that offers the possibility for the user to not only add a column in a table depending on a listed type, but also to specify constraints in this column. The creation of a geometry field can, for example, be limited to aPointtype and a 2D or 2.5D dimension (Figure 2.5).
Figure 2.5.Creating afield with constraints
2.3.3.3. OGCflux
Figure 2.6.WMSflux loading and legend visualization
2.4. Architecture and graphical interface
The ORBISGIS platform was designed with a modularity in mind, both at the level of the architecture and the graphical interface. Let us present these two aspects.
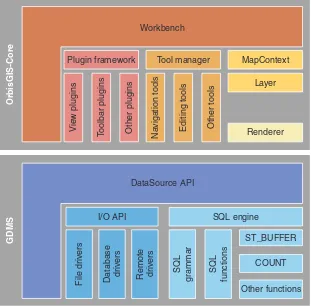
2.4.1. Architecture and models
The ORBISGIS application is organized around two libraries:
– the GDMS library for vector and raster data access and processing;
– the ORBISGIS-Core library made up of the graphical interfaces and “man-machine” actions, a layer model that allows us to manage the data as well as their legend and the pluginsystem.
Workbench
Plugin framework Tool manager MapContext
Vie
w plugins
T
oolbar plugins Other plugins Navigation tools Editing tools Other tools
Layer
Figure 2.7.TheORBISGISplatform architecture
2.4.1.1. Creating a plugin
Each component of the ORBISGIS interface is apluginthat can itself be used by anotherplugin. The code written down in Table 2.2 illustrates an example of plugin writing when the goal is to count the number of objects in a geographical layer. Theplugin’s operating procedure is commented on in the code.
Theplugincan then be called upon in two ways:
– or the plugin is externalized in a JAVA (.jar) archive. In that case, the developer must write a specific Extension class which will become the interface. This class will initialize one or many plugins which will be in charge of launching the platform through thepluginmanager. The compiled.jar
file must be placed in the extdirectory located in the folder containing the compiled ORBISGIS libraries.
2.4.1.2. Manipulating data
Geographical data manipulation in ORBISGIS is carried out through the use of two application programming interfaces (API):
– the GDMS API;
– the ORBISGIS-Core LAYERMODELAPI.
2.4.1.2.1. The GDMS API
The GDMS API is an abstraction layer that reads, writes, and processes geographical and alphanumerical objects. The data stored infiles or databases are encapsulated during the Source object declaration. If the Source object is a unique reference to a physical piece of data, it can, however, also point to a virtual piece of data. In that case, the view aggregates the data from the two sources.
public class CountFeaturesTOCMenu extends AbstractPlugIn { /**
* Method specifying the type of plugin to be built. * We are dealing here with a ‘‘Count objects’’ menu which will appear in the TOC when the user right-clicks **/
public void initialize(PlugInContext context) throws Exception {
WorkbenchContext wbContext = context.getWorkbenchContext(); WorkbenchFrame frame =
wbContext.getWorkbench().getFrame().getToc(); context.getFeatureInstaller().addPopupMenuItem(frame, this,
new String[] { "Count objects" }, wbContext); }
/**
* Method enabling us to specify the display conditions of the ‘‘Count objects’’ menu when right-clicking on a TOC layer **/
public boolean is Enabled() {
// The running MapContext is retrieved. It provides information
// on the number of layers loaded, etc...
MapContext mc = getPlugInContext().getMapContext(); if (mc != null) {
// If the number of layers is equal to 1 then // the plugin is visible.
if (mc.getSelectedLayers().length == 1) { return true; } }
return false; } /**
* Plugin execution method **/
public boolean execute(PlugInContext context) throws Exception {
MapContext mapContext = getPlugInContext().getMapContext(); ILayer[] selectedLayers = mapContext.getSelectedLayers(); // The GD M S object containing the layer data is retrieved. SpatialDataSourceDecorator sds = selectedLayers[0]
.getSpatialDataSource();
// The result is displayed in OR B I SGIS with // the OutputManager Window.
Services.getOutputManager().print(
"Number of objects: " + sds.getRowCount(), Color.RED); return false; } }
Table 2.2.Example of aplugincode inORBISGIS
– The Geometry object is a vectorial representation (Point,Line,Polygon) in the shape of a series of coordinates in (X,Y,Z). To manipulate geometries, GDMS uses the JAVA Topology Suite library9. The latter establishes the Simple Features SQL norm to describe the coordinates in WKT (Well-Known Text) or WKB (Well-Known Binary) and suggests spatial operators and predicates (Intersection, Union, Difference, etc.).
– The Raster object is an interface of the GeoRaster object, which is itself an overlay encompassing theImagePlus object of the IMAGEJ library10 as well as georeferencing metadata. Like the JAVA Topology Suite library, the IMAGEJ library is used to carry out processing on the image(s) contained in theGeoRasterobject: convolution, thresholding, object extraction, etc.
Data Source Metadata FieldType
Value Constraint
Value Collection Geometry String Integer Raster ... CRS Length Pattern Precision ...
Geo Raster Multi Point MultiLine String Multi Polygon
Geometry Collection Point Line String Polygon
Figure 2.8.Model of data used byGDMS[LED 09]
The DataSource object is manipulated in the following way:
–getRowCount()gives the number of rows.
–getFieldNames() gives the names of the fields in a table.
–getFieldIndexByName(String fieldName)gives the position of afield according to its name.
–getRow(long rowIndex) gives the table’s data line at the rowIndex index as a table.
–insertEmptyRow()gives a new empty row.
–insertFilledRow(Value[] values) adds a new line containing values.
–insertEmptyRowAt(long rowIndex) adds a new line according to the position.
–insertFilledRowAt (long rowIndex, Value[]
values) adds a new line with values according to the position.
–deleteRow(long rowIndex)deletes a line of data.
–getFloat (long rowIndex, int fieldIndex),
getLong (long rowIndex, int fieldIndex),
getInt(long rowIndex, int fieldIndex), etc., give the value of afield on a given line of data.
Let us mention that to interact with the [DataSource] object, the developer must rely on three methods:
–open(): open the driver linked to the data source. This can be authorized in reading and writing mode.
–commit(): save the modifications on the data source. –close(): close thedriver.
DataSourceFactory dsf = new DataSourceFactory(); dsf.executeSQL("SELECT ST_BUFFER(the_geom, 20)
FROM parcel WHERE type = ’prairie’;");
The instruction execution is delegated to GDMS’s internal SQL engine that analyzes syntax and builds the operator chain necessary to the query. In SQL, the developer takes advantage of the functions available in GDMS (ST_Buffer, ST_Area, StringToDouble, etc.). However, he/she can also extend the SQL syntax by adding his/her own functions. In that case, he/she writes a new class implementing the Function interface. This class must then be saved in the function manager to be recognized by GDMS[BOC 08b].
2.4.1.2.2. The LAYERMODEL API
The LAYERMODEL API is the link between the physical piece of data interpreted by GDMS and its graphical representation. It formalizes the concept of geographical layer that corresponds in our case to a data source and a set of legends.
A legend is a collection of symbols. Five classes of “primitive” symbols are provided by the API: the PointSymbol, the LineSymbol, the PolygonSymbol, the LabelSymbol, and the ImageSymbol. The developer then expands on them to design more complex symbols.
public class CirclePointSymbol extends PointSymbol { int size = 1;
CirclePointSymbol(Color outline, int lineWidth, Color fillColor, int size, boolean mapUnits) {
super(outline, lineWidth, fillColor, mapUnits); this.size = size;
}}
To end this presentation of LAYERMODEL, we will comment the next pseudo-code which allows us to load a layer of polygons in ORBISGIS. Polygons are represented with a red
filling color, a three-pixel thickness and a yellow outlining color.
// Retrieve OR B I SGIS’s source management and create a // new layer containing a shapefile and a
// default legend
ILayer layer = getDataManager().createLayer
(new File("src/test/resources/data/bv_sap.shp"));
// Create a legend containing a single symbol UniqueSymbolLegend legend
// Create the adapted symbol
Symbol polygonSymbol = SymbolFactory.createPolygonSymbol (outlineColor, lineWidth, fillColor);
// Assign the symbol to the legend legend.setSymbol(polygonSymbol);
// Assign the legend to the layer layer.setLegend(legend);
2.4.2. Graphical interface
ORBISGIS is an entirely modular multiscreen application. All its windows can be added, deleted, resized, and dissociated from the general interface. The user is the one who shapes the interface to his needs.
However, for a basic operating ORBISGIS, the user must manipulate the four components (Figure 2.9) presented.
Figure 2.9.Display of two “map” views, as well as the basic ORBISGIScomponents:TOC,GeoCatalog,GeoCognition
2.4.2.1. The GeoCatalog
The GeoCatalog object is the window allowing us to connect, in ORBISGIS, geographical and alphanumerical data that will be displayed in the “map” or attribute windows.
2.4.2.2. The GeoCognition
in directories created by the user. The GeoCognition also contains all the available functions in the GDMS library.
2.4.2.3. The Map and the TOC
The “map” view is the visualization window of geographical data. It allows us to navigate, zoom, and edit objects. The TOC corresponds to the layer manager. It allows us to order the display of layers and access the functions of a layer by right-clicking on it. This is the case, for example, when the user wishes to modify a legend. However, unlike the “map” view where the user can create multiple instances, theTOCis a single window whose content is refreshed according to the active map.
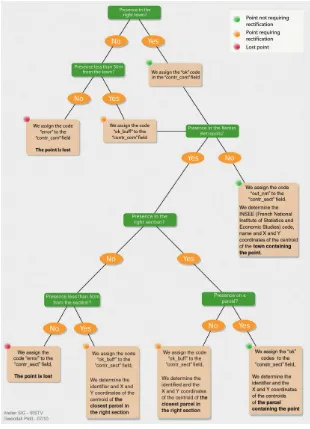
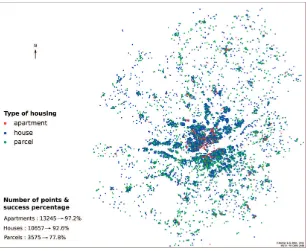
2.5. Examples of use
In this section, we present three examples of how ORBISGIS is used. The first is a diachronic spatial analysis of urban sprawl, the second is a spatial hydrologic analysis, and finally the third is data geolocation. These applications are far from exhaustive, but they show the platform’s possibilities, ranging from the use of spatial operators on vector data or the use of mixed data in SQL (raster and vector) to the design of a query chain to geolocate the data of an address at a parcel level.
2.5.1. Spatial diachronic analysis of urban sprawl
Our example will focus on the Nantes metropolitan area. We will apply a set of SQLinstructions whose final goal is to produce a synthesis map translating the evolution (gain–loss) of urbanized areas. Table 2.3 lists the data used as well as the names of the layers (tables) used in the SQLqueries.
Data Geometry Layer Name
Zoning database (Z-DB), produced by the Polygon and - zbd99 Loire-Atlantique local authorities multipolygons - zbd04
for the years 1999 and 2004
Towns in the Nantes metropolis Polygon - com_nantes
Table 2.3.List of data used
The processing chain, executed in the ORBISGIS console, can be divided into four major steps:
– selecting urbanized surface and dividing the Nantes metropolis area for 1999 and 2004;
– unifying the urbanized surface by town for 1999 and 2004;
– calculating the urbanized surfaces and density for 1999 and 2004;
– comparing the two years (1999 and 2004) and calculating the surface and density difference.
The script executed in the SQL console is presented in Tables 2.4 and 2.5.
-- A- Extract the urbanized surface (C_NIVEAU =1) by town -- For 2004
CREATE TABLE Z04_urb_nm as SELECT ST_INTERSECTION (a.the_geom, b.the_geom) AS the_geom, a.CODE_INSEE FROM com_nantes a, zdb04 b
WHERE ST_INTERSECTS(a.the_geom, b.the_geom) AND b.C_NIVEAU=1;
-- For 1999
CREATE TABLE Z99_urb_NM AS SELECT ST_INTERSECTION (a.the_geom, b.the_geom) AS the_geom, a.CODE_INSEE FROM com_nantes a, zdb99 b
WHERE ST_INTERSECTS(a.the_geom, b.the_geom) AND b.C_LEVEL=1;
-- B- Calculate the urbanized surface in each town -- For 2004
CREATE TABLE stats_04 AS SELECT SUM(ST_Area(the_geom)) AS sum_surf04, CODE_INSEE FROM Z04_urb_NM GROUP BY CODE_INSEE; -- For 1999
CREATE TABLE stats_99 AS SELECT SUM(ST_Area(the_geom)) AS sum_surf99, CODE_INSEE FROM Z99_urb_NM GROUP BY CODE_INSEE;
-- C- Join the town table and the surface table -- For 2004
CREATE TABLE join_04 AS SELECT a.*, b.sum_surf04 FROM com_nantes a, stats_04 b
WHERE a.CODE_INSEE = b.CODE_INSEE; -- For 1999
CREATE TABLE join_99 AS SELECT a.*, b.sum_surf99 FROM com_nantes a, stats_99 b
WHERE a.CODE_INSEE = b.CODE_INSEE;
-- D- Calculate the urbanized surface density (in %) per town
-- For 2004
ALTER TABLE join_04 ADD COLUMN density_urb04 NUMERIC; UPDATE join_04 SET density_urb04
=((sum_surf04/ST_AREA(the_geom))*100); -- For 1999
ALTER TABLE join_99 ADD COLUMN density_urb99 NUMERIC; UPDATE join_99 SET density_urb99
=((sum_surf99/ST_AREA(the_geom))*100);
-- E- Calculate the evolution of the urbanized surface between 2004 and
-- 1999. Create a new layer which represents the -- urbanized surface variation
CREATE TABLE Evol_Z_urban AS SELECT a.*except sum_surf99, density_urb99, (b.sum_surf04 - a.sum_surf99) AS diff_area FROM join_99 a, join_04 b WHERE a.CODE_INSEE=b.CODE_INSEE; -- Add a new field called "diff_density" representing -- the difference in density
ALTER TABLE Evol_Z_urban ADD COLUMN diff_density NUMERIC; -- Update this field
UPDATE Evol_Z_urban SET diff_density= ((diff_area/ST_AREA(the_geom))*100);
Table 2.5.SQLscript of the analysis of the urbanized surface evolution (part 2)
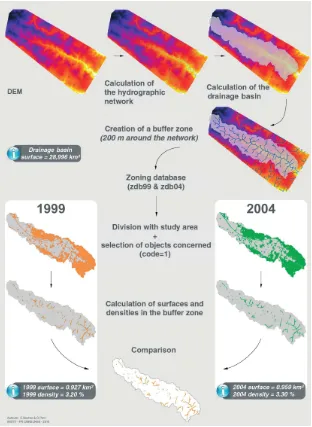
2.5.2. Spatial hydrologic analysis
rasteris produced by triangulating contour lines of SCAN 25 (IGN, the French National Geographic Institute). It covers the peri-urban drainage basin of the Chézine, northwest of the Nantes city.
Figure 2.11.Urbanized surface evolution analysis method around a theoretical hydrographic network. For a color version of thisfigure,
The first processing sequence is the production of a topographical pixel orientation grid according to D8 strongest slope calculation method, then an accumulation lattice [OCA 84]. To guarantee the hydrologic continuity of surface runoff, the DTM isfirstfiltered by using the algorithm proposed by [PLA 02]. The sequence is presented as follows:
-- Filtering the DTM to fill depressions
CREATE TABLE filled AS SELECT ST_FillSinks(raster, 0.1) AS raster FROM DEM;
-- Creating an orientation grid for pixels
CREATE TABLE dir AS SELECT ST_D8Direction(raster) AS raster FROM filled;
-- Creating an accumulation latticed based on the pixel -- orientation grid
CREATE TABLE acc AS SELECT ST_D8Accumulation(raster) AS raster FROM dir;
Following this, a theoretical hydrographic network is calculated by linked pixels whose accumulation value is over 1,500. The pixels obtained are organized along the Strahler stream order classification. After being vectorized, only the geometries whose order is below 6 are retained:
-- Extract organize pixels whose accumulation -- value is over 1500
CREATE TABLE strahler AS SELECT ST_D8StrahlerStreamOrder (d.raster, a.raster, 1500) FROM dir d, acc a;
-- Vectorize pixels
CREATE TABLE allrivers AS SELECT ST_VectorizeLine() FROM strahler;
-- Filter the geometries whose Strahler stream order -- is below 6.
CREATE TABLE rivers_low_6 AS SELECT * FROM allrivers WHERE order<6;
A 200 m buffer zone is then created:
In parallel, after identification of the geographical coordinates of its outlet, the drainage basin of the Chézine is extracted:
CREATE TABLE basin AS SELECT ST_D8Watershed(raster, GeomFromText(’POINT (303172.520884 2254429.11725)’))
AS the_geom FROM dir;
The final step consists of dividing land use modes for the years 1999 (z99) and 2004 (z04) in the limit of the drainage basin. Only the geometries whose C_Level field values are equal to 1 are kept. This value corresponds to urbanized areas.
-- For 1999
CREATE TABLE z9_urb_bv AS SELECT ST_INTERSECTION
(a.the_geom, b.the_geom) AS the_geom, a.*EXCEPT the_geom FROM z99 a, basin b WHERE ST_INTERSECTS(a.the_geom, b.the_geom) AND a.C_LEVEL=1;
-- For 2004
CREATE TABLE z04_urb_bv AS SELECT ST_INTERSECTION
(a.the_geom, b.the_geom) AS the_geom, a.*EXCEPT the_geom FROM z04 a, basin b WHERE ST_INTERSECTS(a.the_geom, b.the_geom) AND a.C_LEVEL=1;
The reader will note that the instructions hold the keyword EXCEPT. This keyword was introduced into the ORBISGIS SQL language to facilitate column filtering. So if the user wishes to select fields a, b, c, d,. . . , i, j in a table without selectingfieldsgandh, he/she will write:
– either SELECT a, b, c, d, e, f, i, j FROM my_layer;
– orSELECT *{EXCEPT g, h} FROM my_layer.