18 CHAPTER III
METHOD OF THE RESEARCH
In this chapter the researcher discusses design of the research, population and sample, instrument of the research, data collection and data analysis.
3.1 Design of the Research
According to Arikunto (2006:84) research design is a design made by researcher as the guidance in carrying out the research. The research design aims to give responsibility for setting the next steps to make the result more accurate and objective. While Ali (1984:72) states that In doing a research, a researcher should arrange a research design in order to make the research more effective, efficient, logic, and systematic.
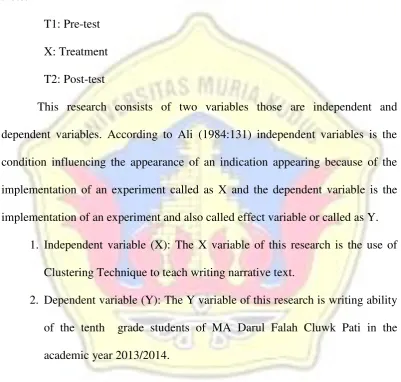
Pretest Treatment Posttest
T1 X T2
Table 3.1 Pattern of one group Pre-test Post-test
Note:
T1: Pre-test X: Treatment T2: Post-test
This research consists of two variables those are independent and dependent variables. According to Ali (1984:131) independent variables is the condition influencing the appearance of an indication appearing because of the implementation of an experiment called as X and the dependent variable is the implementation of an experiment and also called effect variable or called as Y.
1. Independent variable (X): The X variable of this research is the use of Clustering Technique to teach writing narrative text.
2. Dependent variable (Y): The Y variable of this research is writing ability of the tenth grade students of MA Darul Falah Cluwk Pati in the academic year 2013/2014.
3.2 Population and Sample
MA Darul Falah Cluwak Pati in the academic year 2013/2014. The number of population is 138 students.
According to Ali (1984: 54) sample is a part of representative of population. In taking sample in this research, the writer used cluster random sampling technique through lottery. In conducting this technique, the writer made four role of papers that are class XA, XB, XC, XD. Then the writer choosed one role paper ramdomly to decide the class. Finally the researcher got class XC that consist of 28 students.
3.3 Instrument of the Research
In collecting the data for the research, the researcher need a research instrument. According to Arikunto (2006:149) instrument is a means to collect data. Arikunto (2006:150) categorized two types of instrument, test and non test. He also said that test is a series of questions or exercises used to measure skills, knowledge, intelegences, abilities, or talent possessed by individual or group. While non test includes giving questionare, interview, observation, arting skill and documentation.
No Aspect Score Description 1 Content 5 Bear almost no relation to the task
10 Limited relevance to the task 15 Mostly answer the task
20 Relevant and adequate answer to the task 2 Organization 5 No apparent organization of the content
10 Very little organization of content. Underlying structure not sufficiently apparent
10 Frequent inadequacies in vocabulary for the task. Perhaps frequent lexical inappropriate and/or repetition
15 Some inadequacies in vocabulary for the task. Perhaps some lexical inappropriate and/or circumlocution
20 Almost no inadequacies in vocabulary for the task. Only rare inappropriate and/or circumlocution
4 Grammar 5 Almost all grammatical pattern inaccurate 10 Frequent grammatical inaccurate
15 Some grammatical inaccurate 20 Almost no grammatical inaccurate 5 Mechanical
accuracy (punctuation and spelling)
5 Ignorance of conventions of punctuation. Almost all spelling inaccurate
10 Low standard of accuracy in punctuation and spelling
15 Some inaccuracy in punctuation and spelling 20 Almost no inaccuracy in punctuation and
spelling
3.4 Data Collection
To make this research successful, the researcher conducted the several steps of collecting data:
1. The researcher asked permission to the Dean of Faculty of Teacher Training and Education of University Muria Kudus.
2. The researcher asked permission to Head master of MA Darul Falah Cluwak Pati.
3. The researcher gave Pre-test to the tenth grade students of MA Darul Falah Cluwak Pati in the academic year 2013/2014.
4. The researcher taught writing narrative text by using clustering technique to the tenth grade students of MA Darul Falah Cluwak Pati in the academic year 2013/2014.
5. The researcher gave Post-test to the tenth grade students of MA Darul Falah Cluwak Pati in the academic year 2013/2014.
6. The researcher analyzed result of Pre-test score and Post-test score.
3.5 Data Anaysis
Based on statement of the problem stated in the previous chapter, the data should be analyzed are:
1. Score of pre–test is test used before using Clustering as a technique of teaching English to increase writing ability.
In analyzing the scores using t-test, the researcher should find out the Mean and the Standard Deviation of both the pretest and posttest score. To find out mean and standard deviation the researcher uses formula by F. Healy (2005_:98), as follow:
=
∑(𝑓𝑚) 𝑁Notes:
= Mean
∑ fx = The sum of fm (f = frekuensi, m = midpoints)
N = The number of students
S
=
∑𝑓 𝑚−2
𝑁
Notes:
S = Standard Deviation
f = Frekuensi
m = Midpoint = Mean
N = The number of students
Notes:
t = the t-value for dependent (correlated) means
D = the mean of the differences
D = the difference between the paired score 2
D
= the sum of the squared difference scores
N = the number of sample
To find out whether there is significant different between the ability of the tenth grade students of MA Darul Falah Cluwak Pati in the academic year 2013/2014 in writing narrative text before and after being taught by using Clustering technique, the hypothesis testing was done by using the following steps:
1. Stating the null hypothesis H0: µ1 = µ2
It means “there is no significant difference between the ability of the tenth grade students of MA Darul Falah Cluwak Pati in the academic year 2013/2014 in writing narrative text before and after being taught by using Clustering technique”.
(Ha: µ1≠ µ2)
writing narrative text before and after being taught by using Clustering technique”.
Where:
µ1 : Writing ability of tenth grade students of MA Darul Falah
Cluwak Pati in the academic year 2013/2014 before being taught by using clustering technique.
µ2 : Writing ability of tenth grade students of MA Darul Falah
Cluwak Pati in the academic year 2013/2014 after being taught by using clustering technique.
2. Selecting the sampling distribution and establishing the Critical Region Sampling distribution = t distribution
Level of significance ( ) = 0.05 two tailed test Degree of fredom (df) = N-1
t (critical) = ± 2.052 3. Computing the test statistic
It can be computed by using formula
(t)=
𝐷𝛴𝐷2 − (𝛴𝐷)2
𝑁 𝑁 (𝑁−1)
4. Making a decision and interpreting the results