Adaptation to Temporal Shocks: Influences of
Strategic Interpretation and Spatial Distance
Liliana Pérez-Nordtvedt, Susanna Khavul,
David A. Harrison and Jeffrey E. McGee
The University of Texas at Arlington; The University of Texas at Arlington; The University of Texas; The University of Texas at Arlington
ABSTRACT Even when shocks in a firm’s environment are predictable, their consequences are
not. Using the relocation of the Dallas Cowboys Stadium as a rich case of such a disruption, we investigate how combinations of strategic interpretation and spatial distance influence incumbent business owners’ decisions to pursuetemporal adaptationas a response. Temporal adaptation (TA) comprisestimingrather thancontentchanges by the firm seeking to adjust to the reconfigured environment. Survey data from 168 business owners show that strategic interpretation directly influences TA decisions. However, the effect of strategic interpretation on the TA decision is moderated by the spatial (geographic) distance of the incumbent firm from the locus of the disruption. Furthermore, results suggest that through strategic interpretation, spatial distance also indirectly affects the business owners’ decisions to make temporal changes. Data collected 1.5 and 4 years later suggest that TA responses are related to performance and may be indicative of a particular type of TA, organizational entrainment (OE), which concerns the synchronization of organizational activity cycles with cycles in the environment.
Keywords: opportunity, spatial distance, strategic adaptation, strategic interpretation, temporal adaptation intentions, threat
INTRODUCTION
With the football games . . . it’s just going to be a myriad of people coming to this area and we’re already talking about maybe buying some vans and putting product things on there and helping move people with whatever. We will be having countries come in with their teams . . . So it’s going to be not only a national thing, but it’s an international opportunity . . . It’s been plastered on the news . . . this is the place to be. (Arlington business owner)
Address for reprints: Liliana Pérez-Nordtvedt, Department of Management, The University of Texas at Arlington, UTA Box 19467, Arlington, TX 76019, USA ([email protected]).
© 2013 John Wiley & Sons Ltd and Society for the Advancement of Management Studies
I’ve experienced . . . the impact of the [Rangers] Ballpark in North Arlington . . . When the new stadium was built it became a black hole for sales. My actual location, which was right by the old ballpark, declined significantly the first two years even when the traffic went up. The reason it declined is because . . . [the Ballpark] became self-contained. And I believe the same thing is going to happen with the Cowboys Stadium. (Arlington business owner)
Both quotes come from in-depth interviews with business owners talking about their perceptions of a major and enduring disruption in their local environment. Yet, as the comments illustrate, prior to the disruption, business owners were interpreting its effect on their firms differently, even though its occurrence was certain. That disruption is not a direct competitor’s entry ( Jia, 2008), a gradual increase/decline of ambiguous market forces (Milliken, 1990), a revolutionary technology’s introduction (Tushman et al., 1985), or an unanticipated ‘jolt’ (Meyer, 1982). Instead, the phenomenon is clear, known, and uncontested, but it involves an interwoven set of spatial and temporal disruptions in the incumbent firms’ environment.
The specific shock addressed by the business owners quoted above is the physical relocation of the Dallas Cowboys football franchise to a mammoth, multi-billion dollar entertainment complex in Arlington, Texas, USA. Specifically, the construction and completion of the Stadium along with surrounding infrastructure development (e.g. highway interchanges) marked a shift in the spatial and temporal environment within which local businesses would operate. When disruptions of this and similar scale occur, they spark multiple and potentially critical new market forces. Whether business owners interpret disruptions as either opportunities, threats, or both affects their intended responses, including those which are temporal in nature.
To date, however, research on intended responses of firms to environmental disrup-tions has focused on the ‘what’ and ‘how’ of strategic adaptation but rarely on the ‘when’. This is an important omission in the adaptation literature because the temporal lens ‘offers its own set of variables and relationships, its own view of specific phenomena, and its own set of parameters to guide managerial action’ (Ancona et al., 2001, p. 645). Our distinct contribution is to show how temporal adaptation (TA) serves as a viable response to disruptions in an incumbent firm’s environment, when such disruptions shift dominant cycles of activity. We build and test a model that examines how the combination of strategic cognition and spatial distance (i.e. the geographic distance between the incum-bent firm and the locus of the disruption) influence the degree to which business owners decide to embrace or shun newly created business rhythms. We argue that when the temporal environment of a firm is primed to change, TA is a useful tool in the repertoire of adaptive responses. Moreover, TA is viable not just when the entrant is a direct competitor, but also under conditions of uncertainty about who is and who is not a competitor.
newly created market cycles and exploit the change. Second, using a sample of 168 firms facing an environmental disruption, we build a model of the antecedents of TA inten-tions. Drawing on the strategic cognition literature (Chattopadhyay et al., 2001; Thomas et al., 1993; Weick et al., 2005), the threat rigidity hypothesis (Staw et al., 1981), and the behavioural theory of the firm (Cyert and March, 1963; Ketchen and Palmer, 1999), we suggest that TA responses depend on whether business owners perceive the environ-mental disruptions as opportunities, threats, or both. In modelling such responses, we also examine the moderated and mediated effects of spatial distance on TA intentions. Using construal level theory (Trope and Liberman, 2003), we propose that distance differentially regulates the impact of interpretation on TA decisions. Results show that greater levels of TA intentions occur when perceived opportunity is paired with prox-imity and when perceived threat is paired with remoteness. We also argue that spatial distance indirectly affects TA intentions through interpretation. Third, follow-up, quali-tative data provide some support for our claims of the importance of TA intentions. Small, follow-up subsample data, collected 1.5 years after the original data, indicate that TA was associated with subsequent perceived improvements in firm performance. Furthermore, qualitative data collected 4 years after the original data collection suggest that many of the TA changes undertaken were entrainment-like in nature (Pérez-Nordtvedt et al., 2008). Organizational entrainment (OE) captures the synchronization of organizational activity cycles with those cycles in the environment. Finally, we convey when and why TA matters. In particular, we cast TA as a form of adaptation that can be especially useful to entrepreneurial firms.
THEORY
How organizations cope with the changing environment and its impact on strategies, structures, processes, and performance has been the subject of considerable theoretical and empirical investigation (e.g. Goll and Rasheed, 2011; Hambrick and D’Aveni, 1988; Zuniga-Vicente and Vicente-Lorente, 2006), but remains contentious (Hrebiniak and Joyce, 1985). On the one hand, population ecologists assert that natural selection, rather than managerial choice, shapes organizational characteristics (Hannan and Freeman, 1984). Firms with characteristics that best fit the environment survive, prosper, and replicate. Organizational inertia makes it difficult, if not impossible, for managers to implement adjustments. By contrast, strategic choice theory emphasizes rational adap-tion to environmental changes (Child, 1972). Successful adaptaadap-tion depends on decisions of managers who identify opportunities and threats, develop strategies, assemble resources, and demonstrate initiative. Adaptation follows from conscious, explicit deci-sions managers make to position their organizations in the (soon-to-be) altered environ-ment. This perspective is relevant to understanding the interplay between environmental events and subsequent organizational responses. Here, managerial interpretation of disruptive events influences action (Chattopadhyay et al., 2001).
Rasheed, 2011) companies all became more competitively aggressive after their indus-tries were deregulated. Similarly, hospitals (Meyer et al., 1990), restaurants ( Julian et al., 2008), and small hardware stores (Litz and Stewart, 2000) all adapted to environmental changes in their industries.
For the most part, scholars have studied firms’ changes to the content (e.g. how to compete and what processes to adopt) or thestructure(e.g. what design and organization to use) to realign themselves to environmental shifts (Ginsberg and Venkatraman, 1985). Modification to thetimingof activities as a strategic response has received less attention (for an exception, see Litz and Stewart, 2000). The limited literature addressing temporal responses to environmental changes largely focused on micro-level, internal activities (e.g. changes in work rhythms within organizations) or how time itself acts as a stimulus for change (Staudenmayer et al., 2002). Therefore, important macro-level research questions remain. Specifically, when environmental disruptions change the temporal environment, are business owners likely to consider temporal adaptation (TA) as a means to respond? If so, what determines such a decision? Are firms in the environment likely to engage in such TA? And, can TA be effective?
To answer these questions, we propose and test a model of TA intentions of incumbent firms in response to a temporal disruption created by a new entrant (see Figure 1). Our specific context, the physical relocation of the Dallas Cowboys Stadium complex to Arlington, Texas, involved a major change in the incumbent firms’ ecosystem (e.g. increased traffic congestion, greater notoriety of Arlington, influx of new customers, etc.). Certainly, incumbent firms could have and likely did respond to the disruption with content changes (e.g. adding new services/products, providing promotions linked to the Stadium, selling parking spots, relocating).
timing and cycles of the Stadium’s events (primarily fall/winter weekends and evenings throughout the year) were out of phase with concurrent business cycles in Arlington (late spring through summer daily). Consequently, the Stadium had the power to impose a new clock on the environment it was joining. In light of this, we argue that when the disruption involves a major, dominant, new entrant, whether a competitor or not, who brings a new calendar, schedule, or rhythm to the ecosystem, TA is a salient response. Choosing TA to synchronize with the Stadium’s activity schedule (e.g., changing or extending opening hours) can allow firms to capture value from the disruption. More-over, TA can be less expensive and disruptive than content-type adaptations, making it an attractive option for small business owners. As Figure 1 shows, we first suggest that business owners’ perceptions of the expected consequences from a disruption drive their TA intentions. We theorize and test the effect of spatial distance as it ripples outward from the epicentre of the temporal disruption. We conjecture that, together, time and space create complexly determined reactions from firms. Lastly, we evaluate over time the linkage of TA with firm performance, and explore whether TA is indicative of organizational entrainment (OE).
HYPOTHESES
Strategic Interpretation and TA Intentions
and threat interpretations can have differential impact on business owners’ decisions to seek TA.
Perceived opportunity and TA intentions. Opportunities are situations with likely positive outcomes (Dutton and Jackson, 1987). Framing an event as an opportunity directs business owners to new possibilities the event presents. Such framing opens search processes (Dutton, 1993), encourages consideration of a wider range and a more flexible set of possible actions (Sharma, 2000), prompts the crafting of new alternatives (Hambrick and Mason, 1984; Sharma, 2000), and leads to more extensive implemen-tation of organizational change (Kennedy and Fiss, 2009). As a consequence, firms that see change as an opportunity will decide on reactions that improve their competitive position relative to rivals. Indeed, when managers frame an event as an exploitable opportunity, they deploy more resources (Mullins and Walker, 1996; White et al., 2003) and take more forceful strategic actions (Sharma, 2000). Moreover, extensive implemen-tation of organizational change is significantly more strongly associated with the desire to achieve gains than the desire to avoid losses (Kennedy and Fiss, 2009). Thus, business owners who perceive a disruption that creates new rhythms as an opportunity would likely decide on TA.
Hypothesis 1: Perceived opportunity is positively related to TA intentions.
Perceived threat and TA intentions: the threat-rigidity hypothesis. Threats represent situations with likely negative outcomes (Dutton and Jackson, 1987). Theory addressing how managers interpret and respond to threats has dual emphases. One thesis suggests that framing external events negatively can induce a ‘threat-rigidity’ response (Staw et al., 1981), a situation in which decision-makers exhibit risk-averse behaviour and become unwilling to change behaviour in response to the threat (Bettis and Prahalad, 1995).[1]The
threat-rigidity perspective predicts that framing an environmental event negatively may focus decision-makers’ attention on the potential losses, make them less receptive to potential solutions, inflexible, and unwilling to respond or adapt (D’Aunno and Sutton, 1992). As a consequence, managers facing a perceived threat may simplify their decision-making, reduce the alternatives they consider, centralize authority, formalize procedures, and standardize processes (Chattopadhyay et al., 2001; Staw et al., 1981). To avoid losses, decision-makers fall back on familiar routines and resist making changes to their business practices (Kennedy and Fiss, 2009). This phenomenon may be particularly prevalent in small firms that often demonstrate the ‘deer in the headlights’ response to environmental threats (Dewald and Bowen, 2010). Thus:
Hypothesis 2a: Perceived threat is negatively related to TA intentions.
Perceived threat and TA intentions: the behavioural theory of the firm. The behavioural theory of the firm (Cyert and March, 1963) suggests the opposite connection between perceived threat and TA intentions.[2] Instead of inaction and paralysis, the possibility of not
drive the firm to implement new activities that challenge the status quo (Ketchen and Palmer, 1999). Under this perspective, higher levels of perceived threat are likely to lead to a search for solutions and adaptation (Argote and Greve, 2007). Furthermore, because the business owner is likely to select unfamiliar options to address anticipated setbacks in meeting performance expectations (Ketchen and Palmer, 1999), the behavioural theory of the firm suggests that changes in the timing of organizational activities may become a unique part of the repertoire of actions. Indeed, Staudenmayer et al. (2002, p. 583) found that unusual events ‘alter entrenched organizational rhythms’. Therefore, a competing hypothesis can be forwarded:
Hypothesis 2b: Perceived threat is positively related to TA intentions.
Strategic Interpretation and TA Intentions: The Moderating Role of Spatial Distance
We further predict thatconsiderations of time depend on space. Strategic interpretation has a complex relationship with TA intentions. Specifically, that relationship depends – in different ways according to the valence of the interpretation – on the spatial distance an incumbent firm has from the locus of the environmental disruption. Economics and psychology both suggest the moderating role of spatial distance. Economists argue that distance is the underlying surrogate of three different sets of relevant issues. First, distance increases the transaction, coordination, and information costs for economic activity and resource exchange between actors (Krugman, 1991; Rosenthal and Strange, 2001). Second, proximity to the disruption is likely to increase the interaction between it and the firm (Fellmann et al., 1997), increasing the amount and accuracy of informa-tion[3]about the new temporal environment and reducing the costs of synchronization.
For instance, nearby firms are more likely to get information through informal contacts who can be employees or customers at the Stadium (or who know them). Lastly, when the source of the disruption occupies a prominent location in the flows of economic activity, not only will customers be drawn into its orbit, but they will also engage in economic activity not far from it (Horton and Reynolds, 1971). Firms close to the locus of change are likely to recognize that, once there, customers are unlikely to venture far and stray from established routes of trade, and are likely to stay within the boundaries of their own prior patterns of movement (Gonzalez et al., 2008). Thus, we expect that the transaction, coordination, and information costs of TA to the new rhythms created by the disruption will be higher, while information accuracy and residual resource flows will be lower for more distal firms than for more proximal ones, tempering the positive effects of perceived opportunity on TA intentions.
even more so as the opportunity is seen as psychologically near (Ledgerwood et al., 2010; Trope et al., 2007). Importantly, positive affectbroadensone’s awareness andbuildsa wide variety of exploratory thoughts and actions (Fredrickson, 2001; Fredrickson and Branigan, 2005), such as novel ways to adapt to a (positively viewed) environmental shock. In contrast, construal level theory suggests that the negative emotions associated with negatively valenced objects prompts narrower, ‘tunnel vision’ thinking and responses, particularly when that threat is psychologicallynear. Asymmetric to perceived opportunity, when threats are experienced at greater distances, they are evaluated at a higher level of abstraction (construal) and cognition. This higher level of abstraction allows a perceiver to engage in more expansive, rational, and structured processing about that object, which in turn allows more and longer-term, goal-relevant thinking and flexible responses.
Perceived opportunity and TA intentions: spatial distance as moderator. With economics and psychology in mind, how do the variability in information (its cost and accuracy), customer flows, and the level of abstraction (construal) of the temporal disruptor affect the relationship between interpretation and TA intentions? Let us start with opportunity perceptions. Suppose there are two hypothetical business owners who perceive an environmental shift as an opportunity for their firms. However, one of the firms is close to the shock and the other one is further away. As argued earlier, because of their opportunity framing, both business owners will be more likely to actively search for information and be more open to processing its meaning (Dutton, 1993). Hence, they will seek out alternatives and be more receptive to pursue TA (Hambrick and Mason, 1984; Kennedy and Fiss, 2009; Sharma, 2000). However, the business owner whose firm is spatially nearer to the new entrant creating the temporal shift would obtain clearer, more actionable, and finer-grained information about the disruption. Because of the a priori positive interpretation of the disruption, its construal would expand his/her way of thinking about the disruption itself (Fredrickson, 2001), broadening and building the consideration of more (novel) actions that might be adaptive (Trope and Liberman, 2003). As this proximal business owner’s firm is interacting more with the disruptor, compared to more distant counterparts, the business owner would be more likely to understand the way to achieve temporal fit to seize the opportunity that the disruption represents. Thus, with the same level of perceived opportunity, the nearby firm will decide to engage in greater levels of TA.
Hypothesis 3: Perceived opportunity has a weaker effect on TA intentions at longer spatial distances from the source of the disruption than at shorter spatial distances from it.
information inherent in the signals would be ignored (Bozeman and Slusher, 1979). Furthermore, according to construal level theory (Trope and Liberman, 2010), perceived threats that are seen as – perhaps evenfeltas – close by, will generate more negative affect and behavioural rigidity, with managers ploughing forward to execute existing strategies rather than pausing to more carefully consider all their adaptive options. The threat response will be to maintain their dominant behaviour, pursue the status quo, and avoid changes when the firm is spatially near to the disruption (Bettis and Prahalad, 1995). In other words, spatial closeness to the threat would prompt the business owner to ‘freeze’ more, focus internally on issues such as efficiency, and not adapt externally (Dewald and Bowen, 2010).
On the other hand, the business owner who perceives the disruption as a threat, but whose firm is distant from its pull, could have a different reaction. The perceived threat of the shock coupled with the higher level of construal would be evaluated in more abstract and strategic terms by business owners who are distant from the locus of the disruption (Trope and Liberman, 2010). That is, responses to them should be more carefully considered and aligned with strategic goals. At greater distances, with less physically looming changes in the environment, the business owner might feel less constrained (Staw et al., 1981) and consider a wider set of goal-relevant options. Thus, we expect that an increasing spatial distance neutralizes the paralysing effect of the perceived (and seemingly more imminent) threat posed by an environmental shift.
In other words, we propose that spatial distance works as the boundary determining under which conditions the threat-rigidity hypothesis and the behavioural theory of the firm coexist. Construal level theory would suggest that the threat-rigidity hypothesis applies to nearby firms and that the behavioural theory of the firm applies to distant firms. Hence, spatial distance ‘unfreezes’ the rigidity-type effect of threat and drives the business owners to engage in problemistic search, deciding on TA as a course of action.
Hypothesis 4: Perceived threat has a positive effect on TA intentions at longer spatial distances from the source of the disruption and a negative effect at shorter spatial distances.
Strategic Interpretation and TA Intentions: The Indirect Effect Role of Spatial Distance
When a new landmark of great visual size and reputation appears in the vicinity of a business owner’s firm, it is likely to be perceived as having an impact – negative, positive, or both – on the firm and thus it is likely to instigate some form of information processing. We expect that as spatial distance increases, it would mute signals from the environment – reducing their strength and the probability that they would be noticed and perceived as relevant, decreasing the likelihood of deliberate interpretation. Spatial closeness heightens ‘perceptual readiness and information-processing proclivities’ of strategic deci-sion makers (Ozcan and Overby, 2008, p. 440). We expect that the closer the focal business is to the locus of disruption, the more it will alert the business owner to its potential as an opportunity, a threat, or both.
Once such opportunity and threat interpretation takes place,thendecisions are made about how to adapt – in this case, temporally. In terms of TA, because firms have many environmental rhythms or pacers that they can adapt to, those that are close are likely to be interpreted as dominant and drive TA intention. In line with previous work on the organizational interpretation process (e.g. Daft and Weick, 1984; Thomas et al., 1993), we formally hypothesize the mediating role of interpretation between spatial distance and TA intentions. Specifically, business owners whose firms are spatially closer to the disruption will focus their attention on it, view it as an opportunity, threat, or both, and decide or not on TA. Therefore:
Hypotheses 5–6: Perceived opportunity (H5) and perceived threat (H6) mediate the relationship between spatial distance and TA intentions.
METHODS
Empirical Context
We tested our hypotheses in a specific context. The Dallas Cowboys, a professional American football team, is one of the most well-known and highly valued sports fran-chises in the world (Associated Press, 2008). Today, their stadium is located in the city of Arlington, Texas, which sits roughly in the geographic centre of what is commonly referred to as the Dallas/Fort Worth Metroplex (these two cities are about 32 miles apart). While Arlington’s population is less than 380,000 residents and its land area is less than 96 square miles (US Census Bureau, 2013b), the greater metropolitan area is over 9286 square miles and home to over 6.5 million residents (US Census Bureau, 2013a). To induce the franchise to move from Irving, Texas, another smaller suburban commu-nity within the Dallas/Fort Worth Metroplex, to Arlington, Arlington city leaders fast-tracked a series of financial and infrastructure improvement initiatives (e.g. tourism tax increases, rezoning, interstate highway interchanges; City of Arlington, Texas, 2004). The Stadium complex joined other ‘Fun Central’ venues in Arlington such as Six Flags over Texas amusement park, and the Texas Rangers Ballpark. At 104 million cubic feet, the Stadium is the largest enclosed sports facility in the world (Cowboys Stadium, 2013). It is surrounded by 200 acres of nearly 12,000 parking spots. It dominates the Arlington skyline. It has been the subject of media attention since construction began.
was that Jerry Jones (the Cowboys owner) got a ‘sweetheart deal’ from [Arlington] to ‘vacuum the wallets’ of event-goers by offering a full day’s activities, food, shopping, and other entertainment. In addition, the City of Arlington narrowly passed (54 per cent to 46 per cent) a sales tax referendum to finance US$325 million of the Stadium cost, which raised the relative prices of offerings purchased in Arlington (City of Arlington, Texas, 2006). Arlington officials and supporters also had to persuade state and county politicians to help fund US$1 billion in egress and access improvements on local highways (Dickson, 2004). Key to this paper, the Stadium served as a temporal disruptor of the ecosystem. The traditional seasonal cycle of the ‘Fun Central’ area mainly began around Memorial Day (late May) and mainly ended after Labor Day (beginning of September), when customers from the region attended theme parks and baseball games. However, football is played on Sundays or Monday nights in fall and early winter. Also, numerous concerts, sporting events (NBA All Star Game, Super Bowl), and college football rivalry games were hosted in the Stadium during fall and early winter. If sold out, such events would have meant upwards of 90,000 people coming to the area nearly every weekend from September through January.
Data
We tested our hypotheses using survey and archival data sources. Data were collected in phases. The first phase began in the Summer of 2008 before the Fall 2009 opening of the Stadium. We conducted 30-minute, on-site interviews involving 26 Arlington businesses, deliberately sampled to maximize variance in firm characteristics and distance from the Stadium, and thus to capture the broadest possible range of reactions. At the same time, lengthier (30–60-minute) interviews were conducted with proponents/opponents of the Stadium (e.g. representatives of the Cowboys, Six Flags over Texas, Arlington Chamber of Commerce, City of Arlington). These preliminary interviews dealt with overall per-ceptions, specific benefits and costs, and possible actions that firms might take in antici-pation of the Cowboys Stadium opening and the completion of surrounding infrastructure developments. They allowed us to populate and iteratively refine a survey protocol grounded in the language of the environmental shock.
a square root transformation for normalization; inter-quartile range was 1.7 to 5.5 miles), suggesting that the 168 sampled firms are those for whom the Stadium was not a theoretic abstraction but a concrete reality.
We administered the survey carefully. To avoid demand cues, we started by asking a series of open-ended questions about the local region, and segued to questions about how the Stadium and planned events could affect the respondent’s firm. At the end of the interview, business owners were asked to fill out a survey, which served as the data for our quantitative analyses.
We also collected follow-up data 1.5 and 4 years after we completed the initial survey data collection. In an effort to assess the impact that temporal changes had on firm performance, 1.5 years later, we requested follow-up interviews from our 168 sample firms. Sixty-three firms (or 38 per cent of the original sample) located near the Stadium agreed to participate. We created a brief interview with performance-related questions that we administered either over the phone or face-to-face. In addition, 4 years after our initial data collection, we reached out to 48 firms from our original sample to investigate whether or not TA intentions had translated into TA actions, and to evaluate the nature of the TA actions that had been taken. We used multiple interview questions that asked respondents about the Stadium’s impact on their firms, as well as questions regarding firms’ actual temporal changes in response to Stadium events. We obtained usable responses from 36, and richer, finer-grained data, which captured the form that TA actions took.
Hypotheses Testing Measures
To test our hypotheses, we used the following measures.
TA intentions. To measure TA intentions, we relied on our pilot interviews to identify possible temporal actions that business owners might make to adapt to the disruption in question. We asked respondents to indicate how much they would decrease/ increase the following time-related activities in response to the disruption: (1) ‘how long my business stays open each day’; (2) ‘how many days my business operates during the week’; (3) ‘how long my business’s busy or peak season will be’[4]; and (4) ‘the number
distribution. Although we hesitate to equate the sum to the scale anchors of an indi-vidual item, that means only 5 per cent would correspond to an average of ‘decrease’ (1.55–2.5) or ‘major decrease’ (≤1.50) across all items. Nineteen per cent of firms were in the upper portion, with 5 per cent corresponding to a ‘major increase’≥6.50 aver-aged all items, and 14 per cent to an ‘increase’: 5.5–6.45. The bulk of the firms were distributed between 2.5 and 5.5.
To further support construct validity, we note that this measure correlated (r=0.31, p<0.01) with a no/yes interview question about the business owners’ plans to change the timing of their business activities.[5]Although we did not explicitly map the temporal
disruption to each of the local firms’ timing changes, our stipulation about how to measure TA intentions is reasonable. No local major market player has its main season in the fall, nor attracts visitors to evening events as the Stadium would and has. As such, a desire to change the timing of the businesses’ activities in response to the Stadium is an effort at aligning or adapting to the temporal shock.
Perceived opportunity and perceived threat. Items for perceived opportunity and perceived threat were based on Thomas et al. (1993). Response options ranged from ‘none at all’ (1) to ‘a great extent’ (7). The items for perceived opportunity were: ‘. . . (1) mainly good for my business, (2) creating positive opportunities for my firm, and (3) providing benefits to my firm overall’. The items for perceived threat were: ‘. . . (1) is primarily a threat to my firm’s interests, (2) will make my business worse off in the future, and (3) puts competitive pressure on my firm’s goods/services’. Once more, respondents perceived the Stadium and the infrastructure development equivalently. Hence, we combined the responses into two 6-item scales for perceived opportunity (α =0.83) and perceived threat (α =0.75).
To assess the perceptual distinction between the two stimuli – Stadium v. infrastruc-ture – we compared CFA models combining them (for each of the three main constructs: opportunity, threat, and TA intentions). Fit statistics for that measurement model were
χ2=285.82 (df=206), RMSEA=0.08, CFI=0.95, and TLI=0.93. If business owners
were making notable perceptual distinctions between the two stimuli, it would create six factors. We fit a 6-factor model that mapped to the three constructs by the two ‘disruptor’ stimuli. The 6-factor model fit the data no better than the 3-factor model:χ2=280.97
(df=194), RMSEA=0.07, CFI=0.95, and TLI=0.81. The latter index penalizes for lack of parsimony. The change in fit was small and non-significant (χ2=4.85, df=12,
ns). Indeed the model had difficulty fitting, occasionally generating Heywood cases of correlations greater than 1.00 between the split (Stadium v. infrastructure) factors. Factor correlations for each (Stadium v. infrastructure) pair were consistently greater than r=0.85.
To assess common method variance (CMV), we conducted nested CFAs with our three main constructs. Our 3-factor model fit the data (see above). Other models involving more aggregated combinations of these constructs into two factors each created substantially worse fit: all χ2s>333.00 (df=208; improvement in fit χ2s
all>48.00 on 2 df for comparison to the 3-factor model; all CFIs<0.89 and all TLIs<0.88). A 1-factor model representing only CMV fit the data poorly:χ2=384.22
involving the three main constructs, proactiveness and controllability (see control variables below) showed discriminant validity. There were no strong cross-loadings. No factor correlations exceeded r=0.50, meaning there was no more than 25 per cent overlap in shared variance between these constructs.
Spatial distance. We operationalized spatial distance in terms of travel distance and com-puted it jointly from the latitude and longitude of the Stadium, and Reference USA provided the geocodes of the sampled firms.[6]We used GoogleTMMaps[7]to record the
mileage that someone would travel by car between our sampled firms and the Stadium (Boscoe et al., 2012; Wang and Xu, 2011). For a robustness check, we calculated travel
time which correlated with distance at r=0.89. As a form of cross-validation, we also calculated distance using MapQuest and Windows Live Local on a random 25 busi-nesses. Correlations between these, GIS, and GoogleTMMaps exceeded r=0.99, so we
relied solely on the latter.
Control variables. Our analyses also included a number of controls. We controlled for firm age and size. We square root-transformed age, as it had a moderate skew. Firm size was log transformed, as it had a more severe skew. We used a dummy variable to distinguish between firms in the entertainment industry (coded 1) and those in other retail and service industries (coded 0). We controlled for firm proactiveness by using the three like-named items from Covin and Slevin’s (1989) entrepreneurial orientation scale. Proactiveness also served as a marker variable to control for, and even eliminate, CMV, as it is uncorrelated with the focal variables and likely suffers from social desirability (Siemsen et al., 2010). We also included a two-item covariate to account for perceived controllability, as it likely affects business owners’ interpretation of the environmental change (Thomas et al., 1993). Finally, we controlled for whether the respondent voted for the previous sales tax referendum to support part of the Stadium’s cost (coded 1) or not (coded 0), and for whether or not the respondent was the current business owner (coded 1, 0).
RESULTS
Quantitative Results with the Full Sample
Table I shows means, standard deviations, and correlations. Although controllability is negatively correlated with perceived threat as expected (Thomas et al., 1993), correla-tions of controllability and proactiveness with all of the other main study variables are non-significant. Also, perceived opportunity and perceived threat, both measured at the same time and serving as potentially opposing concepts, were uncorrelated (r= −0.04, ns). This further shows that there is little evidence of any consistent or pernicious effect of CMV, acquiescence, or socially desirable responding on our survey of business owners.
Mean S.D. (1) (2) (3) (4) (5) (6) (7) (8) (9) (10) (11)
(1) Firm age 3.72 1.88
(2) Firm size 1.87 1.51 0.23**
(3) Firm industry 0.36 0.48 0.01 0.03
(4) Owner 0.86 0.34 −0.02 −0.11 −0.03
(5) Proactiveness 5.07 1.74 0.04 0.28** −0.08 0.07 (0.78)
(6) Supported tax referendum 0.48 0.48 0.16* 0.05 −0.04 −0.06 0.02
(7) Controllability 4.18 2.07 −0.05 0.11 −0.02 0.08 0.18* 0.02 (0.82)
(8) Spatial distance 1.83 0.69 −0.11 0.07 −0.00 −0.01 0.08 −0.04 0.12
(9) Perceived opportunity 4.96 1.20 −0.01 0.09 0.12 −0.04 −0.02 0.34** 0.07 −0.16* (0.83)
(10) Perceived threat 2.71 0.77 −0.15† −0.19* 0.04 −0.02 −0.03 −0.18* −0.17* −0.19* −0.04 (0.70)
(11) TA intentions 4.84 0.50 −0.01 −0.02 0.15* 0.02 −0.02 0.17* 0.09 −0.14 0.51*** −0.03 (0.83)
Notes: Coefficient alphas are on the diagonal. N=168; † p<0.10; * p<0.05; ** p<0.01.
Adaptation
to
Temporal
Shocks
883
John
Wiley
&
Sons
Ltd
and
Society
for
the
Advancement
of
Management
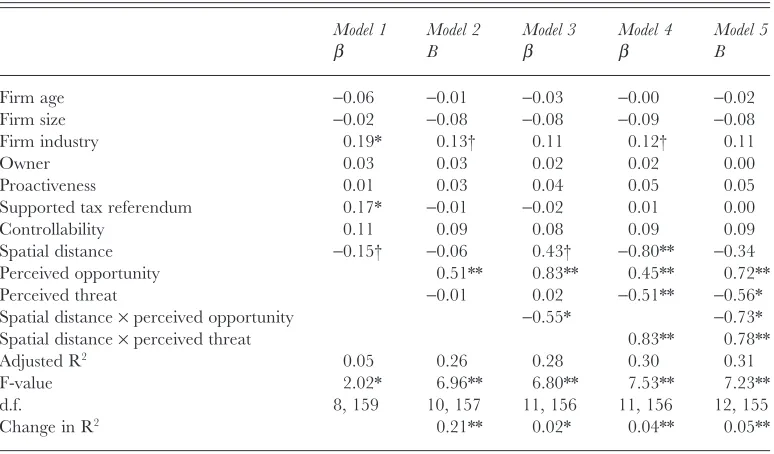
opportunity positively predicts TA intentions (β =0.51, p<0.01). Competing Hypoth-eses 2a and 2b are not supported (β = −0.01, p>0.05); perceived threat does not uniquely predict TA intentions. Thus, we do not find overarching support for either the threat-rigidity or the behavioural theory of the firm theses.
Table II, Model 5 shows results for Hypotheses 3 and 4. As Hypothesis 3 predicted, greater spatial distance weakened the positive effect of perceived opportunity on TA intentions (β = −0.73, p<0.05; see Figure 2a). In support of Hypothesis 4, business owners who perceived the arrival of the Stadium as a threat, but whose firms were located further away from the Stadium, were more likely to decide on TA than those business owners who perceived the same level of threat but whose firms were nearby (β =0.78, p<0.01; see Figure 2b). Each interaction explained an extra 2 per cent and 4 per cent of the variance in TA intentions (Table II, Models 3 and 4, respectively). Our fully specified regression model explained 31 per cent of the variance in TA intentions (Table II, Model 5). Equivalent results and support were obtained when we substituted travel time for mileage.
To assess the fit of our data to Hypotheses 5 and 6, we conducted Sobel mediation tests (MacKinnon et al., 2007). Although Table I shows that spatial distance does have a negative correlation with both perceived opportunity and perceived threat as expected, the pathway through which spatial distance affected how business owners decided to pursue TA, involved perceived opportunity (Sobel t= −2.12, p<0.05) but not perceived threat (Sobel t=0.08, n.s.). Thus, Hypothesis 5 is supported, but Hypoth-esis 6 is not.
Table II. Effects of spatial distance and strategic interpretation in predicting TA intentions
Model 1
Firm industry 0.19* 0.13† 0.11 0.12† 0.11
Owner 0.03 0.03 0.02 0.02 0.00
Proactiveness 0.01 0.03 0.04 0.05 0.05
Supported tax referendum 0.17* −0.01 −0.02 0.01 0.00
Controllability 0.11 0.09 0.08 0.09 0.09
Spatial distance −0.15† −0.06 0.43† −0.80** −0.34
Perceived opportunity 0.51** 0.83** 0.45** 0.72**
Perceived threat −0.01 0.02 −0.51** −0.56*
Spatial distance×perceived opportunity −0.55* −0.73*
Spatial distance×perceived threat 0.83** 0.78**
Adjusted R2 0.05 0.26 0.28 0.30 0.31
F-value 2.02* 6.96** 6.80** 7.53** 7.23**
d.f. 8, 159 10, 157 11, 156 11, 156 12, 155
Change in R2 0.21** 0.02* 0.04** 0.05**
Notes: N=168. Betas are standardized; † p<0.10; * p<0.05; ** p<0.01; R2change in Model 2 is based on the
Because we were interested in determining the point at which the effect of spatial distance from the disruption begins to diminish,[8] we did supplemental analyses (that
were not connected, a priori, to the hypotheses, because there is no existing theory to guide what the effects would be within the radius we sampled). We created a series of transitive dummy variables representing increasing distance from the Stadium, allowing for a number of different shapes of effects:<1 mile,<2 miles,<3 miles,<4 miles,<5 miles,
mile range, and then dropping. That is, the overall effect of distance appears to wane after 5 miles. Despite its consistency, the trend of the magnitude of the correlations is not significant in our survey data except for perceived opportunity, where at miles 4–5 the effect rises to r= −0.17 (p<0.05). The correlations for TA actions using our 4-year follow-up sample of 36 firms follow exactly the same pattern but are stronger, peaking again at the 3–5 mile range where they reach r= −0.42 to−0.47 (p<0.01). Still, we have to note these results are only suggestive, because of a methodological caveat. The middle ranges of distance in our sample were also where there was the most optimal (nearest to 50 per cent) base rate of the dummy variables. Lower and higher base rates suppress correlation sizes (Bobko, 2001).
Quantitative Results from Two Sub-Samples
Using the data collected 18 months after the initial data collection and in an effort to provide some nomological validity to our dependent variable (Cronbach and Meehl, 1955), we correlated TA intentions with performance. Because we could not residualize current performance (profits or revenue/month) using prior data, we instead asked business owners directly about the change in their firms’ performance over those 18 months, using two questions about sales growth and profitability (α =0.84). The corre-lation between TA intentions and this reported performance change was r=0.28 (p<0.05). Our data collected 4 years later revealed similar results. The correlation between TA intentions and performance for these 36 firms was significant (r=0.31, p<0.05). Together, these results suggest then that over time TA intentions are associ-ated with (perceived) improvements in firm performance.
Many models of behaviour, such as the theory of reasoned action, suggest that properly measured intentions correspond to eventual behaviour (Fishbein and Ajzen, 1975). However, to underscore that connection in the context of TA, we gathered evidence to corroborate the link between TA intentions and TA actions. Using our data collected 4 years later, we assessed TA actions by asking respondents whether or not they had made changes in their schedule, in operating hours and in days the firm was open to match Cowboys Stadium events, and/or made time changes seeking to tie the business to the events at the Stadium. If the respondents indicated they had made a change, we coded that as a yes (1) or no (0), and summed these responses. We found that TA intentions correlated with TA actions reported 4 years later: r=0.36 (p<0.05). While this correlation is strong after 4 years, it is possible that it was not larger because business owners might have used their emotions when answering our survey about their TA intentions. However, when it came to engaging in actual TA, they ended up being more deliberate in their decisions.
Qualitative Evidence from Four-Year Sub-Sample
making because the firm’s environment has become high velocity (Eisenhardt, 1989). Yet another form of TA, with some theoretical backing, but only rare empirical investigation (Khavul et al., 2010), is organizational entrainment (OE): the process by which firms ‘cope with a . . . change by synchronizing . . . their endogenous cyclic activities to those of the external environment’ (Pérez-Nordtvedt et al., 2008, p. 788). OE matters because firms that attain or regain temporal fit with a newly changed environment are predicted to outperform those that do not (Bluedorn, 1993; Pérez-Nordtvedt et al., 2008). Because our measure of TA intentions did not directly map the cycles of the Stadium schedule to the activity cycles of the originally studied firms, we were unable to establish this fine-grained and synchronous form of TA. However, interview findings were suggestive that the form of TA at hand was entrainment-like. That is, the firms that had intended TA to the Stadium not only ended up doing so, but did so in such a way that reflected not just temporal change in general, but OE in particular.
We normally open at 10:30 but open earlier if something is happening across the street (at the stadium). We used to be open for breakfast but stopped doing that before the stadium opened. Now we dust off the breakfast menu if games start early. The high school playoffs start well before noon and we pick up a pretty good breakfast crowd. We normally close up at 10:00 but will stay open if customers are still around. There are a lot of hungry people leaving the stadium because the food over there (the stadium) is so expensive. [562]
We try very hard to link up with events at the stadium . . . On Cowboys game days, we want to have people that come in before they go (to the game) and people that stay and watch the game. . . . Parking is so expensive over there (the stadium), we offer a shuttle to and from the stadium. We also offer dinner packages. A salad, steak, and shuttle for less than twenty bucks. You just can’t beat that . . . Of course, we change our staffing schedule when the Cowboys are in town because Sundays and Monday are normally our two slowest days. Now they can be two of the busiest days. More time is also needed to make the arrangements on game day too. If I could open longer, I would. [550]
. . . this part of Arlington has always been a summer area because of Six Flags and the Rangers but now we have the Cowboys. Before it picks up around Thanksgiving, and through the Christmas holidays, the Fall used to be a relatively slow time especially on Sundays. Things have definitely changed. We need to plan ahead to make sure we have enough staff when the Cowboys are in town. We also pick up quite a bit of business from fans coming to college games. The Super Bowl was particularly busy. We opened early and closed late and were booked almost solid the entire week. We expected big crowds and made adjustments to our schedule to make sure we had enough employees. We also adjusted our food order to make sure we had enough food. It was great. [66]
We have embraced the stadium from the beginning. Not only do we benefit from more customers, but the stadium looks beautiful from our dining room . . . We regularly open our banquet rooms early to accommodate large groups before events at the stadium. We have also opened the main restaurant early (before 5:00) on games days. In fact, we have opened the restaurant on Sundays during Super Bowl week. Of course, we remain open until everyone is ready to leave. [652]
We are right across the street from the stadium so we definitely benefit. Plus, we sell parking. Our revenues increase by over 50 percent on game days. For big events, we increase our staff and extend the hours. We actually bring employees from other restaurants to handle the increased business. But it’s not just the Cowboys game. They bring lots of customers. But since we cater to the Hispanic market, ‘futbol’ games are real big for us. [24]
Aside from providing tentative evidence of OE taking place, these quotes highlight several notable issues. First, they suggest that the items that we chose from pilot work to measure TA intentions were appropriate for the disruption in question and for the sampled businesses. While we believed, however, that the main change to the temporal environment had been in the form of phase, pace changes may have also occurred (e.g. increased speed of inventory replenishment and operations to handle greater influx of customers). Second, in support of construal level theory, some of the comments suggest the psychological impact that the appearance of an immense landmark in the competi-tive space has on nearby business owners. Spatial distance affected TA intentions not only because of the increased demand or enhanced information availability close to the disruption, but also because of the landmark’s imposing visual presence. Third, the interviewers’ reports seem to indicate that particular events have greater importance to their firms, and they were more likely to align their business activities to them (e.g. regional soccer events targeting the Hispanic community). Lastly, other forms of non-TA – that is, those regarding content – also occurred (e.g. offering food and transportation packages). In fact, some content changes required time changes, and some time changes required some content changes. Nonetheless, the upshot of these qualitative data is that TA in general and OE in particular were key features of how firms responded to the disruption in question.
DISCUSSION AND FUTURE DIRECTIONS
Temporal Adaptation as Potential Response to an Environmental Disruptor
Even though it is seldom studied, TA appears to be both a viable and useful means to adapt to a disruption (Bluedorn, 1993; Pérez-Nordtvedt et al., 2008), especially for entrepreneurial firms. The reasons are compelling. First, time changes are not disruptive to the specific product/service preferences of current customers but can attract new ones when the disruption extends the phase (expands) of current cycles. TA can benefit entrepreneurial firms which are primarily focused on survival and growth (Sapienza et al., 2006). Second, time changes, while not costless, may be less resource-intensive than content ones. Because entrepreneurial firms tend to be resource-constrained (Baker and Nelson, 2005), we expect TA to be an attractive course of action. Third, time changes typically require greater flexibility on the part of the firm. Because entrepre-neurial firms are nimble, flexible, and less routine-entrenched, TA may require less unravelling of existing practices and can be implemented faster than in older, more established firms (Sapienza et al., 2006). Lastly, as in our case, the new entrant does not need to be a direct competitor of incumbent firms, yet, it does need to embody oppor-tunities, threats, or both for incumbents. We show that a way to respond to such opportunity or threat is not by directly establishing the incumbent firms’ advantage vis-à-vis the new entrant but may be by riding along with the (disruptive) temporal wave that the new entrant instigates. Thus, we propose that TA should be considered a distinct and important element in the firm’s overall strategy (see Hambrick and Fredrickson, 2001).
Organizational Entrainment, and Beyond
Beyond our theoretical arguments, initial interviews, and quantitative results regarding TA intentions, our follow-up qualitative analysis implies that Arlington business owners implemented TA in an entrainment-like fashion. Our conversations with the managers that yoked their firms’ activities to the Cowboys Stadium schedule open a research agenda for those interested in OE phenomena. First, while our measure of TA intentions can be a starting point for developing a measure of OE, our measure does not specifically ask about synchronization. Ideally, mapping the timing of firm activities to the dominant player over time along some of these activities would be required to fully capture OE. Thus, scale development and measurement of OE is a promising area for scholars.
Cowboys also prompted non-TAs. Exploring the effect of OE alongside content-type adaptations – how OE might moderate the relationship between non-TA and perfor-mance – is particularly interesting.
Good is Stronger than Bad
Consistent with the argument that opportunities typically instigate action (Dutton, 1993; Kennedy and Fiss, 2009), our data show that positive perceptions, and not negative ones, helped in directly predicting TA intentions. Those business owners who perceived the impending arrival of ‘Jerry’s World’ as an opportunity were more likely to make plans for aligning the timing of their activities with those of this major new entrant (Bluedorn, 1993). Alternatively, the lack of effect for perceived threat supported neither the threat-rigidity hypothesis (Staw et al., 1981) nor the behavioural theory of the firm (Cyert and March, 1963) predictions (although the moderating effect of distance showed the former operating at shorter distances, and the latter at longer distances). Together, these results contrast with a strong finding in psychology research: ‘bad is stronger than good’ (Baumeister et al., 2001), with negative stimuli having larger effects on human cognition and behaviour (Skowronski and Carlston, 1989).
Although the perceptions of opportunity as opposed to threat were more potent in our sample, this was not a clear expectation a priori. We had evidence suggesting ambiguity of the Cowboys Stadium’s impact on firms in this ecosystem. First, pilot interviews indicated that some business owners were interpreting the Stadium as an opportunity, while others were interpreting it as a threat. The quotes at the beginning of the paper indicate these conflicting perceptions. In fact, an interviewee brought up the building of the ‘Ballpark in Arlington’ baseball stadium for the Texas Rangers about decade earlier. From his perspective, it shuttered some businesses and boosted others. Second, the vote for the tax referendum supporting the stadium was split fairly evenly (54 per cent in favour; 46 per cent against it). Lastly, media reports indicated positive as well as negative reactions. The frequently used label of ‘Jerry’s World’ for the Stadium simultaneously connoted a place that might be fun, while casting derision on the hubris of the Cowboys’ owner.
Perhaps the general dominance of perceived opportunity over perceived threat may be reflecting a temporal ordering, which we were not able to capture with our cross-sectional data. Before the change occurs, opportunities may overwhelm the perceptual field of business owners (Cooper et al., 1988). As the change nears (in time, not in space), more clarity about the threats it can represent for business owners may become available and incorporated into strategic thinking. This type of temporal distance from a vague rather than a sharply defined threat might not spur specific thought and action patterns (Trope and Liberman, 2003). A longitudinal design would be better able to test this possibility.
Location, Location, Location
interpretation had on TA intentions. Among business owners who saw the shock as an opportunity, those who were physically closer to it were more likely than those who were far away from it to exploit it – by deciding to pursue TA. The economics argument, which suggests that closeness to the locus of change enhances the amount and quality of information available (Krugman, 1991; Rosenthal and Strange, 2001), the interaction between the firm and the disruptor (Fellmann et al., 1997), and the flow of customers to the area (Horton and Reynolds, 1971), explains why closeness strengthens the effect of perceived opportunity on TA intentions for firms. In spite of the lower level of construal attributed to a spatially close disruption (Trope and Liberman, 2003), the fact that the disruption is positively evaluated seems to enable business owners to broaden their thinking (Fredrickson, 2001) and evaluate options more rationally.
In support of construal theory, which predicts that nearby objects negatively inter-preted create tunnel vision (Trope and Liberman, 2010), we found that the threat-rigidity argument applies to firms that are spatially close to the locus of change (Staw et al., 1981). Firms near the Stadium appeared to have adopted the ‘deer in the head-lights’ posture in response to the Stadium’s threat (Dewald and Bowen, 2010). These firms were more likely to ‘hunker down’ or take a wait-and-see approach. Thus, ‘bad’ seemed to get stronger when it is closer. However, also in support of construal theory, which predicts that distant objects negatively interpreted allow for individuals to engage in more rational and strategic decisions, when far away firms are threatened by the locus of change, they appear to act as the behavioural theory of the firm predicts. Distant firms that interpret the disruption as a threat are likely to engage in TA (Cyert and March, 1963). Thus, spatial distance neutralizes the potentially paralysing effect of a perceived threat. Previous research has shown that the threat-rigidity hypothesis depends on contingency factors (e.g. the level of severity or controllability associated with the threat (Chattopadhyay et al., 2001; Shimizu, 2007) and family influence (Sirmon et al., 2008)). We contribute directly to this conversation by showing that the operation of the threat-rigidity thesis and the behavioural theory of the firm depend on distance from the environmental disruption. This finding suggests that strategic decision making scholars would benefit by including construal level theory (Trope and Liberman, 2010) as a powerful tool for explaining strategic choices, and incorporating other forms of temporal and social (in this context, firm similarity) distance into predictions about strategic thought and action.
and distinct (e.g. Holyok and Mah, 1982; Lee and Tversky, 2005). When the perception is one of an opportunity, it then triggers the decision by the business owner to seek TA as a response.
Limitations
Although our findings apply specifically to TA intentions, they are not the same as TA actions. Future research should explore the relationship between intended TA, actual TA, and a wide array of firm-level outcomes (e.g. performance, growth, survival, access to financing, and capability development). In addition, the temporal component of a firm’s overall strategy should be examined alongside its other content elements (see Hambrick and Fredrickson, 2001), particularly when it comes to its role in determining firm performance. Although our focus was on TA intentions as a response to a major new entrant disrupting the environment, research could go a step further and examine if creating temporal misfit with the new entrant – temporally mis-aligning instead of aligning – is a more appropriate response (Eisenhardt and Brown, 1998). Understanding whether or not there are performance benefits to capture from being a ‘temporal enactor’ is an interesting question to address. Similarly, an important avenue for research would be to assess whether temporal enactment may be a viable entry strategy available to potential newcomers.
Another potential limitation deals with testing both mediation and moderation in the same dataset. However, the original Baron and Kenny (1986) paper on distinctions between the two effects discusses a ‘combined model’ framework for mediation and moderation together (pp. 1179–80) (see also James and Brett, 1984). Indeed, they characterize the combination as perhaps the ‘strongest . . .’ for ‘. . . the prediction of social behavior’. Proposing and testing this complex configuration continues to be an active area of methodological scholarship (e.g. Muller et al., 2005).
Our study dealt with an environmental change occurring in a single business ecosys-tem. Thus, the extension of our findings to other, more widely spread disruptions is limited. However, the Stadium changed the temporal environment and served as a new pacer in this business ecosystem, making it a natural laboratory to test our predictions about TA intentions. We encourage scholars to examine how business owners evaluate multiple temporal disruptors at the same time, decide to respond to these multiple demands, and actually respond to them. Our study also did not control for content adaptation intentions. Because content adaptation may also substitute for TA, future researchers would benefit by including content changes when examining models related to TA. Finally, while our results were generally as predicted, other variables may be important in explaining TA intentions. Constraining factors such as resources, routines, and structural rigidity, or the degree of control exercised over local firms by centralized parents or governing entities (e.g. a bank branch whose operating practices are governed by centralized regulations) are an important set of variables missing from our model that may impede TA.[9] Even when firms have access to resources, and decision-making
factors such as dynamic capabilities, personal attributes, traits, background, experience, and disposition also need to be included in our proposed model.
CONCLUSION
From time to time, firms face environmental disruptions with the potential to change their competitive landscape. Faced with the decision of how to respond, some firms decide to change what they do while others decide to change when they do it. When the disruption alters the temporal environment, firms need time-based strategies to compete. Our cross-sectional data show how TA is selected by incumbent firms based on business owners’ perceptions of the disruption as opportunity, threat, or both. Further, we find that TA is also dependent upon the spatial closeness of the incumbent firm from the disruption because closeness amplifies the strength of the wave. Finally, small sample data suggest that TA can be beneficial to firms that undertake it and can take the form of OE, or a response that seeks organization–environment temporal-fit.
ACKNOWLEDGMENT
We thank Drake Mullens and Aaron Moses for research assistance.
NOTES
An earlier version of this paper was presented at the 2009 Academy of Management Meetings.
[1] Prospect theory (Kahneman and Tversky, 1979), and its notion of loss aversion (Kahneman et al., 1991), is widely used to explain how decision-makers respond to threats and opportunities. However, in our context, decision-makers cannot effectively identify and calibrate likelihoods of unknown outcomes (Dewald and Bowen, 2010).
[2] We would like to thank an anonymous reviewer for suggesting this alternative line of reasoning. [3] While advances in digital technologies and availability of information can make spatial distance less
relevant today, we believe distance is still important for at least three reasons. First, digital technologies make distance less relevant but only for those who are cognitively, culturally, and/or emotionally close. Commonalities that existed prior to the existence of digital technologies account for closeness between people. For instance, a recent study showed that spatial distance considerably constraints the ties that Twitter easily enables (Takhteyev et al., 2012). Thus, proximity still matters (Mok et al., 2010). Second, spatial distance is a proxy for a change in the pattern of demand around a salient player. The Cowboys franchise is prominent and likely to become a centre of economic activity. Once there, customers are not likely to stray far away from it (Gonzalez et al., 2008; Horton and Reynolds, 1971). Finally, landmarks have an effect on people. The Stadium is huge. Nearby, it looms as a structure that can literally shadow other buildings in its surrounding area. Its existence close-up is visual and perhaps even visceral. As distance shrinks, businesses are more likely to reach foranyinformation available about the Stadium. [4] Predicting and preparing for the peak season are organizational activities. Business owners run specials,
[5] Because this question came up earlier in the interview and its answer is in a simple yes/no format, we could not include it as an item into our TA intentions measure.
[6] Precise estimates of travel distance were previously expensive to obtain for large datasets and researchers typically relied on a variety of straight-line measures such as Euclidean distance (‘crow flies’) (Waller and Gotway, 2004) for estimates. More precise travel distance data are now accessible for public locations, and researchers in a variety of fields, have used them as measures of spatial distance (Agarwal and Hauswald, 2010; McMaster et al., 2011). Recent studies have shown that, in areas without major geographic obstructions, travel distances and straight-line distances are highly correlated (Boscoe et al., 2012).
[7] We developed a program which took advantage of the Google Directions Application Programming Interface (API). We would like to direct the reader to a number of similar tools developed for SAS (see Boscoe et al., 2012; http://www.sascommunity.org/wiki/Driving_Distances_and_Drive_Times_using _SAS_and_Google_Maps), STATA (Ozimek and Miles, 2011), and the Python program which is available in Wang and Xu (2011).
[8] We would like to thank Allen C. Amason for suggesting this analysis to us. [9] We would like to thank an anonymous reviewer for pointing this out to us.
REFERENCES
Agarwal, S. and Hauswald, R. (2010). ‘Distance and private information in lending’.Review of Financial Studies,23, 2758–88.
Ancona, D. and Chong, C. (1996). ‘Entrainment: pace, cycle, and rhythm in organizational behavior’. In Staw, B. M. and Cummings, L. L. (Eds),Research in Organizational Behavior. Greenwich, CT: JAI, 251–84. Ancona, D., Goodman, P., Lawrence, B. and Tushman, M. (2001). ‘Time: a new research lens’.Academy of
Management Review,26, 645–63.
Argote, L. and Greve, H. (2007). ‘A behavioral theory of the firm – 40 years and counting: introduction and impact’.Organization Science,18, 337–49.
Associated Press (2008). Dallas Cowboys Remain Most Valuable NFL Franchise. Available at: http://www .nydailynews.com/money/2008/09/10/2008-09-10_dallas_cowboys_remain_most_valuable_nfl _.html (accessed 10 September 2008).
Baker, T. and Nelson, R. (2005). ‘Creating something from nothing: resource construction through entre-preneurial bricolage’.Administrative Science Quarterly,50, 329–66.
Baron, R. and Kenny, D. (1986). ‘The moderator-mediator variable distinction in social psychological research: conceptual, strategic and statistical considerations’.Journal of Personality and Social Psychology,51, 1173–82.
Baumeister, R., Bratslavsky, E., Finkenauer, C. and Vohs, K. (2001). ‘Bad is stronger than good’.Review of General Psychology,5, 323–70.
Bettis, R. and Prahalad, C. (1995). ‘The dominant logic: retrospective and extension’.Strategic Management Journal,16, 5–14.
Bluedorn, A. (1993). ‘Pilgrim’s progress: trends and convergence in research on organizational size and environments’.Journal of Management,19, 163–91.
Bluedorn, A. (2002).The Human Organization of Time: Temporal Realities and Experience. Stanford, CA: University Press.
Bobko, P. (2001).Correlation and Regression: Applications for Industrial Organizational Psychology and Management. Thousand Oaks, CA: Sage.
Boscoe, F., Henry, K. and Zdeb, M. (2012). ‘A nationwide comparison of driving distance versus straight-line distance to hospitals’.The Professional Geographer,64, 1–9.
Bozeman, B. and Slusher, E. (1979). ‘Scarcity and environmental stress in public organizations: a conjectural essay’.Administration and Society,11, 335–56.
Chattopadhyay, P., Glick, W. and Huber, G. (2001). ‘Organizational actions in response to threats and opportunities’.Academy of Management Journal,44, 937–55.
Chia, R. (2000). ‘Discourse analysis as organizational analysis’.Organization,7, 513–18. Child, J. (1972). ‘Organizational structure, environment and performance’.Sociology,6, 1–22.
City of Arlington, Texas (2004).Frequently Asked Questions about the Dallas Cowboys Complex Development Project. Available at: http://www.arlingtontx.gov/citysecretary/pdf/110204/110204_faq_english.pdf (accessed 8 September 2008).
Cooper, A., Dunkelberg, W. and Woo, C. (1988). ‘Entrepreneurs’ perceived chances for success’.Journal of Business Venturing,3, 97–109.
Covin, J. and Slevin, D. (1989). ‘Strategic management of small firms in hostile and benign environments’. Strategic Management Journal,10, 75–87.
Cowboys Stadium (2013).Architecture Fact Sheet. Available at: http://stadium.dallascowboys.com/assets/pdf/ mediaArchitectureFactSheet.pdf (accessed 28 June 2013).
Cronbach, L. and Meehl, P. (1955). ‘Construct validity in psychological tests’.Psychological Bulletin, 52, 281–302.
Cyert, R. and March, J. (1963).A Behavioral Theory of the Firm. Englewood Cliffs, NJ: Prentice Hall. Daft, R. and Weick, K. (1984). ‘Toward a model of organizations as interpersonal systems’. Academy of
Management Review,9, 284–96.
D’Aunno, T. and Sutton, R. (1992). ‘The responses of drug abuse treatment organizations to financial adversity: a partial test of the threat-rigidity thesis’.Journal of Management,18, 117–31.
Dewald, J. and Bowen, F. (2010). ‘Storm clouds and silver linings: responding to disruptive innovations through cognitive resilience’.Entrepreneurship: Theory and Practice,34, 197–218.
Dickson, G. (2004). New Stadium for Dallas Cowboys Would Accelerate Road Projects. Available at: http:// www.highbeam.com/doc/1G1-122518073.html (accessed 3 October 2008).
Dutton, J. (1993). ‘Interpretations on automatic: a different view of strategic issue diagnosis’. Journal of Management Studies,30, 339–57.
Dutton, J. and Jackson, S. (1987). ‘Categorizing strategic issues: links to organizational action’.Academy of Management Review,12, 76–90.
Eisenhardt, K. (1989). ‘Making fast strategic decision making in high velocity environments’.Academy of Management Journal,32, 543–76.
Eisenhardt, K. and Brown, M. S. (1998). ‘Time pacing: competing in markets that won’t stand still’.Harvard Business Review,76, 59–69.
Eunni, R., Post, J. and Berger, P. (2005). ‘Adapt or adapt: lessons for strategy from the US telecoms industry’. Journal of General Management,31, 83–105.
Fellmann, J., Getis, A. and Getis, J. (1997). Human Geography: Landscapes of Human Activities. New York: McGraw-Hill.
Fishbein, M. and Ajzen, I. (1975).Belief, Attitude, Intention and Behavior: An Introduction to Theory and Research. Reading, MA: Addison-Wesley.
Fredrickson, B. (2001). ‘The role of positive emotions in positive psychology’. American Psychologist, 56, 218–26.
Fredrickson, B. and Branigan, C. (2005). ‘Positive emotions broaden the scope of attention and thought– action repertoires’.Cognition and Emotion,19, 313–32.
Ginsberg, A. and Venkatraman, N. (1985). ‘Contingency perspectives of organizational strategy: a critical review of the empirical research’.Academy of Management Review,10, 421–34.
Goll, R. and Rasheed, A. (2011). ‘Environmental jolts, clocks, and strategic change in the U.S. airline industry: the effects of deregulation and the 9/11/2001 terrorist attacks’.Business and Politics,13, 1–35. Gonzalez, M., Hidalgo, C. and Barabasi, A. (2008). ‘Understanding individual human mobility patterns’.
Nature,435, 779–82.
Greve, H. (2010). ‘Positional rigidity: low performance and resource acquisition in large and small firms’. Strategic Management Journal,32, 103–14.
Hambrick, D. and D’Aveni, R. (1988). ‘Large corporate failures as downward spirals’.Administrative Science Quarterly,33, 1–23.
Hambrick, D. and Fredrickson, J. (2001). ‘Are you sure you have a strategy?’.Academy of Management Executive,
15, 48–59.
Hambrick, D. and Mason, P. (1984). ‘Upper echelons: the organization as a reflection of its top managers’. Academy of Management Review,9, 193–206.
Hannan, M. and Freeman, J. (1984). ‘Structural inertia and organizational change’. American Sociological Review,49, 149–64.
Haveman, H., Russo, M. and Meyer, A. (2001). ‘Organizational environments in flux: the impact of regulatory punctuations on organizational domains, CEO succession, and performance’.Organization Science,12, 253–73.
Holyok, K. and Mah, W. (1982). ‘Cognitive reference points in judgements of symbolic magnitude’.Cognitive Psychology,14, 328–52.