Spatial and Temporal Distribution of Phytoplankton at Cirata Reservoir in Relation to Aquatic Primary Productivity
Zahidah Hasan
Program Studi Perikanan, Fakultas Perikanan dan Ilmu Kelautan
Universitas Padjadjaran (Departement of Fisheries, Faculty of Fisheries and Marine Science, Padjadjaran University)
Jl. Raya Jatinangor Km 21 Sumedang Tlp/fax : 62-22-7797763, Hp : 62-22- 70020583 Kodepos Ujungberung 40600
ABSTRACT
Research on the spatial and temporal distribution of phytoplankton at Cirata Reservoir in relation to aquatic primary productivity had been conducted from March 2003 to March 2004. The aim of the research were to identify and learn spatial and temporal distribution of phytoplankton and interaction between phytoplankton and aquatic properties which affect it. Monthly sampling have been done at 5 (five) chosen stations. Two ways multivariate analysis of variance applied to identify spatial and temporal distribution of net primary productivity (NPP), biomass, orthophosphate, nitrate, ammonia, organic matter, dissolved oxygen, carbondioxide, and temperature. Multiple regression equations are applied to identify functional interrelation between net productivity and biomass with abiotic environment and interrelation between dissolved oxygen and organic matter and NPP. Result of the research showed that temporal distribution of organic matter significantly differ, but not in spatial distribution. NPP showed significant different in spatial distribution but not in temporal distribution. Biomass and NPP are higher in rainy season than dry season. Negative elimination that indicates phytoplankton development appears at the end of dry season and several months of rainy season.
Introduction
Cirata reservoir is the second reservoirs in Citarum cascade reservoirs after Saguling at the
upland and before Jatiluhur in lowland. Major function of Cirata as Hydroelectric power, others
function as recreational area, and Floating net cages aquaculture (FNCA) area. Cirata reservoir
receive organic and anorganic material from Saguling reservoir and Citarum River and its
tributaries that entered to Cirata reservoir. In the other hand FNCA activities contribute in
organic material raising that tend to higher productivity and then eutrophication level.
Raising aquatic productivity initiated by changed in physicochemical characteristic which
followed with others change, usually harmfull. Usually phytoplankton is the first biological
variable which respon to those change. Lawrence et.al. (2000) explain that nutrient availability ,
light, mixing, water residence time and temperature are major factor in regulating phytoplankton
growth and composition in reservoirs. Furthermore were eplained that mechanism of those
factors are complicated and variable and also affected by latittude, catchment area landuse and
its management, reservoir depth, drawdown morfology and condition and also climate variation.
Net Primary Productivity (NPP), phytoplankton biomass and chlorofill a content are three
componen in explaining phytoplankton characteristic in lentic water.
Inorganic nutrients, especially phosphorous and nitrogen have to be concern in relation to
aquatic primary productivity (Henderson-Sellers dan Markland, 1987). Antrophogenic activities
in terestrial ecosystem affect to nitrogen availability in aquatic ecosystem. One of those effects
is erosion that brought up nitrogen from this ecosystem. Raising in nitrogen and phosphorous
availability in aquatic ecosystem also affected by activities on ecosystem itself such as floating
net cages aquaculture .
Nutrient ratio, especially N:P ratio is another factor that affect phytoplankton community
besides its availability and concentration (Harris, 1986). N:P ratio determine phytoplankton
Methods
This research was conducted in Cirata reservoir, was filled up in February 1988 at an
elevation of 221 m asl. The area of the reservoir is 6,200 ha with total volume of 2,165 million
m3 at its HWL (PT Perusahaan Listrik Negara, 1998). Monthly sampling at 5 (five) stations that
represented of low BOD (2 stations) and moderate BOD (3 stations) as showed in Figure 1, was
carried out and covered both two season from March 2003 to March 2004. Methods used for all
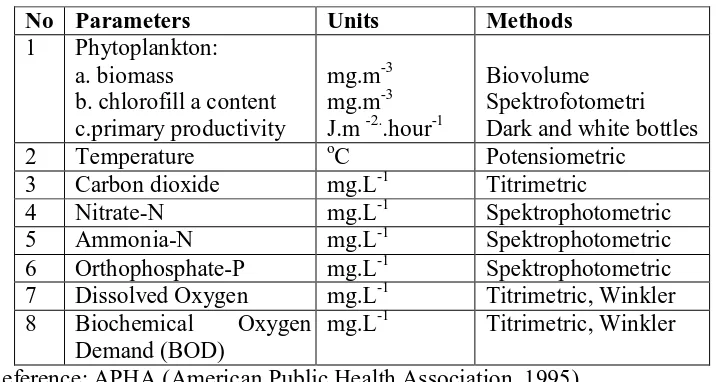
physical, chemical and biological paremeters are listed in Table 1.
Table 1. Parameters were analysized, and its methods
No Parameters Units Methods
1 Phytoplankton: a. biomass
b. chlorofill a content c.primary productivity
mg.m-3 mg.m-3 J.m -2..hour-1
Biovolume Spektrofotometri Dark and white bottles
2 Temperature oC Potensiometric
3 Carbon dioxide mg.L-1 Titrimetric
4 Nitrate-N mg.L-1 Spektrophotometric
5 Ammonia-N mg.L-1 Spektrophotometric 6 Orthophosphate-P mg.L-1 Spektrophotometric 7 Dissolved Oxygen mg.L-1 Titrimetric, Winkler 8 Biochemical Oxygen
Demand (BOD)
mg.L-1 Titrimetric, Winkler
Reference: APHA (American Public Health Association, 1995)
Spatial analysis based on organic matters zonation (in this case of BOD) and temporal
analisys refers to dry and rainy season. Two ways multivariate analysis of variance and multiple
regresion analysis were used (Johnson dan Wichem, 1992),
Result and Discussion
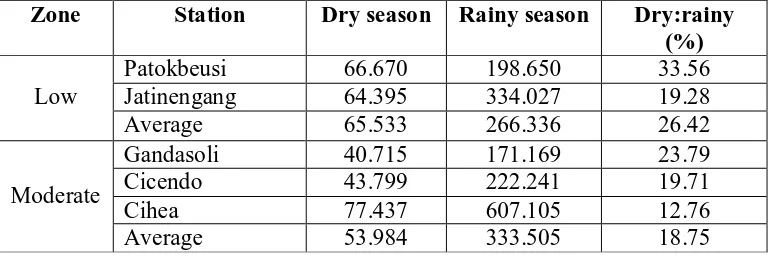
Phytoplankton mean biomass in rainy season were higher than dry season and moderate
zone higher than low zone as showed in Table 2. Mean NPP values higher in dry season than
rainy sesaon on low BOD zone, meanwhile on moderate zone its value in rainy season is higher
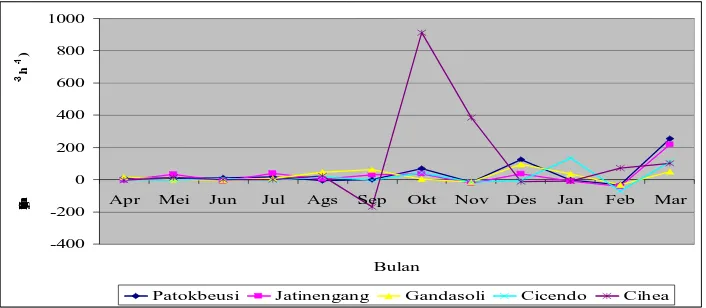
rainy season in both zones as showed in Table 4. Phytoplankton elimination which indicate
phytoplankton development showed in Figure 2.
Table 2. Spatial and temporal phytoplankton mean biomass (µg.L-1)
Zone Station Dry season Rainy season Dry:rainy (%)
Patokbeusi 66.670 198.650 33.56
Jatinengang 64.395 334.027 19.28
Low
Average 65.533 266.336 26.42
Gandasoli 40.715 171.169 23.79
Cicendo 43.799 222.241 19.71
Cihea 77.437 607.105 12.76
Moderate
Average 53.984 333.505 18.75
Table 3. Spatial and temporal net primary productivity (J.m-2.hari-1)
Zone Station Dry season Rainy season Dry:rainy (%)
Patokbeusi 2.249 3.083 72.97
Jatinengang 2.365 1.576 150.1
Low
Average 2.307 2.3295 99.03
Gandasoli 2.053 2.181 94.12
Cicendo 0.992 2.66 37.28
Cihea 1.953 2.729 71.55
Moderate
Average 1.666 2.523 67.65
Table 4. Spatial and temporal chlorofill a content (µg.L -1)
Zone Station Dry season Rainy season Dry:rainy (%)
Patokbeusi 23.0782 20.4335 112.94
Jatinengang 37.4405 19.2694 194.3
Low
Average 30.25935 19.85145 153.62
Gandasoli 19.4658 19.6998 98.81
Cicendo 27.6566 15.2057 181.88
Cihea 35.2224 17.3262 203.29
Moderate
Average 27.44827 17.41057 161.3267
Negative elimination that indicates phytoplankton development appears at the end of dry
season and several months of rainy season as showed in figure 2. However there are extreme
so that values in others station not seems markedly. This condition indicate that in riverine areas
in reservoir growth and mortality fluctuation of phytoplankton tend to be incisively. Multivariate
analysis resulted as showed in Table 5 and Table 6. Table 5 detailed multivariate matrix
between factors and dependent variables, meanwhile Table 6 showed regresion model between
phytoplankton or NPP and its determining variables.
-400 -200 0 200 400 600 800 1000
Apr Mei Jun Jul Ags Sep Okt Nov Des Jan Feb Mar
Bulan
Eliminasi ( juta mgJ.m
-3.h -1)
Patokbeusi Jatinengang Gandasoli Cicendo Cihea
Figure 2. Phytoplankton elimination dynamic
Table 5. Multivariate Matrix between factors and dependent variables
Factors dependent
variable Temporal Spasial
NPP Not affected. dry season and rainy season not significantly difference
Affected by zone. low zone higher than moderate zone.
PO4-P Affected. rainy season higher than dry season
Not affected. low zone and moderate zone not significantly difference
NO3-N Affected. rainy season higher than dry season
Affected by zone. low zone higher than moderate zone.
NH3-N Affected. rainy season higher than dry season
Affected by zone. low zone higher than moderate zone.
BOD Affected. rainy season higher than dry season
Not affected. low zone and moderate zone not significantly difference
DO Not affected. dry season and rainy season not significantly difference
Not affected. low zone and moderate zone not significantly difference
CO2 Affected. rainy season higher than dry season
Temperature Affected. rainy season higher than dry season
Not affected. low zone and moderate zone not significantly difference
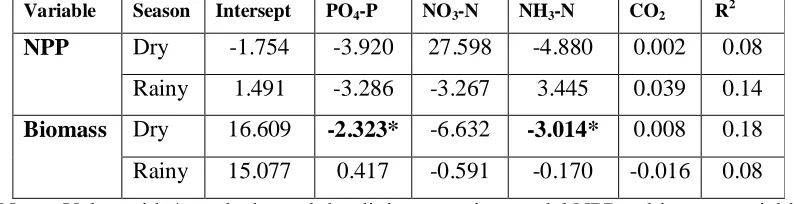
Table 6. Regresion model between NPP or phytoplankton biomass and its determining variable
Variable Season Intersept PO4-P NO3-N NH3-N CO2 R2
Dry -1.754 -3.920 27.598 -4.880 0.002 0.08
NPP
Rainy 1.491 -3.286 -3.267 3.445 0.039 0.14
Dry 16.609 -2.323* -6.632 -3.014* 0.008 0.18
Biomass
Rainy 15.077 0.417 -0.591 -0.170 -0.016 0.08
Note : Value with * mark showed that linier regresion model NPP or biomass variable and determining variable is significant in F test with α = 0.2
Conclusion
In conclusion :
1. Phytoplankton growth (negative elimination values) appeared in both seasons and in
all station, although in low level except in riverine areas (Station of Cihea) there are
markedly growth and elimination of phytoplankton between end of dry season and
early of rainy season (There is markedly growth in September with elimination
negative values of – 1.7 x 10⁹ mg.J.m.-3.day-1. And there is positive elimination value
of 9.13 x 10⁹ mg.J.m.-3.day-1 in Oktober.
2. NPP values were not determined by any variables in both seasons, meanwhile
biomass determined by orthophosphat-P and ammonia-N in dry season and not
determined by any variables in rainy season
References
APHA (American Public Health Association). 1995. Standard Methods For Examination of
Water and Waste Water 19thed. APHA - AWWA. Washington D.C.
Henderson-Sellers. B and H.R. Markland. 1987. Decaying Lakes. John Wiley and Sons.
Chichester
Johnson. R.A. and D.W. Wichem. 1992. Applied Multivariate Statistical Analysis. Prentice
Hall. Englewood Cliffs. New Jersey.
Lawrence. I.. M. Bormans. R. Oliver. G. Ransom. B. Sherman. P. Ford and N. Schofield 2000.
Factors controlling Algal Growth and Composition in Reservoirs: Report of Reservoir
Manager’s Workshops. Cooperative Research Centre for Freshwater Ecology.
http:// Freshwater.canberra.edu.au
Perusahaan Listrik Negara (PLN). PT. 1998. Cirata and Saguling Environmental Studies and