135
The Snapshot of Online Public Relations in Indonesia Public Agencies: Effort
to Comply With Conditions of PITA
(Quantitative Study on Content Analysis of The Websites of Public Agencies That Receive
Public Information Transparency Award in 2016)
Syaiful Azhary
1*, Rachmat Kriyantono
2, Maulina Pia Wulandari
31Program Magister Communication Faculty of Social and Politics Sciences, University of Brawijaya, Malang, Indonesia
23Faculty of Social and Politics Sciences, University of Brawijaya, Malang, Indonesia
Abstract
In this age of public information transparency, website characteristic has been a representation of online public relations of Indonesia public agencies based on which public agencies are required to provide transparent and accountable information, and therefore, online public relations helps them to make available a dialogic space for public and agency, which then
reducing information gap. This paper promoted a theme of the evaluation on Indonesia public agencies’ online public
relations in effort to measure the transparency and accountability of information given to the public. This theme was subjected to examination with positivism approach and quantitative method and then explained descriptively based on the criteria of 4 models of evaluation using Website Attribute Evaluation System (WAES). Content analysis was conducted and
focused on the systematic features of the website. Research used proportional stratified random sampling based on the
rating of information transparency of public agencies in 2016. Result of research indicates that still quite few public
agencies have features of transparency, interactivity, usability, and website maturity, and thus, information gap still exists
and is obviously influencing public’s perception and expectation, which then affecting public trust to public agencies.
Key words:online public relations, public agencies, Public Information Transparency Act (PITA)
INTRODUCTION
In last decades, academicians found drastic decline in the public trust to government [1]. This decline is caused by poor communication between government and public, and public feels that they lack of information about their government activity [2]. Gant & Gant asserted that government website must take benefit from using features of transparency and accountability to improve sense of trust and legitimacy from the public [3]. Information flow from government to public must be smooth to produce better public perception and expectation because both attributes may affect public trust, and the increasing trust would reduce information gap [4]. Some experts such as J.Grunig & Jaatinen believed that public relations was always different in different government, at least due to different stream of democracy each government advocates [5]. Indonesia adores Democracy of Pancasila which respects highly collectivity and transparency. It has been stated in The Ministry of National Civil
Service’s Decree No.30/2011 and Law No.14/2008
which require government public relations to conduct communication in two-way manner and also to assure the transparency of information
Syaiful Azhary
Email : [email protected] Phone : 08164736191
Address : University of Brawijaya, Veteran street, Malang, East Java, Indonesia, 65145
given to public in order to facilitate the creation of logically realistic program for the public. It is less surprising that information must flow fluently from the government to the public because it helps producing better public perception and expectation, which in turn may increase public trust that would reduce information gap [4].
Government must use some features of transparency and accountability to improve trust and legitimacy rates of the public [3]. Such understanding is important recalling a fact that in the age of public information transparency, website characteristic is the representation of online public relations in Indonesia public agencies by which the agencies are required to provide information in manners of transparency and accountability, and also to make available a dialogic space for public to reduce information gap [4]. It facilitates the public to assess public
agencies’ performance, and to convey aspiration
and input into policy-making process of Indonesia public agencies. The acknowledgment of Law No.14/2008 on Public Information Transparency and Law No.25/2009 on Public Service should keep Indonesia public agencies to deliver information in transparent and accountable ways to the public by implementing e-government concept. Public
agencies’ website is a proper medium to improve
136
MATERIAL AND METHOD
Paradigm used in this research is positivism. Research type is descriptive. The author would provide a description by evaluating a phenomenon of public relations on the net or named with online public relations which has been popular and widely
applied by public agencies’ public relations. This research implements a quantitative content analysis on systematic features and contents of
Indonesia public agencies’ website. Research also
discusses general characteristic of the website in public agencies with online public relations. This characteristic would be analyzed with Website Attribute Evaluation System (WAES). The analysis unit is the websites of Indonesia public agencies. Method used in this research is the audit of community relation with quantitative method. Descriptive research is aimed to create a systematic, factual, and accurate description about facts and natures of certain population or object.
DATA COLLECTION
A technique used in this research is sequential exploration. Sampling technique is
proportional stratified random sampling. It involves information transparency rating given by The Central Committee of Information for Indonesia Republic. Based on this rating , seven categories were obtained. Six categories were general and one category was specific. Each general category consists of 10 samples, while specific category has 4 samples. The six general categories include: ministerial public agency, non-ministerial public agency, non-structural public agency, provincial public agency, state-owned enterprise, and public college. The specific category is national political party. Data analysis technique is quantitative analysis. It is used to process the data using frequency distribution table [6] [7].
At frequency distribution table, the author can read scores of each category. The measurement of these scores is done with
Confirmatory Factor Analysis (CFA). Result of this measurement is converted into a percentage point to estimate the tendency rate of using features that represent research indicators, and also to understand the dominant factor in each indicator. This research uses factor analysis to analyze interdependence across variables. The score factor the author uses is:
S-Fa = c’ Rˉ¹ Zj Where:
S-Fa : Score Factor
c’ : Eigen Vector
Rˉ¹ : Matrix Inverse Zj : Observed Score
The higher is the score obtained, the more transparent and accountable is the information obtained by public from online public relations activity. The lower is the score, the less transparent and accountable is the delivery of information to public.
RESULTS AND DISCUSSION
The evaluation of public information transparency is conducted with Website Attribute
Evaluation System (WAES) designed by the
Cyberspace Policy Research Group [8] [9]. Some items in the original concept are removed and replaced with new items. The clarification of coding criteria is performed to assess e-government development rate with 4 different dimensions, respectively transparency, interactivity, usability and website maturity. Result of analysis is then measured with Confirmatory Factor Analysis (CFA) and the output is converted to average percentage point representing the percentage of tendency and the dominant factor of each indicator.
Transparency
Nine features are constituting the indicator of transparency. These include: content ownership; content update; contact information of organizational insiders and those with responsibility for website content and website technical support; specific content (financial statement, performance report, Legislation and relevant publications, or its connection with other
agencies’ website); explanation and instruction
about requirement that must be met by information supplicants; explanation about security and privacy; statements of vision and mission; announcement; and press broadcast. Result of WAES is explained as following.
1. First category of public agency is public college. The result of WAES on transparency is shown by Table 1.
TABLE 1
137 Table 1 shows that in average, the websites of
public colleges in Indonesia are already Transparent but it is not yet ideal. It is said so because websites in Quite-Transparent (QT) rank are more than those in Going-Transparent (GT) and Less-Transparent (LT) ranks. Features such as website content update, statements of vision and misison, and annoucement, are the dominant factors determining tendency to consider transparency in websites of public colleges. 2. Second category is state-owned enterprise.
Percentage of transparency of this category is shown in Table 2.
TABLE 2
The Percentage of Transparency in Websites of State-Owned Enterprises
9 www.jasatirta2.co.id 55.55 LT
10 www.btn.co.id 44.44 LT
As shown by Table 2, Most websites tend to be Quite-Transparent (QT) compared to one ranked as Going-Transparent (GT) and two as Less-Transparent (LT). Content update, specific content, and statements of vision and misison are the dominant factors determining tendency to consider transparency in website state-owned enterprises.
3. Non-structural public agency is third category. WAES result for transparency rate of this category is shown in Table 3.
TABLE 3
The Percentage of Transparency in Websites of Non-Structural Public Agencies
NO PUBLIC AGENCY WEBSITE TRANSPARENCY (%) Pelaporan dan Analisis Transaksi Keuangan
(PPATK) is the only website with tendency toward ideal transparency, meaning that it remains within
Transparent (T) rank. The majority of websites remains in Quite-Transparent (QT) rank, and somehow, one website is located in Less-Transparent (LT) rank. The features of content update, specific content, explanation and instruction about requirement that must be met by information supplicants, and statements of vision and mission, are the dominant factors determining tendency toward transparency in websites of non-structural public agencies.
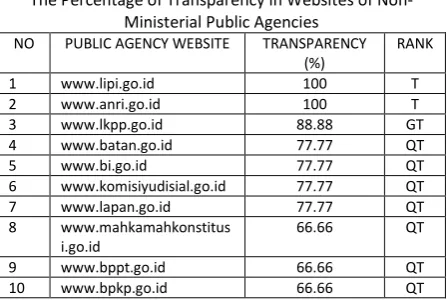
4. For non-ministerial public agency as fourth category, WAES result of transparency rate is indicated in Table 4.
TABLE 4
The Percentage of Transparency in Websites of Non-Ministerial Public Agencies
NO PUBLIC AGENCY WEBSITE TRANSPARENCY (%)
6 www.komisiyudisial.go.id 77.77 QT
7 www.lapan.go.id 77.77 QT the expected indicators of transparency. One website is found in Going-Transparent (GT) rank. The remaining or majority of websites of non-ministerial public agencies are ranked as Quite-Transparent (QT). Some features, such as content ownership, content update, specific content, statements of vision and mission, and press broadcast, are the dominant factors that determine a tendency of transparency in non-ministerial public agencies.
5. Transparency rate of provincial public agency as fifth category is shown in table 5.
TABLE 5
The Percentage of Transparency in Websites of Provincial Public Agencies
NO PUBLIC AGENCY
2 www.kalbarprov.go.id 77.77 QT
3 www.ntbprov.go.id 77.77 QT
4 www.jatengprov.go.id 77.77 QT
5 www.sumselprov.go.id 66.66 QT
6 www.bantenprov.go.id 66.66 QT
7 www.sumbarprov.go.id 66.66 QT
8 www.kaltimprov.go.id 66.66 QT
9 www.jatimprov.go.id 55.55 LT
138 As shown in Table 5, no ideal transparency is
found in websites of provincial public agencies. The highest transparency rate is shown by one website, or 10% of all samples, ranked as Going-Transparent (GT). The remaining 70% website samples tend to have transparency rate at rank of Quite-Transparent (QT) while 20% samples remain within Less-Transparent (LT). Features including content ownership, content update, specific content, and statements of vision and mission, are dominant factors that determine transparency tendency rate of website in provincial public agencies.
6. WAES-based transparency rate of ministerial public agency is shown in Table 6.
TABLE 6
The Percentage of Information Transparency in Websites of Ministerial Public Agencies
NO PUBLIC AGENCY
2 www.kemenperin.go.id 88.88 GT
3 www.kominfo.go.id 88.88 GT
As indicated by Table 6, only one website, or 10% of samples, can meet transparency indicators, or thus, be said as ideal. Three websites remain in Going-Transparent (GT) rank, while 60% websites include within Quite-Transparent (QT) rank. Content ownership, content update, specific content, explanation and instruction about requirement, and statements of vision and mission, are factors with dominant capacity to determine the rate of tendency toward transparency in websites of ministerial public agencies.
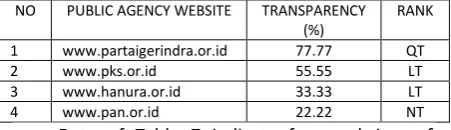
7. For national political party as seventh category, WAES transparency rate is shown in Table 7.
TABLE 7
The Percentage of Transparency in Websites of National Political Parties
NO PUBLIC AGENCY WEBSITE TRANSPARENCY (%)
RANK
1 www.partaigerindra.or.id 77.77 QT
2 www.pks.or.id 55.55 LT
3 www.hanura.or.id 33.33 LT
4 www.pan.or.id 22.22 NT
Data of Table 7 indicate four websites of national political parties in Indonesia, but none of them have ideal transparency or met all features of transparency. The majority of websites of national political parties, or 4 of them, are not ideal, or do
not meet all transparency features. Two (2) of them are Less-Transparent (LT), and one website is ranked as Not-Transparent (NT). Only one feature, respectively statements of vision and mission, represents the factor with dominant effect in determining transparency rate of national political
parties’ website.
Interactivity
This indicator consists of five features, such as: email link or dialog contact to call competent officers; comment column and dialog forum; registration for accepting update of announcement or newsletter; being connected to governmental or non-governmental website; download; and online service. Result of WAES on online public relations characteristic of public agencies to examine their
interactivity rate has shown several indications. 1. Interactivity of public college as public
agencies’ first category is shown in Table 8.
TABLE 8
The Percentage of Interactivity in Websites of Public Colleges ideally interactive because interactivity features of all website samples do not reach 100%. The websites at Quite-Interactive (QI) rank are 50% of sample total, while those ranked as Going-Interactive are 40% samples. One website remains in rank of Less-Interactive (LI). Some features, such as registration for accepting update of announcement or newsletter, download, and online service, are factors with dominant capacity to determine interactivity tendency in websites of public colleges.
2. Interactivity of State-Owned Enterprise as second category is shown in Table 9.
TABLE 9
139 10% of sample total, has ideal interactivity because it contains with updated interactivity features accessible by public. However, 40% samples are ranked as Less-Interactive (LI), although 40% others occupy Quite-Interactive (QI) rank. State-Owned Enterprises as public agencies are always profit-oriented and facing many competitors. Enterprises embrace interests of their stakeholders and the public because by this action, enterprises can utilize their interactive features to deliver information needed by stakeholders and public, and get feedback from it. Download and online service are the dominant factors that determine the tendency to use interactive features in websites of State-Owned Enterprises.
3. Table 10 indicates interactivity rate of non-structural public agencies as third category.
TABLE 10
The Percentage of Interactivity in Websites of Non-Structural Public Agencies (9) non-structural public agencies have interactivity in their website at range between 60% and 90%. Some websites or 50% of sample total have a tendency of Going-Interactive (GI). Some features, such as being connected to governmental or non-governmental website, download, and online service, are dominant factors determining tendency to use interactive features in websites of non-structural public agencies.
4. Interactivity rate of non-ministerial public agencies as fourth category is in Table 11.
TABLE 11
The Percentage of Interactivity in Websites of Non-Ministerial Public Agencies
NO PUBLIC AGENCY WEBSITE INTERACTIVITY (%)
6 www.komisiyudisial.go.id 80 GI
7 www.lapan.go.id 80 GI
Table 11 shows that only one website, or 10% of sample total, is found to be ideally interactive. Other results are also promising because 80% samples are included within Going-Interactive (GI) rank. Features, such as being connected to governmental or non-governmental website, download, and online service, are dominant factors that determine the tendency to use interactive features in websites of non-ministerial public agencies.
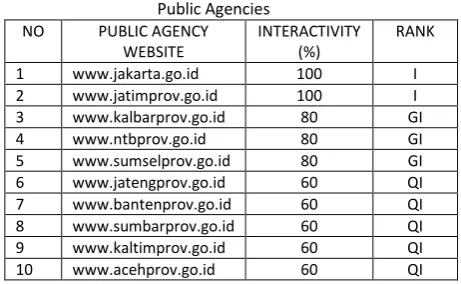
5. Table 12 indicates interactivity rate of provincial public agencies as fifth category.
TABLE 12
The Percentage of Interactivity in Websites of Provincial Public Agencies interactive. There are 30% of sample total showing Going-Interactive (GI) tendency, while the remaining 50% of samples indicate a result of Quite-Interactive (QI). Several features, including being connected to governmental or non-governmental website, download, and online service, are dominant factors determining the tendency to consider interactive features in websites of provincial public agencies.
140
TABLE 13
The Percentage of Interactivity in Websites of Ministerial Public Agencies category. Three (3) samples are Going-Interactive (GI and one sample is Quite-Interactive (QI). Somehow, there is still website ranked as Less-Interactive (LI) with tendency toward interactive only rated for 40%. Download and online service are two factors with dominant capacity in determining the tendency to use interactive features in ministerial websites.
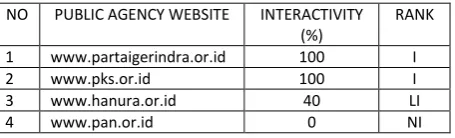
7. Table 14 shows interactivity rate of national political parties as seventh category.
TABLE 14
The Percentage of Interactivity in Websites of National Political Parties
NO PUBLIC AGENCY WEBSITE INTERACTIVITY (%)
RANK
1 www.partaigerindra.or.id 100 I
2 www.pks.or.id 100 I
3 www.hanura.or.id 40 LI
4 www.pan.or.id 0 NI
As Table 14 shows, of the websites from politcal parties, there are two (2) websites, or 50% of sample total, considered as ideally interactive. One website is Not-Interactive (NI) because it does not have interactive features, while one other website is Less-Interactive (LI) with only 40% tendency rates toward interactivity. Still few websites of political parties in the new age of bureaucratic reformation have interactivity with stakeholders. Or, most these websites tend to produce one-way information. Being connected to governmental or non-governmental website, and online service, are dominant factors that determine tendency to use interactive features in websites of national political parties.
Usability
The author proposes six (6) features of usability, such as bilingual or multilingual accesses, updated news, site map, FAQ, search engine, and specific database. The result of WAES analysis on the characteristic of online public relations in several public agencies would be explained in the following.
1. Table 15 shows usability rate of public colleges as first category of public agencies.
TABLE 15
The Percentage of Usability in Websites of Public Colleges usability. The reason is that the examined features of usability have the highest tendency to not reaching 100%. Most online public relations websites, or 80% of sample total, are ranked as Going-Usable (GU) with percentage of tendency toward usability attaining 83.33%. The remaining 20% websites are Quite-Usable (QU). Features including bilingual or multilingual accesses, updated news, search engine, and specific database, are the dominant factors in determining tendency of using usability features in websites of public colleges.
2. Usability rate of State-Owned Enterprises as second category is indicated in Table 16.
TABLE 16
141 Enterprises that embraces ideal usability features.
Most websites, or 50% of sample total, remain in Quite-Usable (QU) rank and the other 20% are located in Less-Usable (LU) rank. Some features, such as bilingual or multilingual accesses, search engine, and specific database, are dominant factors determining tendency to use usability features in websites of State-Owned Enterprises. 3. Table 17 indicates usability rate of
non-structural public agencies as third category.
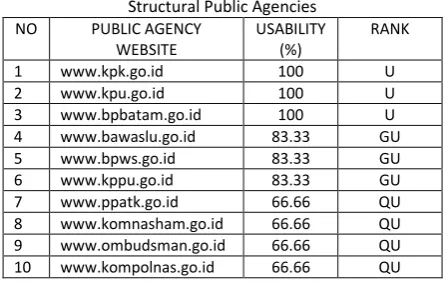
TABLE 17
The Percentage of Usability in Websites of Non-Structural Public Agencies
10 www.kompolnas.go.id 66.66 QU
Table 17 indicates that three websites of non-structural public agencies have internalized ideal usability features. These websites are those of
Komisi Pemberantasan Korupsi, Komisi Pemilihan
Umum, and Badan Pengusahaan Kawasan
Perdagangan Bebas dan Pelabuhan Bebas Batam.
Three other websites stand in the category of Going-Usable (GU), such as Badan Pengawas
Pemilihan Umum, Badan Pengembangan Wilayah
Surabaya-Madura, and Komisi Pengawas
Persaingan Usaha. The remaining 40% websites
are ranked as Quite-Usable (QU). Features of updated news, search engine, and specific database, are dominant factors that determine tendency to use usability features in websites of non-structural public agencies.
4. Usability rate of non-ministerial public agencies as fourth category is indicated in Table 18.
TABLE 18
The Percentage of Usability in Websites of Non-Ministerial Public Agencies
NO PUBLIC AGENCY WEBSITE USABILITY (%)
8 www.komisiyudisial.go.id 66.66 QU
9 www.mahkamahkonstitusi .go.id
66.66 QU
10 www.bpkp.go.id 33.33 NU
As exhibited in Table 18, of website samples of non-ministerial public agencies, only Bank Indonesia, or 10% of sample total, has tendency to use ideal usability features. There are 30% samples ranked as Going-Usable (GU). Most samples, or 50% of total, are included within Quiet-Usable (QU). One website is located in Not-Usable (NU). Search engine and specific database are dominant factors determining tendency to use usability features in websites of non-ministerial public agencies.
5. Table 19 displays usability rate of provincial public agencies as fifth category.
TABLE 19
The Percentage of Usability in Websites of Provincial Public Agencies
4 www.jatengprov.go.id 66.66 QU
5 www.bantenprov.go.id 66.66 QU
6 www.kaltimprov.go.id 66.66 QU
7 www.kalbarprov.go.id 50 LU internalized ideal usability features. The website of Provinsi Jawa Timur is ranked as Going-Usable (GU) with average tendency toward usability of 83.33%. The remaining 40% websites remain within Quite-Usable (QU) rank, whereas 40% other websites occupy Less-Usable (LU) rank. Features of updated news, search engine, and specific database, are factors with dominant effect in determining tendency of using usability features in websitesof provincial public agencies.
6. Usability rate of ministerial public agencies as sixth category is shown in Table 20.
TABLE 20
The Percentage of Usability in Websites of Ministerial Public Agencies
5 www.kemenperin.go.id 83.33 GU
6 www.dephub.go.id 83.33 GU
142 sample total, have ideal usability features. Three other websites are ranked as Going-Usable (GU) websites have facilitated public in accessing information through online public relations. Some features, such as updated news, search engine, and specific database, are factors with dominant effect in determining tendency of using usability features in websites of ministerial public agencies. 7. Table 21 indicates usability rate of national
political parties as seventh category.
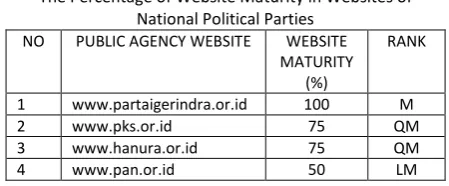
TABLE 21
The Percentage of Usability in Websites of National Political Parties
NO PUBLIC AGENCY WEBSITE USABILITY (%)
RANK
1 www.pks.or.id 83.33 GU
2 www.partaigerindra.or.id 50 LU
3 www.hanura.or.id 16.66 NU
4 www.pan.or.id 16.66 NU
As indicated by Table 21, of websites of national political parties examined, only website of
Partai Keadilan Sejahtera (PKS) is assigned into Going-Usable (GU) rank. One website is Less-Usable (LU). Two remaining websites occupy Not-Usable (NU) rank. Updated news is the only factor with dominant effect in determining usability in websites of ministerial public agencies.
Website Maturity
There are four (4) features in this indicator, including audio or video files, online blank, citizen consultation, and good operation (no features broken). Result of analysis on online public relations characteristic of public agencies’ websites with WAES is elaborated in the following.
1. Table 22 indicates website maturity rate of public colleges as first category of public agencies.
TABLE 22
The Percentage of Website Maturity in Websites of Public Colleges
As Table 22 shows, 90% websites of Indonesia public colleges are Quite-Mature (QM), whereas one website, or 10% samples, is Less-Mature (LM). Features of audio or video files and online blank are dominant factors that determine tendency to use website maturity features in websites of public colleges.
2. Website maturity rate of state-owned enterprises as second cateory is shown in Table 23.
TABLE 23
The Percentage of Website Maturity in Websites of State-Owned Enterprises state-owned enterprise with website classified as Mature (M) or ideal. The majority of websites, or 70% of them, are Quite-Mature (QM). PT Jasa Tirta II is the only enterprise that is Not-Mature (NM). The website of PT Pelindo III is Less-Mature (LM). Audio or Video Files is the factor with dominant capacity in determining tendency of using website maturity features in websites of state-owned enterprises.
3. Table 24 shows website maturity of non-structural public agencies as fourth category.
TABLE 24
The Percentage of Website Maturity in Websites of Non-Structural Public Agencies
143
9 www.komnasham.go.id 50 LM
10 www.kompolnas.go.id 50 LM
As shown by Table 24, some websites or 50% of sample total are ranked as Quite-Mature (QM), while the other 50% are classified Less-Mature (LM). Features of audio or video files and online blank are dominant factors that determine tendency to use website maturity features in websites of non-structural public agencies. 4. Website maturity of non-ministerial public
agencies as fourth category is indicated in Table 25.
TABLE 25
The Percentage of Website Maturity in Websites of Non-Ministerial Public Agencies
NO PUBLIC AGENCY WEBSITE WEBSITE MATURITY
7 www.komisiyudisial.go.id 75 QM
8 www.bpkp.go.id 75 QM
9 www.lapan.go.id 50 LM
10 www.lipi.go.id 50 LM
As indicated by Table 25, website of
Mahkamah Konstitusi is the only website with tendency of using website maturity features reaching 100%, or considered as ideally mature. Most websites, or 70% of sample total, are Quite-Mature (QM). However, two websites or 20% samle total are Less-Mature (LM). Features such as audio and video files and online blank are factors with dominant effect in determining tendency to use website maturity features in websites of non-ministerial public agencies.
5. Table 26 shows website maturity of provincial public agencies as fifth category.
TABLE 26
The Percentage of Website Maturity in Websites of Provincial Public Agencies
4 www.jatengprov.go.id 66.66 QM
5 www.bantenprov.go.id 66.66 QM
6 www.kaltimprov.go.id 66.66 QM
7 www.kalbarprov.go.id 50 LM Provinsi Jawa Timur remains at Quite-Mature (QM) rank with tendency rate of 83.33%. The other 40% websites of provincial government are Quite-Mature (QM) while the remaining 40% are Less-Mature (LM). Both audio or video files and online blank are factors with dominant capacity in determining tendency to use website maturity features in websites of provincial public agencies. 6. Website maturity of ministerial public agencies
as sixth category of public agencies is displayed in Table 27.
TABLE 27
The Percentage of Website Maturity in Websites of Ministerial Public Agencies tendency rate toward ideal website maturity. Therefore, this website remains within Mature (M) rank. Majority of samples, or 50% of sample total, are Quite-Mature (QM), while 40% are classified as Less-Mature (LM). Features such as audio or video files and online blank are factors with dominant capacity to determine tendency to use website maturity features in websites of ministerial public agencies.
7. Table 28 exhibits website maturity of national political parties as seventh category of public agencies.
TABLE 28
The Percentage of Website Maturity in Websites of National Political Parties
NO PUBLIC AGENCY WEBSITE WEBSITE MATURITY
(%)
RANK
1 www.partaigerindra.or.id 100 M
144 25% samples are Less-Mature (LM). Online blank is
a factor with dominant effect in determining tendency to use website maturity features in websites of national political parties.
CONCLUSION
Research about online public relations activity within Indonesia context has not been previously attempted. Asian and European countries have been exposed to the research of online PR activity. Some researchers put great interest to review online public relations activity because they experience a transition from a traditional public relations to a new age of public relations that uses new communication media, including Internet. The new product is then called as public relations on the net, or known as online public relations. This research raises a theme which is very relevant with the regulation of public information transparency, namely Law No.14/2008 on Public Information Transparency. This law requires public relations of public agencies to deliver public information in transparent and accountable ways. Result of evaluation using
Website Attribute Evaluation System (WAES) shows
that despite its utilization as online public relations, only few websites of Indonesia public agencies have shown indicators of transparency, interactivity, usability, and website maturity in ideal manner. To convey information through transparent and accountable ways, public
agencies’ websites must take account transparency
and accountability aspects to improve trust and legitimacy rates from the public [3]. This research is the first research that examines public agencies’ activity in Indonesia using Website Attribute Evaluation System (WAES). This research is done by examining features presented in website of public agencies. Method of research is quantitative. It measures how far is the tendency to use the expected features. Result of analysis with WAES shows that some indicators of public information
transparency have been used in public agencies’
website and there are dominant factors or items in each indicator. Further research is suggested to examine similar theme but to approach it through different method or involving different indicators. The development of online public relations activity at certain period can also be elaborated.
ACKNOWLEDGEMENT
Great appreciation was given to the synergy between the author with Indonesian Institute of Sciences that gave scholarships to researcher. Thanks were also handed over to informants in the division of public relations from
many public agencies in Indonesia for their willingness to share data related to this research, and also their assistance to enrich the content of research.
REFERENCES
[1] Putnam, R.,D. (1995). Bowling alone: America’s declining social capital. Journal of Democracy.
6(1), 65–78.
[2] Heise, J.A. (1985). Toward closing the confidence gap: An alternative approach to communication between public and government. Public Affairs Quarterly. 9(2), 196– 217.
[3] Gant , D.B., and Gant , J.P. (2002) . Enhancing e-service delivery . e- government series, state web portals: Delivering and Financing E-Service
. Pricewaterhouse Coopers Endowment . [4] Welch, C. H., and Moon, M.J. (2005). ‘Linking
citizen satisfaction with e-government and trust
in government’. Journal of Public
Administration Research and Theory. 15 (3), 371–91.
[5] Grunig, J. E., & Jaatinen, M. (1999). Strategic, symmetrical public relations in government: From pluralism to societal corporatism. Journal
of Communication Management. 3, 218-234.
[6] Kriyantono, R. (2012). Teknik praktis riset komunikasi: Disertai contoh praktis riset public relations, komunikasi organisasi, media massa
dan pemasaran. Jakarta: Prenada media.
[7] Bungin, B. (2014). Metodologi penelitian
kuantitatif: Komunikasi, ekonomi, dan
kebijakan publik serta ilmu sosial lainnya. Jakarta: Prenadamedia.
[8] Demchak, C.C., Friis., and La Porte, T.M. (2000).
Webbing governance: National differences in constructing the public face. Garson, G.D (ed), Handbook of public information system. New York: Marcel Dekker.
[9] La Porte, T.M., Demchak, C.C. and De Jong, M.
(2002). ‘Democracy and bureaucracy in the age
of the web. Empirical Findings and Theoretical